. 2015:2015:157825.
doi: 10.1155/2015/157825. Epub 2015 May 18.

High Order Statistics and Time-Frequency Domain to Classify Heart Sounds for Subjects under Cardiac Stress Test

Affiliations

High Order Statistics and Time-Frequency Domain to Classify Heart Sounds for Subjects under Cardiac Stress Test

Ali Moukadem et al. Comput Math Methods Med. 2015.

Abstract

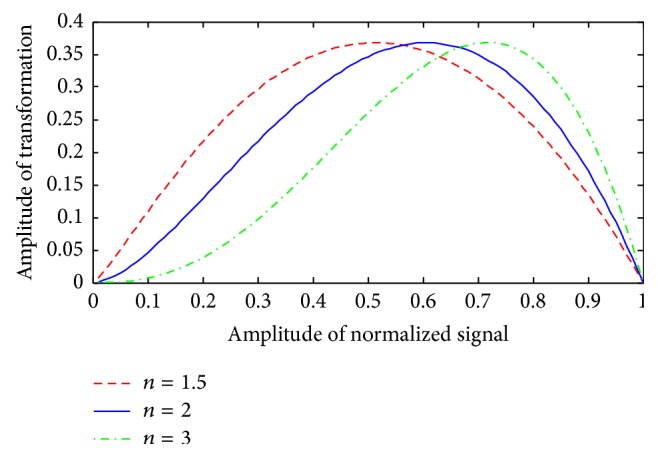
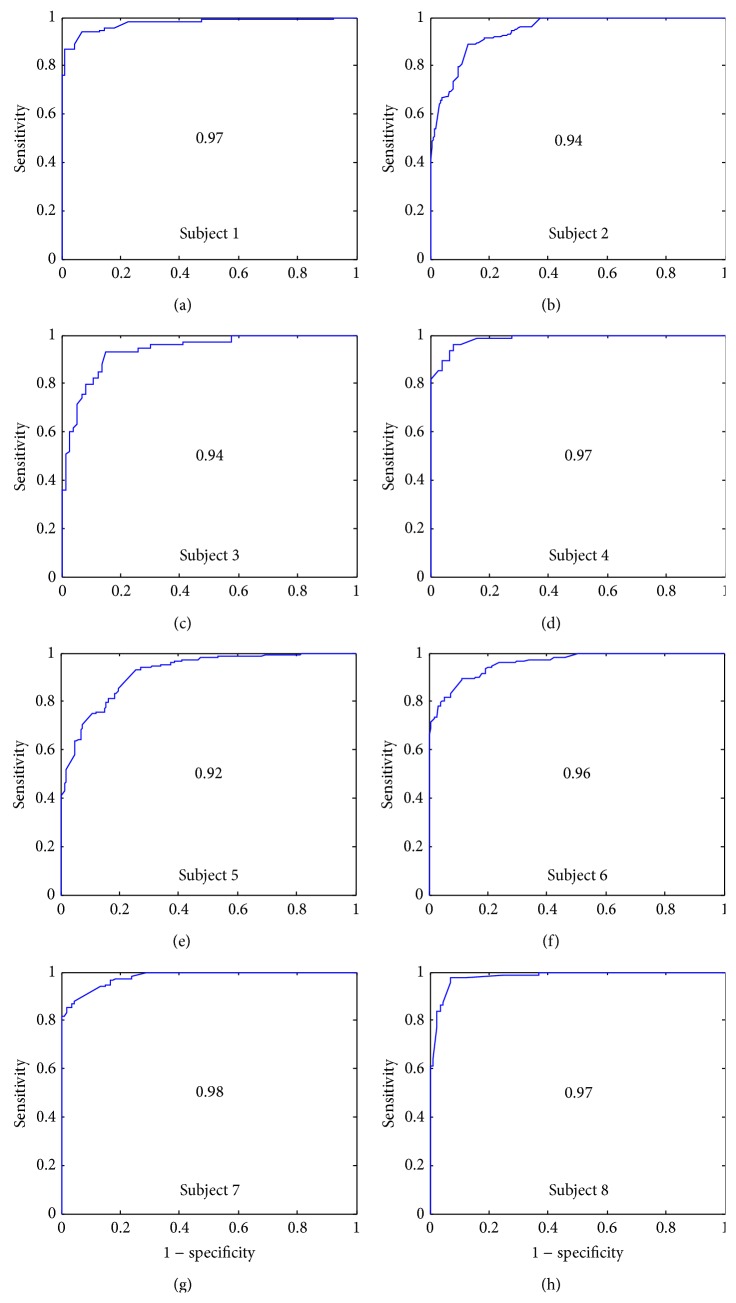
This paper considers the problem of classification of the first and the second heart sounds (S1 and S2) under cardiac stress test. The main objective is to classify these sounds without electrocardiogram (ECG) reference and without taking into consideration the systolic and the diastolic time intervals criterion which can become problematic and useless in several real life settings as severe tachycardia and tachyarrhythmia or in the case of subjects being under cardiac stress activity. First, the heart sounds are segmented by using a modified time-frequency based envelope. Then, to distinguish between the first and the second heart sounds, new features, named α(opt), β, and γ, based on high order statistics and energy concentration measures of the Stockwell transform (S-transform) are proposed in this study. A study of the variation of the high frequency content of S1 and S2 over the HR (heart rate) is also discussed. The proposed features are validated on a database that contains 2636 S1 and S2 sounds corresponding to 62 heart signals and 8 subjects under cardiac stress test collected from healthy subjects. Results and comparisons with existing methods in the literature show a large superiority for our proposed features.


Figures

Figure 1
Figure 1
Synchronized ECG and PCG signals for a subject under cardiac stress test.
Figure 2
Figure 2
Normal heart sound with the HFS envelope and the magnitude of the S-Transform showing the higher frequency content in S1 compared to S2.
Figure 3
Figure 3
Segmented sound with the HFS envelope and the magnitude of the S-transform of the corresponding heart sound showing that HFS signature does not correspond necessarily to just one class.
Figure 4
Figure 4
The envelope of normalized signal for values of n = 1.5, 2, and 3.
Figure 5
Figure 5
The influence of the values of n in the SSE envelope for the detection of S2 sounds with very low intensities.
Figure 6
Figure 6
S1 and S2 signals (a) and optimized S-transform obtained with α = 0.8 for S1 and α = 0.5 for S2 (b).
Figure 7
Figure 7
S1 (left) and S2 (right) signals and their normalized SSE envelopes with the values of β (bottom).
Figure 8
Figure 8
S1 (left) and S2 (right) signals and their normalized SSE envelopes with the values of γ (bottom).
Figure 9
Figure 9
Receiver operation characteristic curves for feature α and for all subjects.
Figure 10
Figure 10
Receiver operation characteristic curves for feature β and for all subjects.
Figure 11
Figure 11
Receiver operation characteristic curves for feature γ and for all subjects.
Figure 12
Figure 12
Example of a segmented stress test heart sound for subject 4 and workload level 6 (HR = 181 bmp) with the values of α, β, and γ calculated for each located sound (S1 and S2).
Figure 13
Figure 13
Global receiver operation characteristic curves for α (Feature 1, AUC = 0.85), β (Feature 2, AUC = 0.87), γ (Feature 3, AUC = 0.96), and HFS (AUC = 0.6) features.
Figure 14
Figure 14
Example of a segmented stress test heart sounds with three different SNR ratios (12, 5, and 0 dB) with the values of γ calculated for each located sound (S1 and S2).
Figure 15
Figure 15
The variation of the high frequency content ratio (S2/S1) over the HR for all subjects. The red lines indicate the high frequency content of S2 becoming lower than that of S1.
Figure 16
Figure 16
The S-transform of two sounds corresponding to the same subject and two different heart rates ((a) HR = 80 bpm, (b) 142 bpm)) showing the high frequency content of S2 decreasing when the heart rate is higher.

References

    1. Debbal S. M., Bereksi Reguig F. Choix de l'ondelette analysante et classification des signaux phonocardiogrammes en fonction des souffles surajoutés. Afrique Science. 2004;1(1):1–13.
    1. Moukadem A., Dieterlen A., Hueber N., Brandt C. A robust heart sounds segmentation module based on S-transform. Biomedical Signal Processing and Control. 2013;8(3):273–281. doi: 10.1016/j.bspc.2012.11.008. - DOI
    1. Dokur Z., Ölmez T. Heart sound classification using wavelet transform and incremental self-organizing map. Digital Signal Processing: A Review Journal. 2008;18(6):951–959. doi: 10.1016/j.dsp.2008.06.001. - DOI
    1. Gupta C. N., Palaniappan R., Swaminathan S., Krishnan S. M. Neural network classification of homomorphic segmented heart sounds. Applied Soft Computing Journal. 2007;7(1):286–297. doi: 10.1016/j.asoc.2005.06.006. - DOI
    1. Sepehri A. A., Gharehbaghi A., Dutoit T., Kocharian A., Kiani A. A novel method for pediatric heart sound segmentation without using the ECG. Computer Methods and Programs in Biomedicine. 2010;99(1):43–48. doi: 10.1016/j.cmpb.2009.10.006. - DOI - PubMed

Publication types

LinkOut - more resources