. 2015 Apr 2:6:2041731415579215.
doi: 10.1177/2041731415579215. eCollection 2015.

Analysis of type II diabetes mellitus adipose-derived stem cells for tissue engineering applications

Affiliations

Analysis of type II diabetes mellitus adipose-derived stem cells for tissue engineering applications

Danielle Marie Minteer et al. J Tissue Eng. .

Abstract

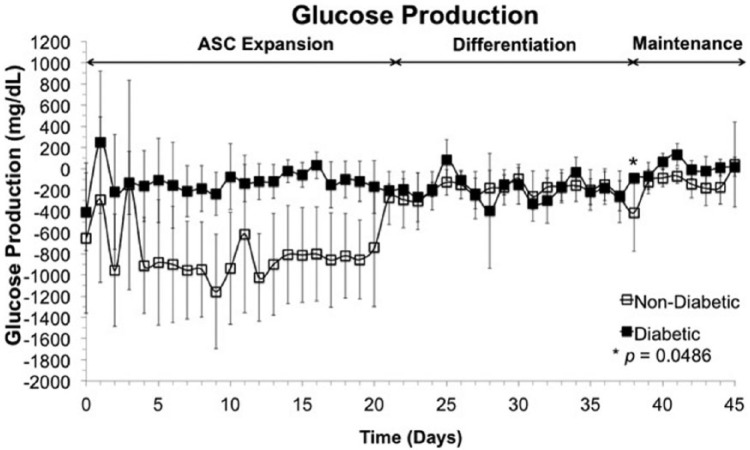
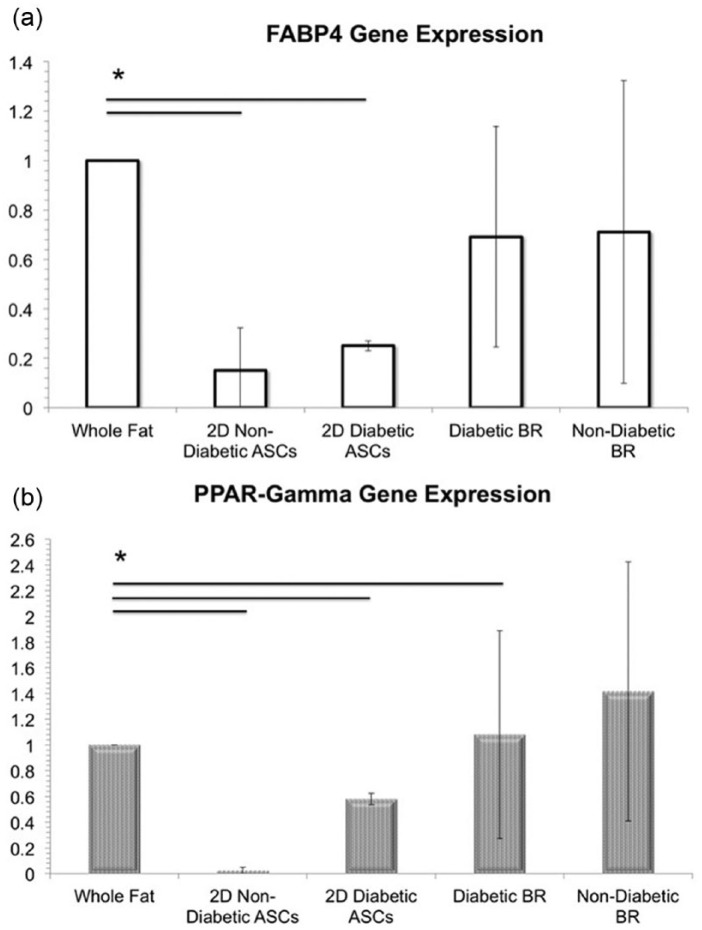
To address the functionality of diabetic adipose-derived stem cells in tissue engineering applications, adipose-derived stem cells isolated from patients with and without type II diabetes mellitus were cultured in bioreactor culture systems. The adipose-derived stem cells were differentiated into adipocytes and maintained as functional adipocytes. The bioreactor system utilizes a hollow fiber-based technology for three-dimensional perfusion of tissues in vitro, creating a model in which long-term culture of adipocytes is feasible, and providing a potential tool useful for drug discovery. Daily metabolic activity of the adipose-derived stem cells was analyzed within the medium recirculating throughout the bioreactor system. At experiment termination, tissues were extracted from bioreactors for immunohistological analyses in addition to gene and protein expression. Type II diabetic adipose-derived stem cells did not exhibit significantly different glucose consumption compared to adipose-derived stem cells from patients without type II diabetes (p > 0.05, N = 3). Expression of mature adipocyte genes was not significantly different between diabetic/non-diabetic groups (p > 0.05, N = 3). Protein expression of adipose tissue grown within all bioreactors was verified by Western blotting.The results from this small-scale study reveal adipose-derived stem cells from patients with type II diabetes when removed from diabetic environments behave metabolically similar to the same cells of non-diabetic patients when cultured in a three-dimensional perfusion bioreactor, suggesting that glucose transport across the adipocyte cell membrane, the hindrance of which being characteristic of type II diabetes, is dependent on environment. The presented observation describes a tissue-engineered tool for long-term cell culture and, following future adjustments to the culture environment and increased sample sizes, potentially for anti-diabetic drug testing.

Keywords: Adipocytes; adipogenesis; bioreactor; cell and tissue culture; cell cultures; diabetes research; mesenchymal stem cells; stem cells—adipose; three-dimensional; tissue culture models; tissue engineering.


Conflict of interest statement

Declaration of conflicting interests: The authors declare that there is no conflict of interest.

Figures

Figure 1.
Figure 1.
Hollow fiber–based bioreactor setup. (a) Photograph of an 8 mL-volume hollow fiber–based bioreactor used; (b) bioreactors incorporated onto the perfusion system and pumps as utilized in the presented work; and (c) schematic of nutrient/gas flow in and out of the bioreactor cell compartments through the porous, hollow fiber membranes.
Figure 2.
Figure 2.
Metabolic activity. Glucose production/consumption trends of three bioreactors seeded with ASCs from non-diabetic patients (empty squares) and three bioreactors seeded with ASCs from type II diabetic patients (filled squares) over 45 days of culture. Days 0–21 represent a time period in which ASCs were allowed to expand within the bioreactor; throughout days 22–36, ASCs were influenced to differentiate into adipocytes by a medium change; adipocytes were maintained from days 37 to 45. Glucose consumption is mostly not significantly different (*p = 0.0498, N = 3) within tissue derived from diabetic patients as to tissue derived from patients without diabetes.
Figure 3.
Figure 3.
Adipocyte functionality. All six bioreactors were stimulated with TNF-α for 24 h, and glucose consumption was measured and noted to be hindered. After reaching a steady glucose consumption rate, insulin was introduced to the system and the functional adipocytes were able to recover from the TNF-α dosage as glucose consumption increased. Tissue from diabetic patients (filled squares) functions with mostly no significant difference (*p < 0.05, N = 3) to tissue from patients without diabetes (empty squares) when stimulated with TNF-α and insulin.
Figure 4.
Figure 4.
Histology. End-point (45 days) histology from bioreactors containing adipose tissue generated from patients (a, b) without or (c, d) with type II diabetes mellitus, where (a) and (c) are H&E, and (b) and (d) are Masson’s Trichrome; all were captured at 40× magnification; scale bar = 100 µm.
Figure 5.
Figure 5.
Immunohistochemistry. End-point (45 days) AdipoRed/DAPI/Phalloidin immunohistochemistry from bioreactors containing adipose tissue generated from patients (a) without or (b) with type II diabetes mellitus at 20×; scale bar = 100 µm.
Figure 6.
Figure 6.
Scanning electron micrographs. Scanning electron microscopy (SEM) images of adipocytes on fibers extracted from bioreactors after 45 days of culture inoculated with ASCs from (a–d) patients without type II diabetes mellitus and (e–h) patients with type II diabetes mellitus. Adipose tissue is indicated by white arrows at 45× and 100×.
Figure 7.
Figure 7.
Gene expression. (a) Fatty acid binding protein-4 (FABP4, solid white bars) and (b) peroxisome proliferator–activated receptor-γ (PPAR-γ, dotted white bars) gene expression is significantly higher (*p < 0.05,) in whole fat than in ASCs grown in 2D culture. PPAR-γ gene expression was higher in whole fat compared to both 2D ASC controls and samples extracted from the diabetic bioreactor culture (p < 0.05, N = 3), whereas, PPAR-γ gene expression was not significantly different in samples extracted from the non-diabetic bioreactor culture (p > 0.05, N = 3).
Figure 8.
Figure 8.
Protein expression. Images obtained from Western blots measuring protein expression of PPAR-γ or GAPDH of (a) adipose tissue cultured within the bioreactors over 45 days from diabetic patients and adipose tissue cultures within the bioreactors from non-diabetic patients or (b) ASCs cultured in two-dimensional tissue culture flasks as a negative control, native human whole fat sample as a positive control.

References

    1. Center for Disease Control. Adult obesity facts, 13 August 2012, http://www.cdc.gov/obesity/data/adult.html (accessed 6 November 2012).
    1. Center for Disease Control. National diabetes fact sheet, 2011, http://www.cdc.gov/diabetes/pubs/pdf/ndfs_2011.pdf (accessed 6 November 2012).
    1. Cnop M, Welsh N, Jonas JC, et al. Mechanisms of pancreatic β-cell death in type 1 and type 2 diabetes: many differences, few similarities. Diabetes 2005; 54(2): S97–S107. - PubMed
    1. Greenberg AS, Obin MS. Obesity and the role of adipose tissue in inflammation and metabolism. Am J Clin Nutr 2006; 83: 461S–4615S. - PubMed
    1. Marcelino H, Veyrat-Durebex C, Summermatter S, et al. A role for adipose tissue de novo lipogenesis in glucose homeostasis during catch-up growth. Diabetes 2013; 62(2): 362–372. - PMC - PubMed

LinkOut - more resources