. 2015 Jun 19;9(6):e0003849.
doi: 10.1371/journal.pntd.0003849. eCollection 2015 Jun.

Trypanosoma cruzi Infection through the Oral Route Promotes a Severe Infection in Mice: New Disease Form from an Old Infection?

Affiliations

Trypanosoma cruzi Infection through the Oral Route Promotes a Severe Infection in Mice: New Disease Form from an Old Infection?

Juliana Barreto-de-Albuquerque et al. PLoS Negl Trop Dis. .

Abstract

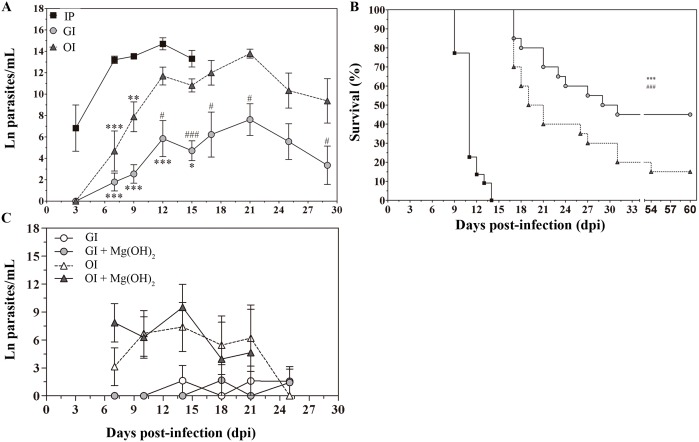
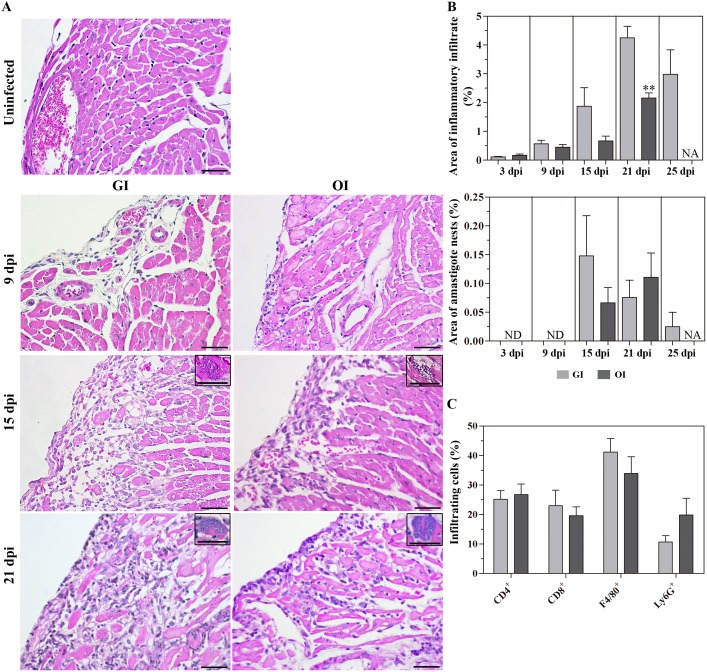
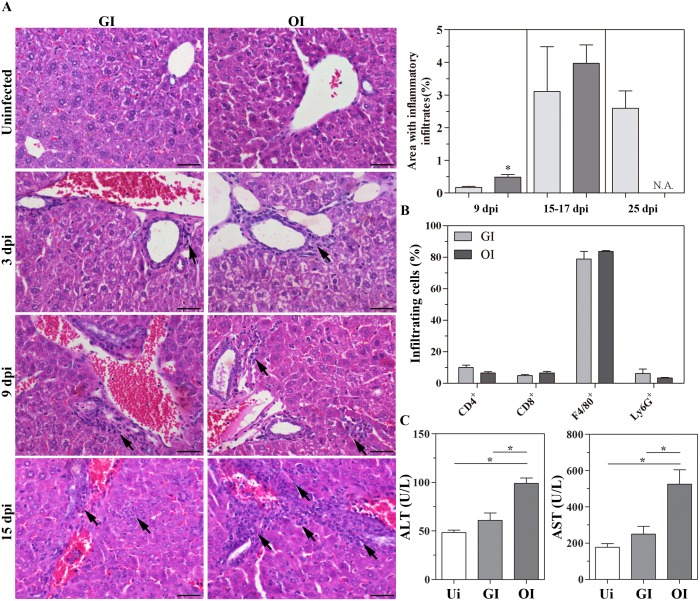
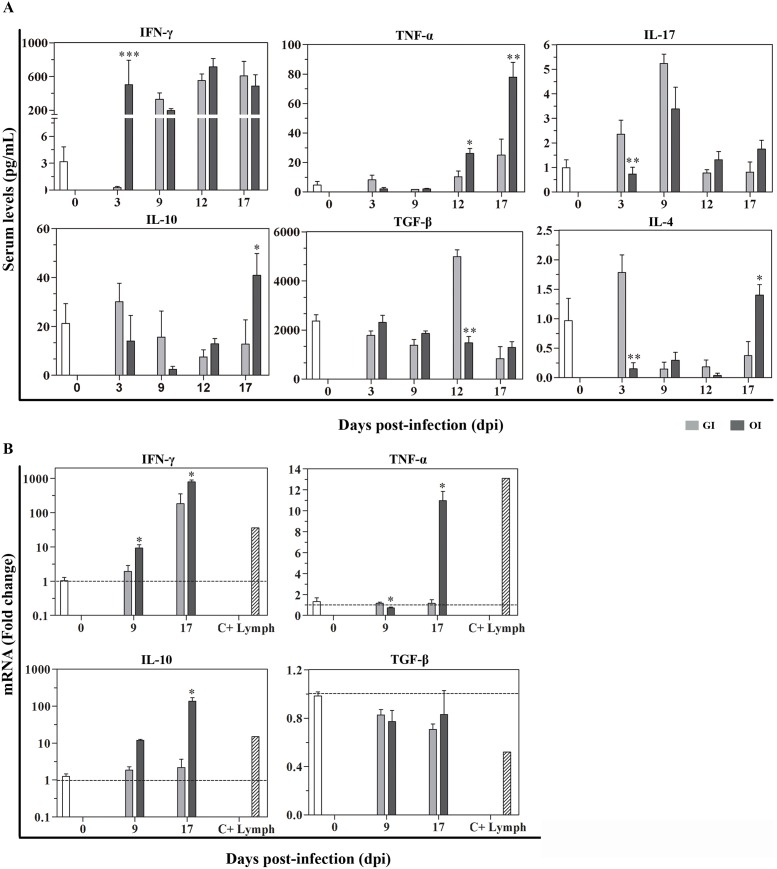
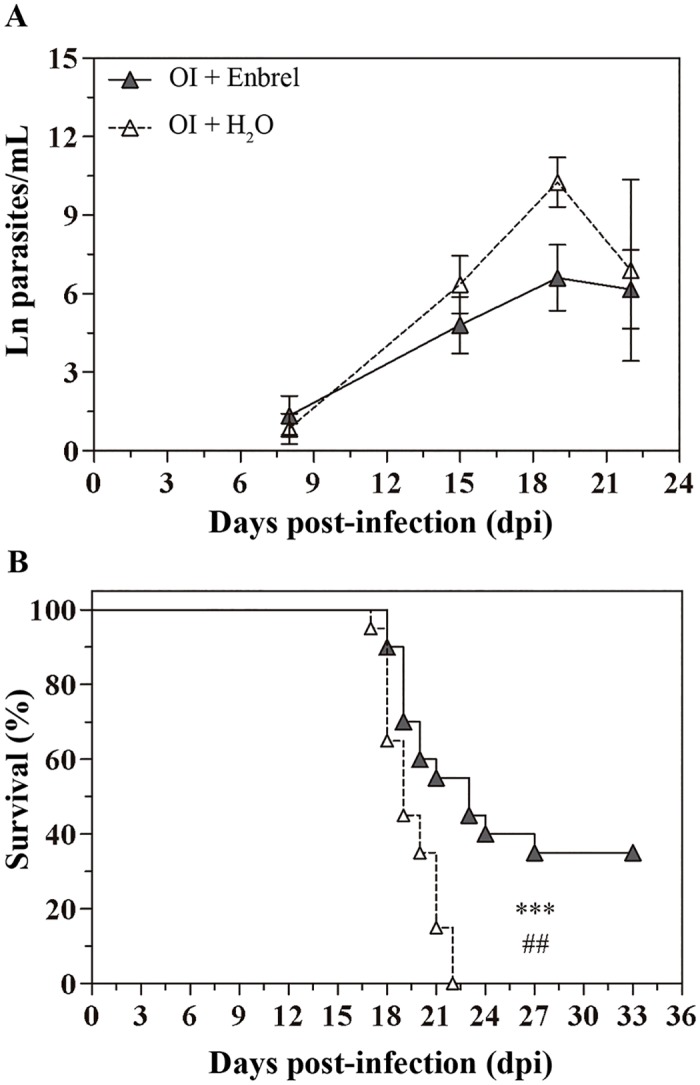
Oral transmission of Chagas disease has been documented in Latin American countries. Nevertheless, significant studies on the pathophysiology of this form of infection are largely lacking. The few studies investigating oral route infection disregard that inoculation in the oral cavity (Oral infection, OI) or by gavage (Gastrointestinal infection, GI) represent different infection routes, yet both show clear-cut parasitemia and heart parasitism during the acute infection. Herein, BALB/c mice were subjected to acute OI or GI infection using 5x10(4) culture-derived Trypanosoma cruzi trypomastigotes. OI mice displayed higher parasitemia and mortality rates than their GI counterparts. Heart histopathology showed larger areas of infiltration in the GI mice, whereas liver lesions were more severe in the OI animals, accompanied by higher Alanine Transaminase and Aspartate Transaminase serum contents. A differential cytokine pattern was also observed because OI mice presented higher pro-inflammatory cytokine (IFN-γ, TNF) serum levels than GI animals. Real-time PCR confirmed a higher TNF, IFN-γ, as well as IL-10 expression in the cardiac tissue from the OI group compared with GI. Conversely, TGF-β and IL-17 serum levels were greater in the GI animals. Immunolabeling revealed macrophages as the main tissue source of TNF in infected mice. The high mortality rate observed in the OI mice paralleled the TNF serum rise, with its inhibition by an anti-TNF treatment. Moreover, differences in susceptibility between GI versus OI mice were more clearly related to the host response than to the effect of gastric pH on parasites, since infection in magnesium hydroxide-treated mice showed similar results. Overall, the present study provides conclusive evidence that the initial site of parasite entrance critically affects host immune response and disease outcome. In light of the occurrence of oral Chagas disease outbreaks, our results raise important implications in terms of the current view of the natural disease course and host-parasite relationship.


Conflict of interest statement

The authors have declared that no competing interests exist.

Figures

Fig 1
Fig 1. Severity of acute T. cruzi infection is higher in orally infected mice.
A/B) Male BALB/c mice were infected with 5x10⁴ tissue culture-derived trypomastigotes forms of T. cruzi (Tulahuén strain) through gavage (GI) or oral cavity (OI). C) GI and OI T. cruzi inoculation was performed with antacid (Magnesium Hydroxide suspension, 19.4 mg/Kg) or medium. A/C) Parasitemia (mean and SEM) was assessed during the acute phase and expressed as ln parasites per milliliter for statistical analysis. Parasites were counted by light microscopy, and parasitemia calculated by the Brener method. Parasitemia comparisons were performed at different days post-infection (dpi), Kruskal-Wallis, Dunn’s post-test (until 15 dpi) and one-tailed Mann-Whitney (after 15 dpi) tests were used. A) n: IP, 3 dpi = 3, 7 dpi = 17, 9 dpi = 10, 12 dpi = 5, 15 dpi = 3; GI, 3dpi = 7; 7 dpi = 22; 9 dpi = 29; 12 dpi = 17; 15 dpi = 45; 17 dpi = 10; 21 dpi = 24; 25 dpi = 16; 29 dpi = 11 and OI, 3 dpi = 4; 7 dpi = 9; 9 dpi = 14; 12 dpi = 22; 15 dpi = 40; 17 dpi = 12; 21 dpi = 14; 25 dpi = 8; 29 dpi = 6. Lower numbers represent early stages, when parasitemia was still undetectable and final stages, when mortality rates were too high. The total number was obtained from different experiments. * represent differences in comparison to IP and #, differences between GI and OI. C) GI = 7 and OI = 7 from Mg(OH)2 treated mice and controls. B) Mortality was followed and survival was analyzed by Log-rank (Mantel-Cox) (*) and Gehan-Breslow-Wilcoxon (#) tests. n = 20 mice (equivalent to 100%). Statistical analysis was performed using GraphPad Prism 5. * p = 0.05; ** p = 0.01; *** p = 0.001.
Fig 2
Fig 2. Hearts of GI infected mice are more inflamed than the OI infected mice.
Male BALB/c mice were infected with 5x10⁴ tissue culture-derived trypomastigotes forms of T. cruzi (Tulahuén strain) through gavage (GI) or oral cavity (OI). Hearts were harvested at different days post-infection (dpi), fixed and embedded in paraffin. A) Histological longitudinal sections were stained by Hematoxylin-Eosin. For the quantification of inflammatory infiltrate and amastigotes nests in heart tissue, a relative area of infiltrate/or amastigote nests from 50 fields (400X) was analyzed. Pictures represents cells-rich infiltrated areas. B) Values are the mean ± SEM. n = 4–5 mice/dpi/group. *GI versus OI. C) Immunofluorescence analyses demonstrating the percentage of each subset present within the tissue after 16/17 dpi, CD4+, CD8+, F4/80+ and Ly6G+ cells. Numbers represent mean±SEM. n = 3 mice/group (two different sections from each mouse). Statistical analysis was performed using GraphPad Prism 5. Comparison between GI and OI groups was performed by using one-tailed Mann-Whitney test. * p = 0.05; **p = 0.01; ***p = 0.001. dpi, days post-infection. Ui, uninfected. N.A., not analyzed. Bars represent 20 μm. Inserts show amastigote nests.
Fig 3
Fig 3. Liver histology during acute Trypanosoma cruzi infection after GI and OI inoculation.
Male BALB/c mice were infected with 5x10⁴ tissue culture-derived trypomastigotes forms of T. cruzi (Tulahuén strain) through gavage (GI) or within oral cavity (OI). A) Hematoxylin and Eosin stained sections demonstrating liver histological lesions in terms of inflammatory foci. For the quantification of inflammatory infiltrate, the relative area of infiltration from 25 fields (200X) was analyzed. Pictures represents cells-rich infiltrated areas. n: GI, 9 dpi = 4, 15–17 dpi = 4, 25 dpi = 5; OI, 9 dpi = 4, 15–17 dpi = 9. B) Immunofluorescence analyses demonstrating the percentage of each subset present within the tissue after 16/17 dpi, CD4+, CD8+, F4/80+ and Ly6G+ cells. Numbers represent mean± SEM. n = 3 mice/group (two different section from each mouse). C) ALT and AST activity (17 dpi) in sera. All statistical analyses were performed using one-tailed Mann-Whitney test, GraphPad Prism 5. Comparison between GI and OI groups, and each one of them with uninfected mice. *, p = 0.05; **, p = 0.01; ***, p = 0.001. Bars represent 20 μm. Arrows show inflammatory infiltrates.
Fig 4
Fig 4. Cytokine production in GI and OI infected mice.
Male BALB/c mice were infected with 5x10⁴ tissue culture-derived trypomastigotes forms of T. cruzi (Tulahuén strain) through gavage (GI) or within oral cavity (OI). A) In the course of acute infection, serum was isolated and levels of cytokines (IFN-γ, TNF, IL-17, IL-10 and TGF-β) were quantified in uninfected control and infected mice by a multiplex analysis. The results are expressed as the mean values (±SEM) for each group/day post-infection. n: IFN-γ, uninfected (0) = 12; 3 dpi GI = 11, OI = 5; 9 dpi GI = 8, OI = 5; 12 dpi GI = 9, OI = 4; 17 dpi GI = 4, OI = 6. TNF, uninfected (0) = 11; 3 dpi GI = 10, OI = 10; 9, 12 dpi, GI = 3, OI = 3; 17 dpi, GI = 6, OI = 11. IL-17, uninfected (0) = 12; 3 dpi, GI = 10, OI = 10; 9 dpi, GI = 3, OI = 3; 12 dpi, GI = 5, OI = 5; 17 dpi, GI = 6, OI = 14. TGF-β, uninfected (0) = 6; 3 dpi, GI = 4, OI = 4; 9 dpi, GI = 5, OI = 5; 12 dpi, GI = 5, OI = 4; 17 dpi, GI = 2, OI = 5. IL-10 and IL-4, uninfected (0) = 6; 3, 9, 12 dpi, GI = 6, OI = 6; 17 dpi, GI = 3, OI = 8. B) Cytokine gene expression levels were performed by RT-qPCR. Total RNA was isolated from the heart at different days post-infection, and the reaction was performed using SYBR Green Master Mix. HPRT and β-actin were used as housekeeping genes. RT-qPCR data were normalized to the housekeeping genes, and fold changes were determined compared with uninfected controls, using the Expression Suite software. Lymphocytes from subcutaneous lymph nodes of infected mice were stimulated with anti-CD3 and used as positive control of cytokines production (C+ Lymph). Statistical analysis was performed using ΔCt values. n: uninfected (0) = 5–9; 9 dpi GI = 3, OI = 2–3; 17 dpi GI = 2–3, OI = 2–3. Both sets of data were analyzed using one-tailed Mann-Whitney test, GraphPad Prism 5. *, p = 0.05; **, p = 0.01; ***, p = 0.001. *GI versus OI. Kruskal-Wallis (Dunn’s post-test) for group kinetics: A) IFN-γ, TNF and IL-10 increased in both groups compared with uninfected. IL-17 presented a non-significant increase followed by decrease. TGF-β was only elevated in GI group at 12 dpi in sera. B) IFN-γ increased in both groups compared with uninfected. TNF and IL-10 increased in OI whereas TGF-β decreased in GI.
Fig 5
Fig 5. F4/80+ cells are the major TNF-producing cells.
Male BALB/c mice were infected with 5x10⁴ tissue culture-derived trypomastigotes forms of T. cruzi (Tulahuén strain) through gavage (GI) or within oral cavity (OI). Immunofluorescence analyses demonstrated the percentage of TNF-producing cells among each subset present within the tissue after 16/17 dpi, CD4+, CD8+, F4/80+ and Ly6G+ cells. A) heart and B) liver. Numbers represent mean±SEM. n = 3 mice/group (two different sections from each mouse).
Fig 6
Fig 6. Anti-TNF therapy improves the survival of orally infected mice.
Male BALB/c mice were infected with 5x10⁴ tissue culture-derived trypomastigotes forms of T. cruzi (Tulahuén strain) within oral cavity (OI). Anti-TNF treatment with etanercept began after 14 dpi and was performed weekly. A) Parasitemia (mean and SEM of ln parasite/mL) and B) mortality were followed during the acute phase and subjected to statistical analysis. Parasites were counted by light microscopy, and parasitemia calculated by Brener method. Statistical analysis was performed using GraphPad Prism 5. For parasitemia comparisons on days 8, 15, 19 and 22 dpi, one-tailed Mann-Whitney test was used. n: OI+enbrel = 14–23, OI+H2O = 3–23. Survival was analyzed by Log-rank (Mantel-Cox) (***) and Gehan-Breslow-Wilcoxon (##) tests. n = 20 mice (equivalent to 100%). * p = 0.05; ** p = 0.01; *** p = 0.001.

Similar articles

Cited by

References

    1. Coura JR, Vinas PA (2010) Chagas disease: a new worldwide challenge. Nature 465: S6–7. 10.1038/nature09221 - DOI - PubMed
    1. Gascon J, Bern C, Pinazo MJ (2010) Chagas disease in Spain, the United States and other non-endemic countries. Acta Trop 115: 22–27. 10.1016/j.actatropica.2009.07.019 - DOI - PubMed
    1. Schmunis GA, Yadon ZE (2010) Chagas disease: a Latin American health problem becoming a world health problem. Acta Trop 115: 14–21. 10.1016/j.actatropica.2009.11.003 - DOI - PubMed
    1. da Silva NN, Clausell DT, Nolibos H, de Mello AL, Ossanai J, et al. (1968) [Epidemic outbreak of Chagas disease probably due to oral contamination]. Rev Inst Med Trop Sao Paulo 10: 265–276. - PubMed
    1. Toso MA, Vial UF, Galanti N (2011) [Oral transmission of Chagas' disease]. Rev Med Chil 139: 258–266. doi: /S0034-98872011000200017 - PubMed

Publication types