. 2015 Jun 19;10(6):e0130084.
doi: 10.1371/journal.pone.0130084. eCollection 2015.

Baseline Assessment of Mesophotic Reefs of the Vitória-Trindade Seamount Chain Based on Water Quality, Microbial Diversity, Benthic Cover and Fish Biomass Data

Affiliations

Baseline Assessment of Mesophotic Reefs of the Vitória-Trindade Seamount Chain Based on Water Quality, Microbial Diversity, Benthic Cover and Fish Biomass Data

Pedro M Meirelles et al. PLoS One. .

Abstract

Seamounts are considered important sources of biodiversity and minerals. However, their biodiversity and health status are not well understood; therefore, potential conservation problems are unknown. The mesophotic reefs of the Vitória-Trindade Seamount Chain (VTC) were investigated via benthic community and fish surveys, metagenomic and water chemistry analyses, and water microbial abundance estimations. The VTC is a mosaic of reef systems and includes fleshy algae dominated rhodolith beds, crustose coralline algae (CCA) reefs, and turf algae dominated rocky reefs of varying health levels. Macro-carnivores and larger fish presented higher biomass at the CCA reefs (4.4 kg per frame) than in the rhodolith beds and rocky reefs (0.0 to 0.1 kg per frame). A larger number of metagenomic sequences identified as primary producers (e.g., Chlorophyta and Streptophyta) were found at the CCA reefs. However, the rocky reefs contained more diseased corals (>90%) than the CCA reefs (~40%) and rhodolith beds (~10%). Metagenomic analyses indicated a heterotrophic and fast-growing microbiome in rocky reef corals that may possibly lead to unhealthy conditions possibly enhanced by environmental features (e.g. light stress and high loads of labile dissolved organic carbon). VTC mounts represent important hotspots of biodiversity that deserve further conservation actions.


Conflict of interest statement

Competing Interests: The authors have declared that no competing interests exist.

Figures

Fig 1
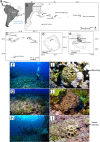
Fig 1. Study area.
Data on benthic fish, microbes and nutrients were collected for the Vitoria-Trindade Chain and Trindade Island. Detailed information on the samples and sites can be found in Table 1. (a) Main currents and location of VTC along the Brazilian coast; (b) sampling sites location along the VTC; (c) details of Vitoria, Eclaireur, Jaseur, Columbia Bank and Almirante Saldanha seamounts; (d) details of Davis Seamount sampling site; (e) details of Trindade Island sampling sites; (f) Davis Seamount (CCA reef, Group 1); (g) Jaseur Seamount (fleshy algae dominated rhodolith beds, Group 2); (h) Trindade Island (turf algae dominated rocky reef, Group 3); corals from (i) CCA reef, (j) rhodolith bed and (l) rocky reef. The maps were generated using Qgis software [68]. Photo credit: Ronaldo Francini-Filho.
Fig 2
Fig 2. Relative abundance of the major benthic categories for each sampled system.
Data presented as the mean±SE.
Fig 3
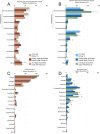
Fig 3. Relative abundance of fish size classes (a) and trophic guilds (b) and biomass of fish size classes (c) and trophic guilds (d).
Data are presented as the mean±SE.
Fig 4
Fig 4. Principal component analysis of water chemical and biological inventories.
Abbreviations: Bac Counts–Bacterial counts; DOC–Dissolved Organic Carbon, Org N–Organic Nitrogen, Ortho P–Orthophosphate, Org P–Organic Phosphorous, Richness–Number of bacterial families, Shannon–Shannon entropy index, Evenness–Shannon evenness index (Hill’s Ratio).
Fig 5
Fig 5. Taxonomic diversity of the metagenomes.
Bacterial and proteobacterial phyla relative abundance in corals (a) and water (b). Eukaryotic phyla relative abundance in corals (c) and water (d). Asterisks show significant differences between the different macro-habitats (groups). Data are presented as the mean±SE.
Fig 6
Fig 6. Functional diversity of the metagenomes.
Relative abundance of the most frequent SEED Level 1 subsystems in coral (a) and water (b) samples. Relative abundance of the less abundant SEED Level 1 subsystems (“Others” category in plots a and b) in coral (c) and water (d) samples. Data are presented as the mean±SE.
Fig 7
Fig 7. Nonmetric multidimensional scaling of dinucleotide signatures of water (a) and coral (b) metagenomes.
There was no clear distinction between the samples, indicating that there is a genetic connectivity between the reef environments.
Fig 8
Fig 8. Hypothetical schematic representation of VTC macro-habitats and processes.
CCA reefs (Group 1), fleshy algae dominated rhodolith beds (Group 2) and turf algae dominated rocky reefs (Group 3) are represented. In pink, CCA reefs and fleshy algae (dark green) dominated rhodolith beds. In light green, high turf algae cover at rocky reefs. The highly complex habitat of CCA reefs harbors high biomass of carnivorous fishes. Input of nutrients and upwelling/downwelling generating microbial productivity. During downwelling periods, regenerated and/or excreted nutrients (e.g., ammonia and phosphorus) may be provided to the system by the benthic organisms/microorganisms. At Group 3 Euphotic reefs microbial growth stimulated by DOC released by turf algae may have toxic effects and cause coral disease. At Group 1 and 2 mesophotic environments probably fleshly algae is the major DOC producer, having no toxic effects on coral health. During upwelling periods, new nutrients (nitrate) from deeper water masses may become available to the systems. Microbial communities are connected between the seamounts (Karlin signature). Not to scale. Grouper and black durgon pictures from www.fishbase.org [29].

References

    1. Wessel P, Sandwell DT, Kim S-S. The global seamount census. Oceanography. 2010;23(1):24–33. 10.5670/oceanog.2010.60 - DOI
    1. Etnoyer PJ, Wood J, Shirley TC. BOX 12-How large is the seamount biome? Oceanography. 2010;23(1):206.
    1. Shank TM. Seamounts: deep-ocean laboratories of faunal connectivity, evolution, and endemism. Oceanography. 2010;23(1):108–22. 10.5670/oceanog.2010.65 - DOI
    1. Slattery M, Lesser MP, Brazeau D, Stokes MD, Leichter JJ. Connectivity and stability of mesophotic coral reefs. Journal of Experimental Marine Biology and Ecology. 2011;408(1‚Äì2):32–41. 10.1016/j.jembe.2011.07.024 - DOI
    1. Lesser MP, Slattery M, Leichter JJ. Ecology of mesophotic coral reefs. Journal of Experimental Marine Biology and Ecology. 2009;375(1–2):1–8. 10.1016/j.jembe.2009.05.009 - DOI

Publication types

LinkOut - more resources