

A Comparison of Methods for Analyzing Viral Load Data in Studies of HIV Patients
- PMID: 26090989
- PMCID: PMC4474923
- DOI: 10.1371/journal.pone.0130090
A Comparison of Methods for Analyzing Viral Load Data in Studies of HIV Patients
Abstract
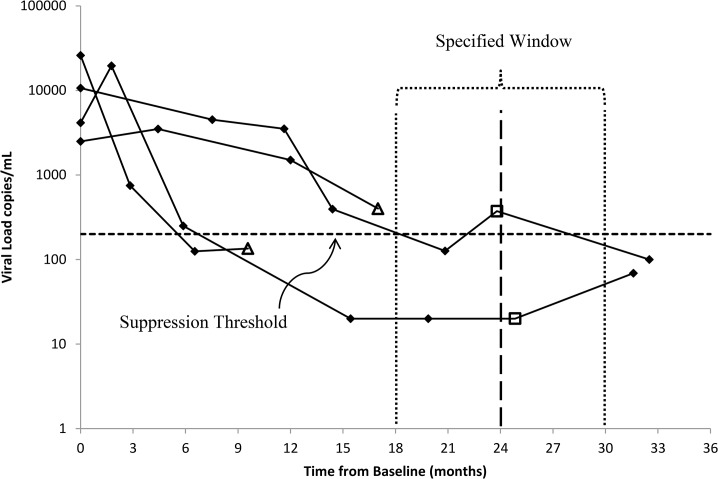
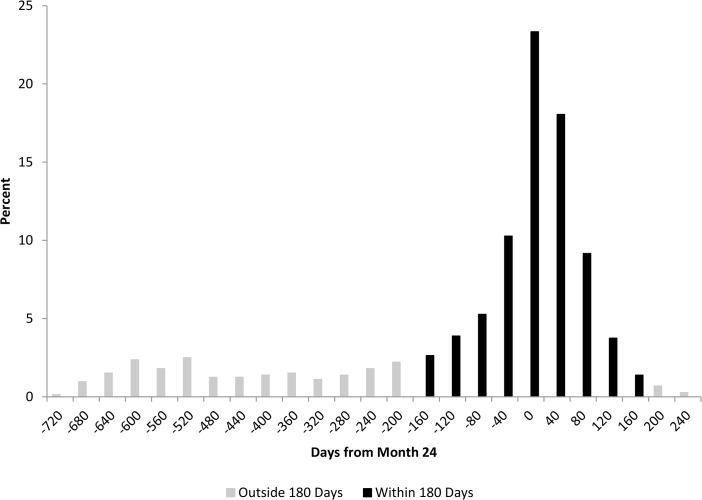
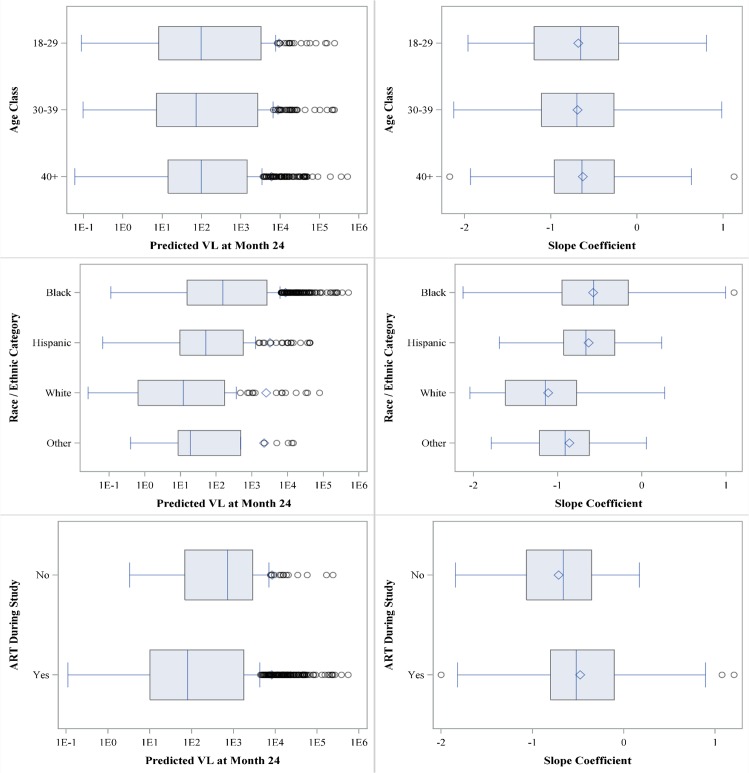
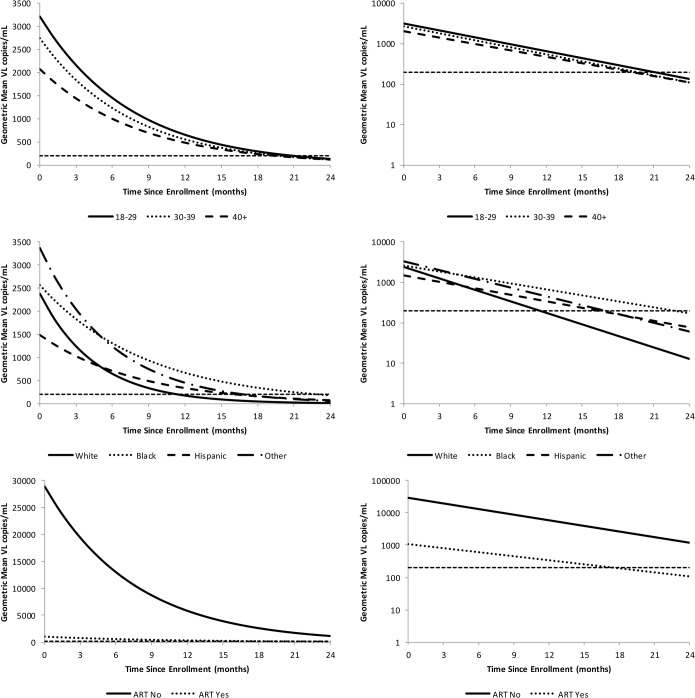
HIV RNA viral load (VL) is a pivotal outcome variable in studies of HIV infected persons. We propose and investigate two frameworks for analyzing VL: (1) a single-measure VL (SMVL) per participant and (2) repeated measures of VL (RMVL) per participant. We compared these frameworks using a cohort of 720 HIV patients in care (4,679 post-enrollment VL measurements). The SMVL framework analyzes a single VL per participant, generally captured within a "window" of time. We analyzed three SMVL methods where the VL binary outcome is defined as suppressed or not suppressed. The omit-participant method uses a 8-month "window" (-6/+2 months) around month 24 to select the participant's VL closest to month 24 and removes participants from the analysis without a VL in the "window". The set-to-failure method expands on the omit-participant method by including participants without a VL within the "window" and analyzes them as not suppressed. The closest-VL method analyzes each participant's VL measurement closest to month 24. We investigated two RMVL methods: (1) repeat-binary classifies each VL measurement as suppressed or not suppressed and estimates the proportion of participants suppressed at month 24, and (2) repeat-continuous analyzes VL as a continuous variable to estimate the change in VL across time, and geometric mean (GM) VL and proportion of participants virally suppressed at month 24. Results indicated the RMVL methods have more precision than the SMVL methods, as evidenced by narrower confidence intervals for estimates of proportion suppressed and risk ratios (RR) comparing demographic strata. The repeat-continuous method had the most precision and provides more information than other considered methods. We generally recommend using the RMVL framework when there are repeated VL measurements per participant because it utilizes all available VL data, provides additional information, has more statistical power, and avoids the subjectivity of defining a "window."
Conflict of interest statement
Figures
References
-
- Clumeck N, Molina JM, Henry K, Gathe J, Rockstroh JK, DeJesus E, et al. A randomized double-blind comparison of single-tablet regimen elvitegravir/cobicistat/emtricitabine/tenofovir DF vs ritonovir-boosted atazanavir plus emtricitabine/tenofovir DF for initial treatment of HIV-1 infection: analysis of week 144 results. J Acquir Immune Defic Syndr. 2013;65: e121–e124. - PubMed
-
- Zolopa A, Sax PE, DeJesus E, Mills A, Cohen C, Wohl D, et al. A randomized double–blind comparison of coformulated elvitegravir/cobicistat/emtricitabine/tenofovir disoproxil fumarate versus efavirenz/emtricotabine/tenofovir disoproxil fumarate for initial treatment of HIV-1 Infection: analysis of week 96 results. J Acquir Immune Defic Syndr. 2013;63(1): 96–100. 10.1097/QAI.0b013e318289545c - DOI - PubMed
Publication types
MeSH terms
Substances
Grants and funding
LinkOut - more resources
Full Text Sources
Other Literature Sources
Medical
