. 2015 Jun 18;161(7):1644-55.
doi: 10.1016/j.cell.2015.05.041.

Embryonic Origin of Postnatal Neural Stem Cells

Affiliations

Embryonic Origin of Postnatal Neural Stem Cells

Luis C Fuentealba et al. Cell. .

Abstract

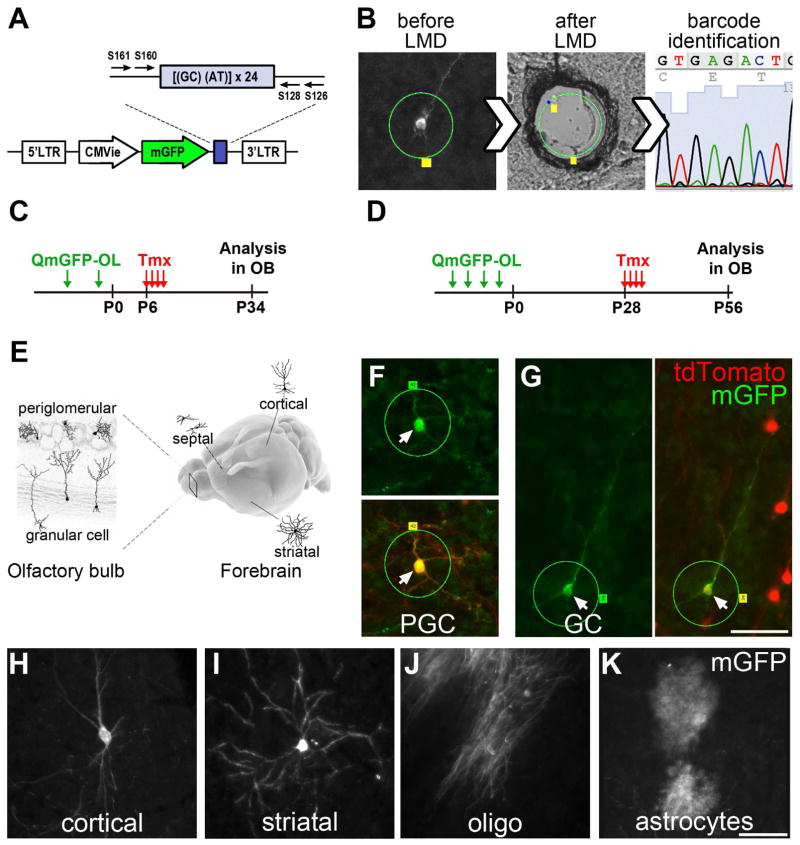
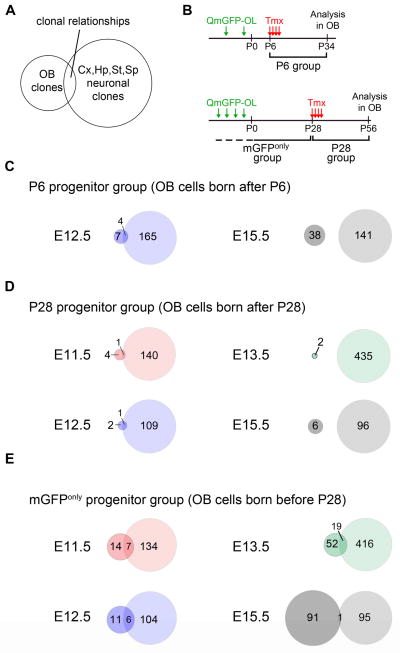
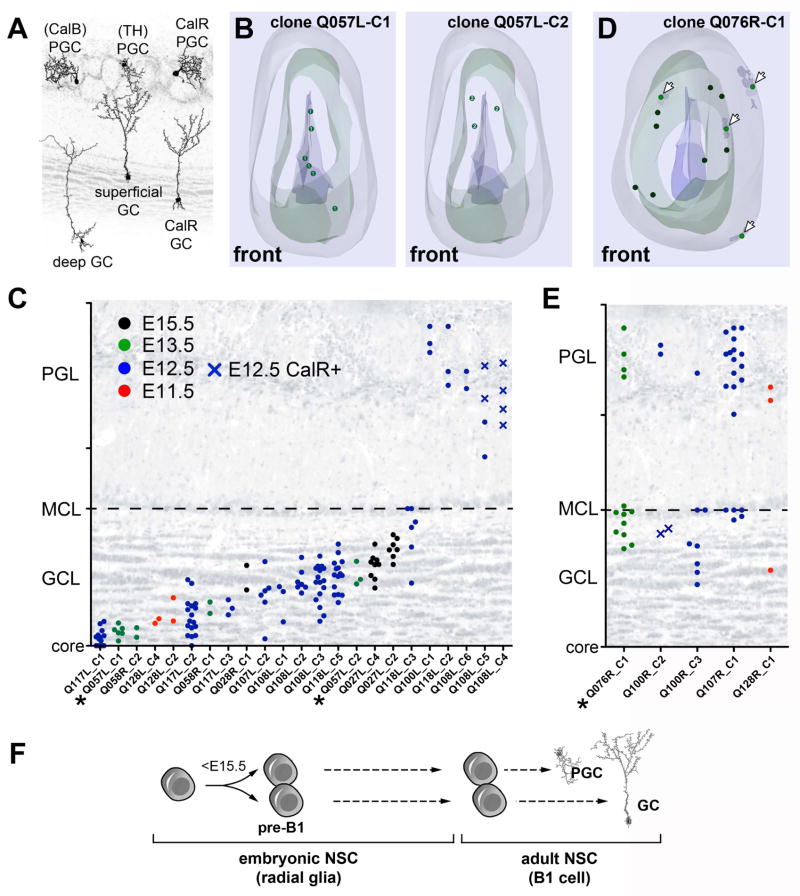
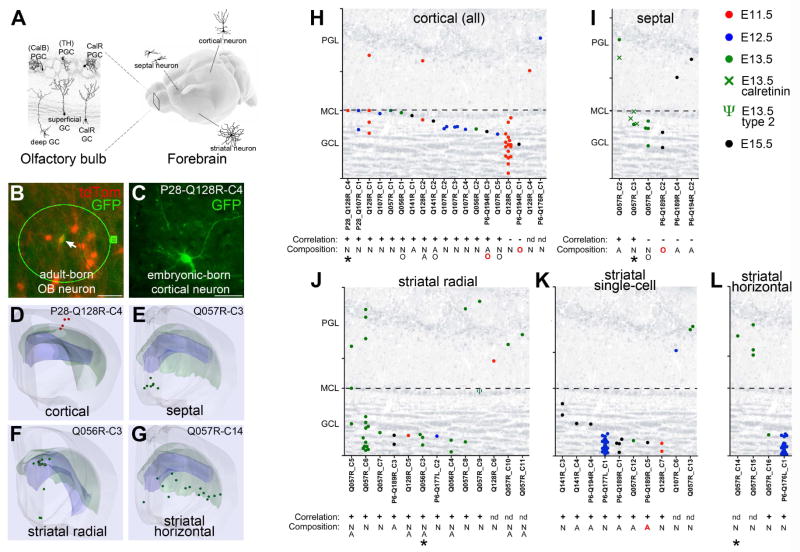
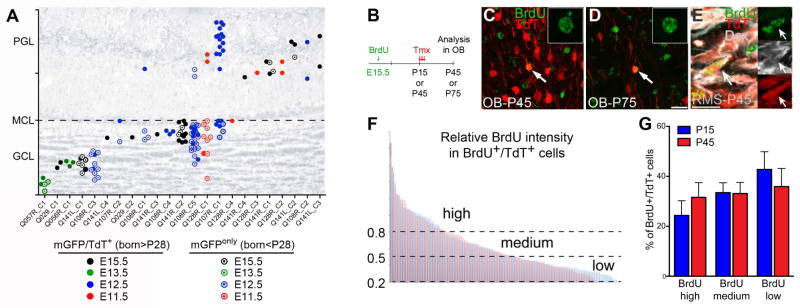
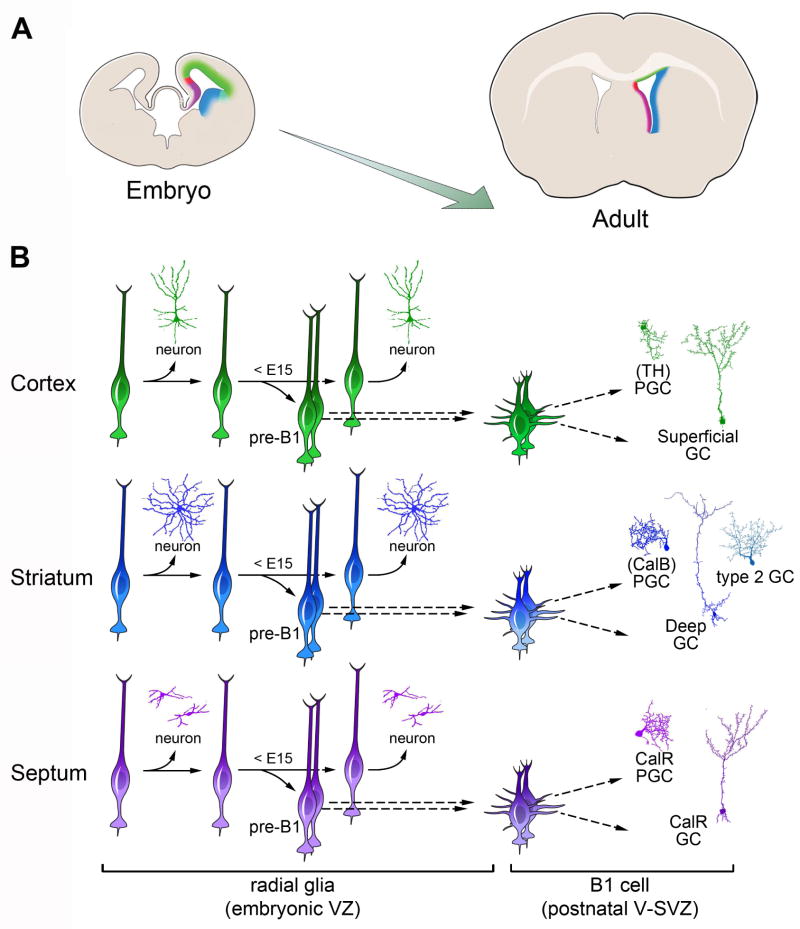
Adult neural stem/progenitor (B1) cells within the walls of the lateral ventricles generate different types of neurons for the olfactory bulb (OB). The location of B1 cells determines the types of OB neurons they generate. Here we show that the majority of mouse B1 cell precursors are produced between embryonic days (E) 13.5 and 15.5 and remain largely quiescent until they become reactivated postnatally. Using a retroviral library carrying over 100,000 genetic tags, we found that B1 cells share a common progenitor with embryonic cells of the cortex, striatum, and septum, but this lineage relationship is lost before E15.5. The regional specification of B1 cells is evident as early as E11.5 and is spatially linked to the production of neurons that populate different areas of the forebrain. This study reveals an early embryonic regional specification of postnatal neural stem cells and the lineage relationship between them and embryonic progenitor cells.


Figures

Figure 1
Figure 1. The majority of pre-B1 cells are derived at E13.5–E15.5
A) Timed-pregnant hGFAP::GFP female mice received two injections of BrdU at E12.5, E14.5, E16.5, or combined E17.5/E18.5, and whole-mounts of the V-SVZ in the offspring were analyzed 21d after birth. B) The number of GFP+/BrdU+ cells was significantly higher in mice injected at E14.5 compared to other ages. Many of the ependymal cells were also BrdU-labeled at E14.5, as previously shown (Spassky et al., 2005). C) Quantification of V-SVZ GFP+/BrdU+ cells from animals injected at different timepoints. Data are expressed as mean ± s.e.m., n=6/stage, three independent experiments each (*** p<0.0001). D) NIT-GFP retroviruses were intraventricularly delivered into CD1 embryos at E12.5, E13.5, E15.5, E17.5 or P0. Injected animals received BrdU for one week at P28 and their OB were analyzed 3 weeks later. E) The majority of GFP+/BrdU+ OB neurons were derived from retroviral injections at E15.5. F) Quantification of GFP+/BrdU+ cells in the OB of animals injected at different stages. Data are expressed as mean ± s.e.m., n=12 (E12.5), n=6 (E13.5), n=16 (E15.5), n=11 (E17.5), n=4 (P0), three independent experiments each stage (*** p<0.0001). Scale bars represent 50 μm in B and E. See also Figure S1.
Figure 2
Figure 2. Lineage tracing of individual embryonic progenitors with QmGFP-OL
A) The QmGFP-OL retroviral library: Each retrovirus expresses mGFP and contains a unique 24 bp sequence. B) M-GFP+ cell tagged for laser microdissection (LMD, green circle), laser-cut and captured, followed by barcode identification. C) QmGFP-OL retroviruses were injected intraventricularly into Nestin::CreER;Ai14 embryos (at E12.5 or E15.5); 6 days after birth, injected mice received Tmx for 4–5d; neurons that were mGFP+/TdT+ in OB and mGFP+ Cx, Hp, St and Sp cells were laser-captured at P34. D) QmGFP-OL retroviruses were injected into Nestin::CreER;Ai14 embryos (at E11.5, E12.5, E13.5 or E15.5); 28 days after birth, injected mice received Tmx; mGFP+/TdT+ OB neurons and mGFP+ Cx, Hp, St and Sp cells were laser-captured at P56. E) Schematics showing regions analyzed and examples of dissected cells in the OB and in Cx, Hp, St and Sp. F–G) Examples of mGFP+/TdT+ PGC (F) and GC (G) before LMD. H–K). Examples of mGFP+ cells found in the telencephalon: neurons (H, cortex; I, striatum), oligodendrocyte (J, cortex) and an astrocyte (K, cortex). Scale bars represent 50 μm in G and K. See also Figure S2A–G.
Figure 3
Figure 3. Clonal relationships between postnatal OB interneurons and Cx, Hp, St and Sp neurons
A) Venn diagrams throughout this figure represent clonal relationships between OB and neurons found in the Cx, Hp, St or Sp (number of clones indicated in the center of each circle). The intersection shows the number of clones that contains both OB and Cx, Hp, St or Sp neurons. For the total number of amplified vs. microdissected cells including all OB and all Cx, Hp, St, Sp cells, see Table S1. B–E) Three experimental groups were analyzed: P6- (n=5, Venn diagrams in C), P28- (n=6, in D) and mGFPonly- (n=6, in E) progenitor groups. See also Table S2.
Figure 4
Figure 4. Adult NSCs become specified before E15.5
A) Main OB interneuron subtypes and their relative layer-specific positions. PGCs are classified by the expression of CalR, TH, and CalB. GCs are classified as deep, intermediate, or superficial, plus CalR expressing. B) Neurolucida® 3D reconstruction of an OB (Q057L) with two P28-generated mGFP+/TdT+ clones: one containing deep GCs (clone Q057L-C1 (circles in left panel) and one containing intermediate GCs (clone Q057L-C2 (circles in right panel). Note that clones are dispersed rostro-caudally, but occupy specific positions in the GC layer (see Movie S1). The OB surface (gray), mitral cell layer (green) and the OB core (blue) are shown. C) The relative OB distances of individual mGFP+/TdT+ cells within clones show that the majority of P28-generated clones contained either one subtype of GC or PGC (39 of 44 multi-cell (≥2) clones; 23 are shown (remaining clones are plotted in Figure 6). D) Neurolucida® 3D reconstruction of one P28-generated clone containing both superficial GCs and PGCs (clone Q076L-C1). Arrows denote PGCs. E) Relative OB distances of individual cells in mixed GC/PGC clones generated at P28 (5 of 44 multi-cell (≥2) clones); these clones contained one GC subtype (superficial or intermediate) and PGCs. Clones containing deep and superficial GCs were not encountered in any of our embryonic injections. F) Pre-B1 cells are specified for the production of GCs or PGCs subtypes during early embryonic development before E15.5 (see text). Closed circles and crosses denote CalR negative and positive cells, respectively. Asterisks mark Neurolucida® reconstructed clones in C and E. GCL: granule cell layer, MCL: mitral cell layer, PGL: periglomerular cell layer. See also Figure S2H–J and Table S3.
Figure 5
Figure 5. Different types of OB interneurons are lineage related to specific subtypes of forebrain neurons in a region-specific manner
A) We investigated the location and types of cells in Cx, St, Sp that were clonally related to the different subtypes of OB neurons. B–C) Example of a clone (P28-Q128R-C4) containing a mGFP+/TdT+ superficial GC (arrow in B) and a GFP+ neuron found in cortex (C). D–G) Neurolucida® 3D reconstructions of a radial clone in cortex (red symbols from E11.5 retroviral injection; P28-Q128R-C4 in D)), septum (green symbols from E13.5 retroviral injection; Q057-C3 in E), and striatum (green symbols from E13.5 retroviral injection; F and G). Striatal clones can be further distinguished as radial (Q056R-C3 in F) and horizontal (Q057R-C14 in G). Neurons (·), astrocytes (□), and ependymal cells (◆) are shown. The forebrain surface (gray), lateral ventricle (blue), and the corpus callosum (green) are shown. H–L) Relative OB positions of individual cells in the OB were grouped and classified according to their clonal relationships to cortical (H), septal (I), or radial (J), single-cell (K), or horizontal (L) striatal clones. Closed circles and crosses denote CalR negative and positive cells, respectively. ψ denotes a type-2 cell in Q057R-C9 (in J). The expected correlation based on the previous mapping of the postnatal V-SVZ (Merkle et al., 2007; Merkle et al., 2014) is indicated by a + or −. “n.d.” indicates that cell subtype was “not determined” due to technical limitations (see Methods), but these cells were CalR-negative as expected. Asterisks in H, I, J, and L mark Neurolucida® reconstructed clones in D, E, F, and G, respectively. For additional examples, see Figure S3. Scale bars represent 25 and 50 μm in B and C, respectively. See also Figure S4.
Figure 6
Figure 6. Pre-B1 cells remain quiescent until their reactivation in the postnatal brain
A) Relative OB positions of mGFP+/TdT+ (filled circles, born after P28) and mGFPonly (open circles, born before P28) cells within clones (experiment in Figure 3 D–E). Eleven out of 23 mGFP+/TdT+ OB clones were clonally related to mGFPonly OB neurons and of these 4 were mixed suggesting an origin in the embryo (see also Table S4). B) E15.5 pregnant Nestin::CreER;Ai14 females were BrdU injected; littermates received Tmx at either P15 or P45 and their OBs were analyzed 28d later. C–E) Independent of the time of Tmx administration, brightly labeled BrdU+ nuclei were detected in TdT+ OB neurons (C, D) and TdT+/DCX+ neuroblasts in the RMS (E), indicating limited BrdU dilution. F) Distribution of the relative BrdU intensities in BrdU+/TdT+ OB neurons from both age groups (blue: Tmx P15, n=132 cells; red: Tmx P45, n=126 cells. 7 mice/group, three independent experiments). (G) Percentages of TdT+ OB neurons with high, medium or low BrdU intensities in P15 (blue) or P45 (red) Tmx-treated mice. Data are expressed as mean ± s.e.m., n=7 mice/group, three independent experiments each (n.s.). GCL: granule cell layer, MCL: mitral cell layer, PGL: periglomerular cell layer. See also Table S4.
Figure 7
Figure 7. Embryonic origin of postnatal NSCs
A) Left: Coronal section of the embryonic (E12.5) mouse brain illustrating regional organization of cortical (green), striatal/LGE (blue), and septal (purple) VZ progenitor cells. Right: These progenitor domains are retained in the postnatal brain (dorsal (green), ventral (blue), and medial (purple)), and contain NSCs that generate specific subtypes of interneurons that migrate to the OB. B) Individual lineages illustrating the progression from embryonic to adult NSCs. Postnatal NSCs arise from region-specific pre-B1 cells that progressively diverge from other embryonic progenitors that produce specific sets of neurons in cortex (green), striatum (blue), and septum (purple). Later in life, these same regions harbor dorsal (green), ventral (blue), and medial (purple) V-SVZ B1 cells that produce superficial GCs, intermediate/deep GCs, and CalR+ GCs and PGCs, respectively. Pre-B1 cells become restricted for the production of specific subtypes of GCs or PGCs as early as E11.5 and before E15.5.

Comment in

References

    1. Alvarez-Buylla A, García-Verdugo JM, Tramontin AD. A unified hypothesis on the lineage of neural stem cells. Nat Rev Neurosci. 2001;2:287–293. - PubMed
    1. Alvarez-Buylla A, Kohwi M, Nguyen TM, Merkle FT. The heterogeneity of adult neural stem cells and the emerging complexity of their niche. Cold Spring Harb Symp Quant Biol. 2008;73:357–365. - PubMed
    1. Batista-Brito R, Close J, Machold R, Fishell G. The distinct temporal origins of olfactory bulb interneuron subtypes. J Neurosci. 2008;28:3966–3975. - PMC - PubMed
    1. Bayer SA. 3H-thymidine-radiographic studies of neurogenesis in the rat olfactory bulb. Exp Brain Res. 1983;50:329–340. - PubMed
    1. Benitah SA, Frye M. Stem cells in ectodermal development. J Mol Med (Berl) 2012;90:783–790. - PMC - PubMed

Publication types