. 2015 Dec;11(12):1489-1499.
doi: 10.1016/j.jalz.2015.01.010. Epub 2015 Jun 18.

Imaging-based enrichment criteria using deep learning algorithms for efficient clinical trials in mild cognitive impairment

Affiliations

Imaging-based enrichment criteria using deep learning algorithms for efficient clinical trials in mild cognitive impairment

Vamsi K Ithapu et al. Alzheimers Dement. 2015 Dec.

Abstract

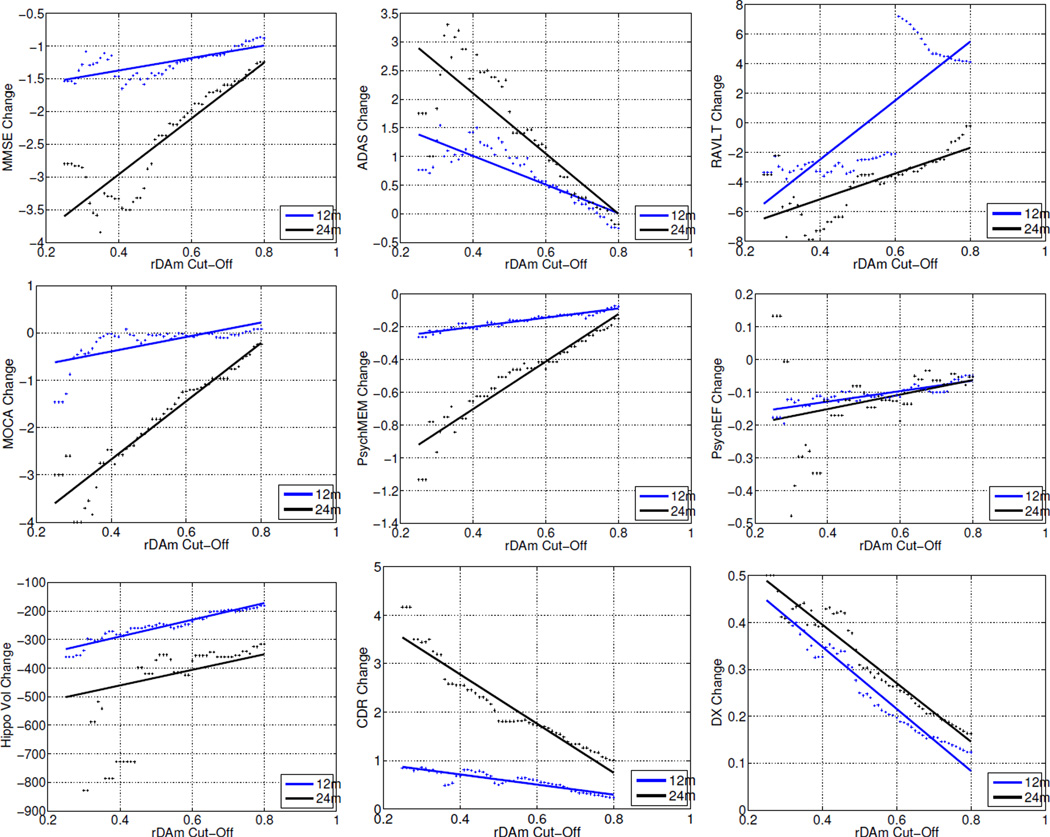
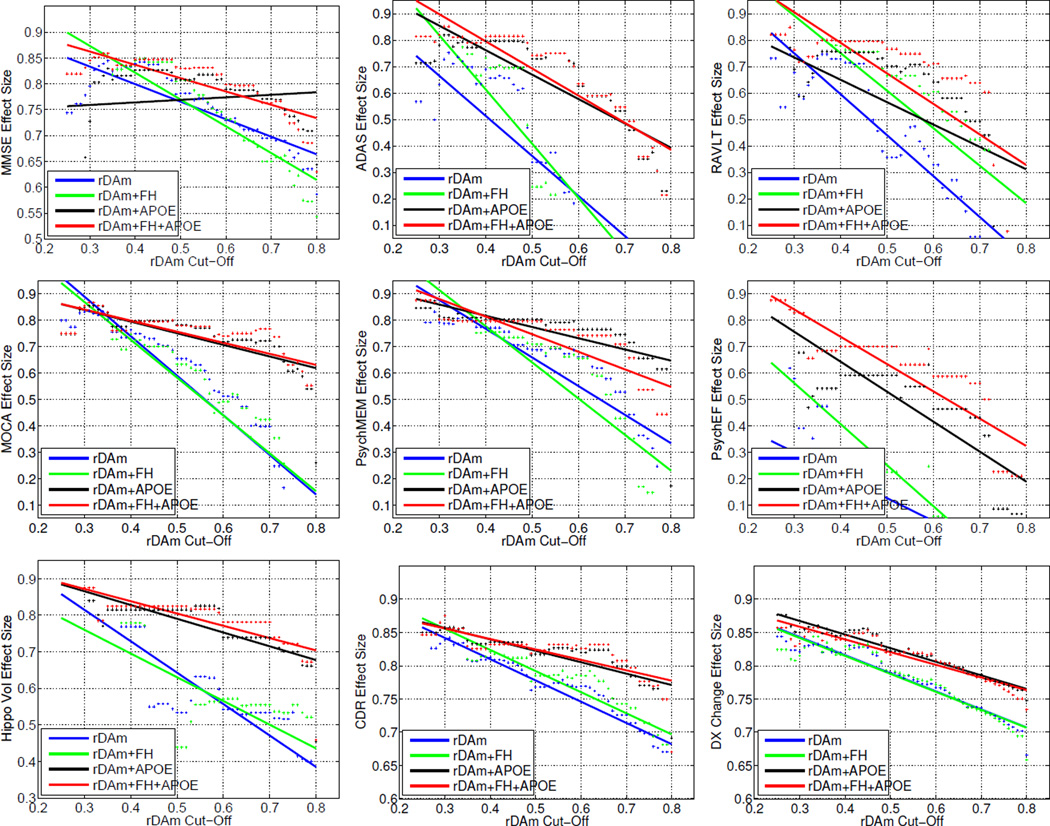
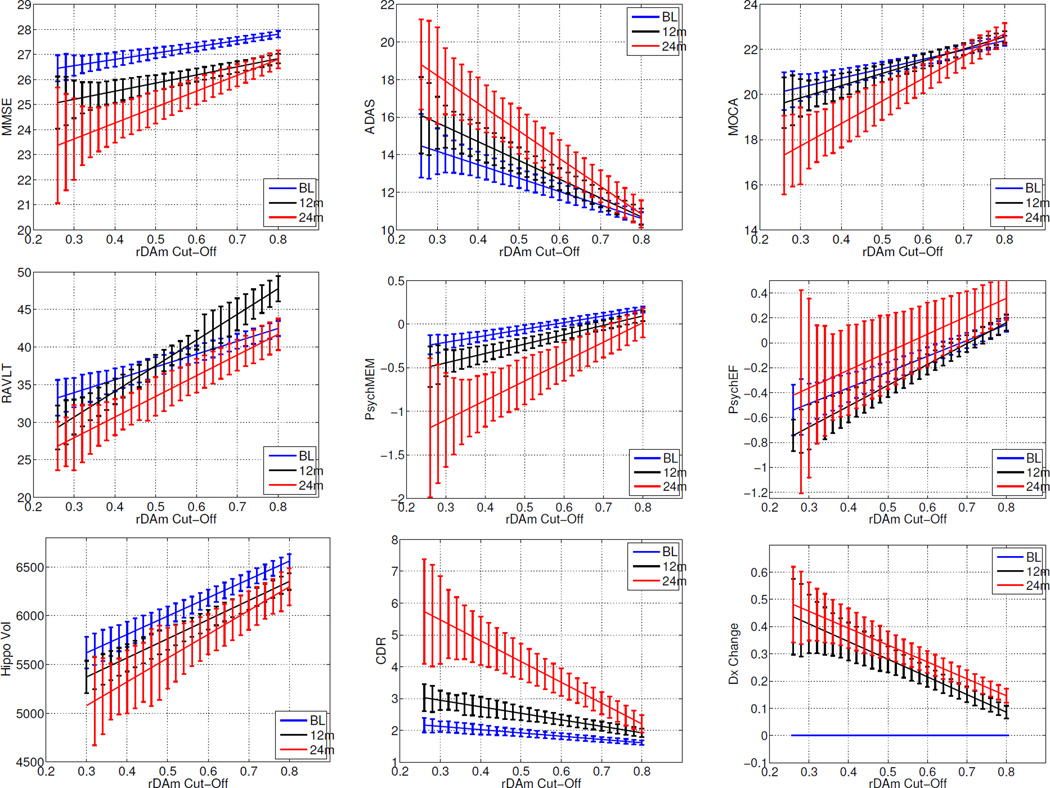
The mild cognitive impairment (MCI) stage of Alzheimer's disease (AD) may be optimal for clinical trials to test potential treatments for preventing or delaying decline to dementia. However, MCI is heterogeneous in that not all cases progress to dementia within the time frame of a trial and some may not have underlying AD pathology. Identifying those MCIs who are most likely to decline during a trial and thus most likely to benefit from treatment will improve trial efficiency and power to detect treatment effects. To this end, using multimodal, imaging-derived, inclusion criteria may be especially beneficial. Here, we present a novel multimodal imaging marker that predicts future cognitive and neural decline from [F-18]fluorodeoxyglucose positron emission tomography (PET), amyloid florbetapir PET, and structural magnetic resonance imaging, based on a new deep learning algorithm (randomized denoising autoencoder marker, rDAm). Using ADNI2 MCI data, we show that using rDAm as a trial enrichment criterion reduces the required sample estimates by at least five times compared with the no-enrichment regime and leads to smaller trials with high statistical power, compared with existing methods.

Keywords: Alzheimer's disease; Clinical trials; Deep learning; Sample enrichment.


Figures

Figure 1
Figure 1
Mean longitudinal change of several disease markers as a function of baseline rDAm enrichment threshold. Each plot corresponds to one disease marker (which include MMSE, ADAS, RAVLT, MOCA, PsychMEM, PsychEF, Hippocampal Volume, CDR-SB and DxConv, refer to Section 3.1 for details about these markers). x-axis represents the baseline rDAm enrichment cut-off (t). For each t, the subjects who have baseline rDAm ≫ t are filtered-out, and the mean of within subject change in the disease marker is computed on the remaining un-filtered subjects. Dots represent actual values, and lines are the corresponding linear fit. Blue and black represent changes from baseline to 12 and 24 months respectively.
Figure 2
Figure 2
Detectable drug effect η as a function of baseline rDAm enrichment cut-off. Recall that η is the hypothesized induced treatment effect where (1−η) denotes the expected percentage of reduction in the outcome measure. Each plot corresponds to using one of the nine disease markers (MMSE, ADAS, RAVLT, MOCA, PsychMEM, PsychEF, Hippocampal Volume, CDR-SB and DxConv, refer to Section 3.1 for details about these markers) as an outcome measure. x-axis represents the baseline rDAm enrichment cut-off (t). For each t, y-axis shows the effect size detectable at 80% power and significance level of 0.05 using 500 samples per arm. As with the results in Table 3, each plot also shows improvements when using FH and/or APOE information in tandem with baseline rDAm enrichment. Blue, green, black and red correspond to rDAm, rDAm + APOE, rDAm + FH and rDAm + APOE + FH enrichment respectively.
Figure 6
Figure 6
Mean of several disease markers as a function of baseline rDAm enrichment threshold. Each plot corresponds to one disease marker (which include MMSE, ADAS, RAVLT, MOCA, PsychMEM, PsychEF, Hippocampal Volume, CDR-SB and Dx Change. x-axis represents the baseline rDAm enrichment cut-off (t). For each t, the subjects who have baseline rDAm ≫ t are filtered-out, and the mean of within subject change in the diseas marker is computed on the remaining un-filtered subjects. Lines are the corresponding linear fit, and the error bars correspond to the stnadard errors. Blue, black and red represent baseline, 12 and 24 months respectively.

References

    1. Grill JD, D.L., Lu PH, Lee C, Ringman J, Apostolova LG, Chow N, Kohannim O, Cummings JL, Thompson PM, Elashoff D Alzheimer's Disease Neuroimaging Initiative. Estimating sample sizes for predementia Alzheimer's trials based on the Alzheimer's Disease Neuroimaging Initiative. Neurobiology of Aging. 2013;34(1):62–72. - PMC - PubMed
    1. Grill JD, M.S. Choosing Alzheimer's disease prevention clinical trial populations. Neurobiology of Aging. 2014;35(3):466–471. - PMC - PubMed
    1. Jelic V, Kivipelto M, Winblad B. Clinical trials in mild cognitive impairment: lessons for the future. Journal of Neurology, Neurosurgery & Psychiatry. 2006;77(4):429–438. - PMC - PubMed
    1. Petersen RC. Mild cognitive impairment: current research and clinical implications. Seminars in Neurology. 2007;27(1):22–31. - PubMed
    1. Aisen PS. Clinical trial methodologies for disease-modifying therapeutic approaches. Neurobiology of Aging. 2011;32(1):64–66. - PMC - PubMed

Publication types