. 2015 Jul 2;97(1):186-93.
doi: 10.1016/j.ajhg.2015.05.013. Epub 2015 Jun 18.

RNASEH1 Mutations Impair mtDNA Replication and Cause Adult-Onset Mitochondrial Encephalomyopathy

Affiliations

RNASEH1 Mutations Impair mtDNA Replication and Cause Adult-Onset Mitochondrial Encephalomyopathy

Aurelio Reyes et al. Am J Hum Genet. .

Abstract

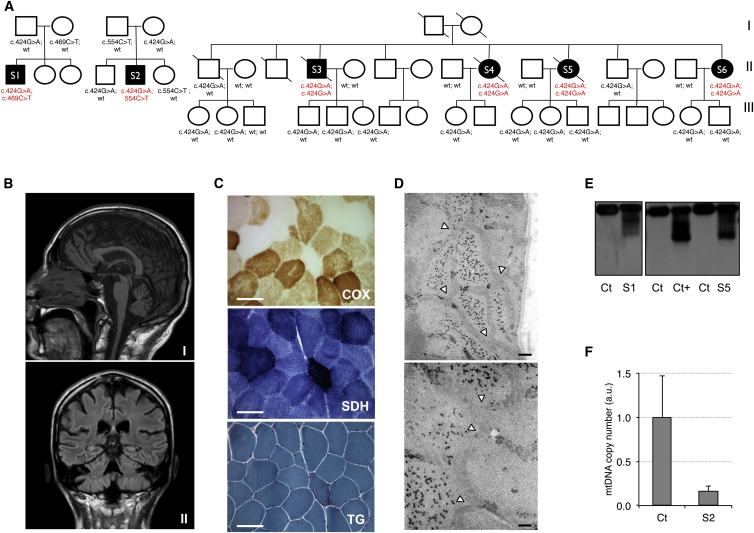
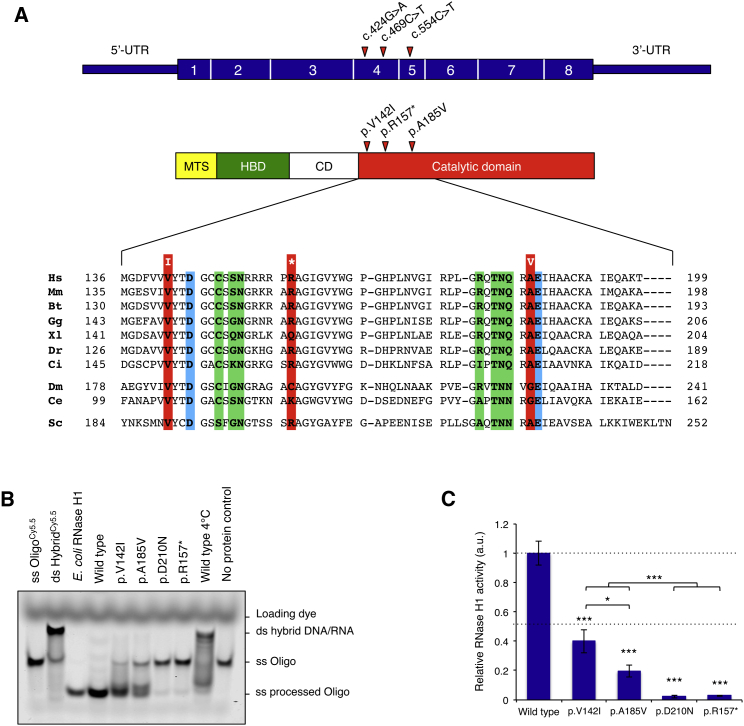
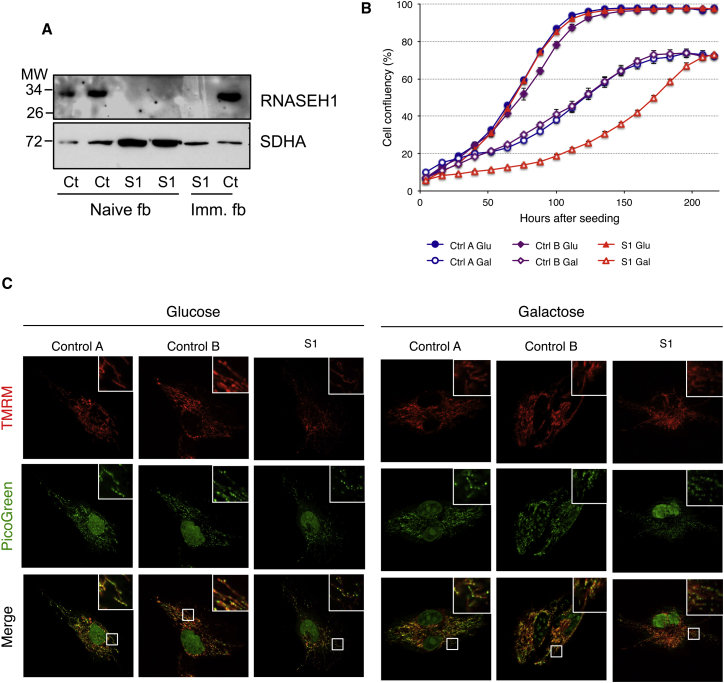
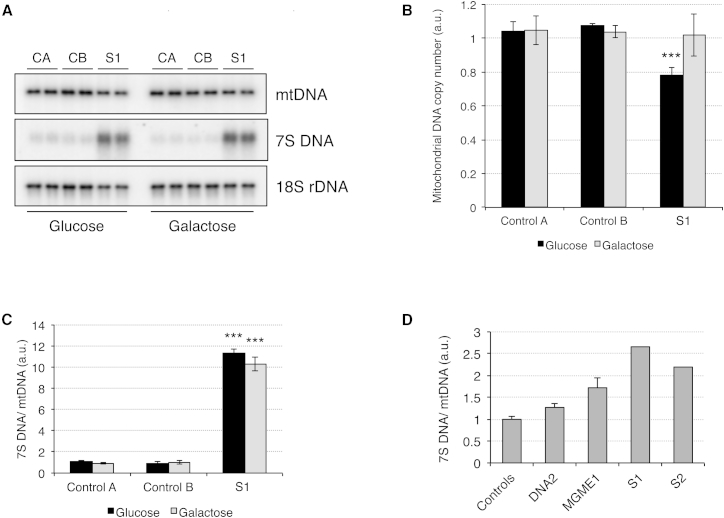
Chronic progressive external ophthalmoplegia (CPEO) is common in mitochondrial disorders and is frequently associated with multiple mtDNA deletions. The onset is typically in adulthood, and affected subjects can also present with general muscle weakness. The underlying genetic defects comprise autosomal-dominant or recessive mutations in several nuclear genes, most of which play a role in mtDNA replication. Next-generation sequencing led to the identification of compound-heterozygous RNASEH1 mutations in two singleton subjects and a homozygous mutation in four siblings. RNASEH1, encoding ribonuclease H1 (RNase H1), is an endonuclease that is present in both the nucleus and mitochondria and digests the RNA component of RNA-DNA hybrids. Unlike mitochondria, the nucleus harbors a second ribonuclease (RNase H2). All affected individuals first presented with CPEO and exercise intolerance in their twenties, and these were followed by muscle weakness, dysphagia, and spino-cerebellar signs with impaired gait coordination, dysmetria, and dysarthria. Ragged-red and cytochrome c oxidase (COX)-negative fibers, together with impaired activity of various mitochondrial respiratory chain complexes, were observed in muscle biopsies of affected subjects. Western blot analysis showed the virtual absence of RNase H1 in total lysate from mutant fibroblasts. By an in vitro assay, we demonstrated that altered RNase H1 has a reduced capability to remove the RNA from RNA-DNA hybrids, confirming their pathogenic role. Given that an increasing amount of evidence indicates the presence of RNA primers during mtDNA replication, this result might also explain the accumulation of mtDNA deletions and underscores the importance of RNase H1 for mtDNA maintenance.


Figures

Figure 1
Figure 1
Clinical, Morphological, and Genetic Features of Individuals with Mutations in RNASEH1 (A) Pedigrees of individuals with mutations in RNASEH1. Black symbols designate affected subjects, who are numbered according to the main text. The mutation status of each analyzed family member is indicated and is based on the NCBI RefSeq RNASEH1 transcript. (B) Brain MRI in S1. T1 sagittal (I) and cross (II) sections show cerebellar atrophy and mild bulbar atrophy in S1. (C) Histological findings in muscle biopsy from S2. Abbreviations are as follows: COX, cytochrome c oxidase; SDH, succinate dehydrogenase; Gomori Trichrome, GT. GT staining shows one ragged-red COX-negative and SDH-positive fiber and several COX-negative fibers. Scale bars represent 25μm. (D) Electron microscopy with a seamless mitochondrial network intermingled among myofibrils in a muscle biopsy from S2. Arrowheads indicate ramification of the mitochondrial syncytium. Scale bars represent 0.25 μm in the upper panel and 0.10 μm in the lower panel. (E) Southern blot analysis of mtDNA obtained from muscle biopsies of affected individuals S1 and S5, of control subjects (Ct), and of an individual with POLG1 mutations (Ct+). (F) mtDNA levels assessed by qPCR in myoblasts from S2 and three control subjects (Ct). The mean value of the mtDNA/nDNA ratio obtained in control subjects was set as 1. Error bars represent SDs.
Figure 2
Figure 2
Characterization of the Structure and Enzymatic Activity of RNaseH1 Variants (A) Human RNaseH1 (top) consists of four domains: a mitochondrial targeting sequence (MTS) that directs the protein to mitochondria and is cleaved after import, a hybrid binding domain (HBD) involved in recognition of DNA-RNA heteroduplexes, a catalytic domain responsible for the cleavage of the RNA component in the heteroduplex, and a flexible connection domain (CD) that links the last two domains. Phylogenetic alignment of the human protein region containing the substitutions found in affected individuals is shown below. Conserved residues that are altered in affected subjects are boxed in red and are found near conserved residues in the active site or interacting with DNA or RNA in the heteroduplex; these latter residues are boxed in blue or green, respectively. Abbreviations are as follows: Hs, H. sapiens; Mm, M. musculus; Bt, B. taurus; Gg, G. gallus; Xl, X. laevis; Dr, D. rerio; Ci, C. intestinalis; Dm, D. melanogaster; Ce, C. elegans; Sc, S. cerevisiae. (B) RNase H1 activity of recombinant proteins. The portion corresponding to the mature protein, lacking the mitochondrial targeting signal (MTS), was cloned into a pET-28a bacterial expression vector (Novagen) containing an N-terminal His6 tag. Protein production was carried out in BL21(DE3)pLysS E. coli cells at 37°C in lysogeny broth medium. Proteins were loaded onto a Ni-NTA agarose column and eluted with 400 mM imidazole. 80 nmol of DNA-RNA heteroduplex oligonucleodies were incubated with E. coli RNase H1 or either wild-type or altered recombinant proteins for 1 hr. Reaction products were loaded onto 15% polyacrylamide gels, and gel imaging and quantification followed. (C) Relative RNase H1 activity was obtained by quantification of the amount of processed oligonucleotide normalized by protein loading (based on western blotting; Figure S1C) and relative to wild-type protein. p < 0.05, ∗∗∗p < 0.001 (two-tailed unpaired Student’s t test). n = 3 experiments. Error bars represent 1 SD.
Figure 3
Figure 3
Growth and Mitochondrial Alterations in RNASEH1 Mutant Fibroblasts (A) Western blot analysis, using antibodies against RNASEH1 (Abcam) and SDHA (Mitosciences-Invitrogen), of fibroblasts (fb) from S1 and control subjects (Ct); SDHA was taken as a loading control. Both naive and immortalized (Imm.) fibroblasts were used. (B) Growth curves of control cells and RNASEH1 cells from S1 in glucose (high-glucose medium) and galactose (glucose-free medium supplemented with 50 mM galactose). Cell growth was monitored continuously by the IncuCyte live cell imager (Essen Bioscience). Data represent the average ± SD of three independent experiments. (C) Mitochondria (red) were stained for 20 min with ΔP-dependent dye (20 nM TMRM), and DNA (green) was stained with PicoGreen (3 μl/ml) in live cells grown in glucose or galactose for 5 days. A digitally enhanced TMRM image from RNASEH1 mutant fibroblasts from S1 is shown in Figure S4A.
Figure 4
Figure 4
Mitochondrial DNA Copy Number and 7S DNA Mutations in RNASEH1 Mutant Fibroblasts from S1and Muscle from S1 and S2 (A) Total DNA from control and RNASEH1 mutant fibroblasts was digested with PvuII, and mtDNA was analyzed by one-dimensional Southern blot. Radioactive probes (able to detect both linearized mtDNA and 7S DNA) specific to the human mtDNA D-loop region (nucleotide positions 16.341–16.151) and 18S ribosomal DNA were applied. (B) The relative mtDNA copy number (mtDNA/18S rDNA ratio) was obtained after quantification of the Southern blot signal with PhosphorImager screens and normalization to control fibroblasts. ∗∗∗p < 0.001 (two-tailed Student’s t test). n = 2 experiments. Error bars represent 1 SD. (C) 7S DNA levels (7S DNA/mtDNA ratio) were obtained after quantification of the Southern blot signal with PhosphorImager screens and normalization to control fibroblasts. ∗∗∗p < 0.001 (two-tailed Student’s t test). n = 2 experiments. Error bars represent 1 SD. (D) 7S DNA levels (7S DNA/mtDNA ratio) in muscle from S1, S2, and subjects with mutations in MGME1 and DNA2 were assessed by qPCR. Error bars represent 1 SD.
Figure 5
Figure 5
Effect of Mutant RNASEH1 Fibroblasts from S1 on mtDNA Replication (A) Restriction enzyme sites and position of the probe are labeled. The origin of the H-strand replication (OH) is marked within the non-coding region (black bar). (B) mtDNA replication intermediates analyzed by two-dimensional agarose gel electrophoresis and Southern blot. Explanatory cartoons are provided at the right of each image; shades of gray reflect the different intensities of the signal. (C) A cartoon based on this and previous work shows different replication intermediates associated with this fragment and the non-replicating fragment, 1n. (D) Proposed models that could explain the presence of a Y-arc extension (left) and increased double-Y (right) mtDNA replication intermediates from RNASEH1 mutant fibroblasts from S1. Parental DNA strands are in black, nascent DNA strands are in blue, and RNA is in red. The L-strand promoter (LSP) and conserved sequence block region (CSB) are marked as reference points.
Figure 6
Figure 6
mtDNA Replication Is Slowed Down in Mutant RNASEH1 Fibroblasts from S1 (A) mtDNA copy number during depletion and recovery in control and RNASEH1 mutant fibroblasts. Depletion was achieved by the addition of 100 ng/ml EtBr to the culture medium for 96 hr, and recovery was followed up for 192 hr after the removal of the drug. mtDNA copy number was determined by qPCR, and each data point represents the mean values from two independent determinations ± SD. Arrowheads indicate the time point at which mtDNA was recovered at or close to initial values for each cell line. (B) Detection of newly synthesized mtDNA. Cells were treated with 20 μM Aphidicolin (Sigma) for 6 hr to block nuclear DNA replication. Total DNA from control and RNASEH1 mutant fibroblasts subjected to pulse labeling of mtDNA with BrdU (100 μM) for 0, 1, 3, 6, and 24 hr was digested with NaeI and analyzed by one-dimensional southwestern blot. The BrdU signal was immonodetected with anti-BrdU antibody (Becton Dickinson) and was followed by mtDNA detection using a radioactive probe specific to the human mtDNA D-loop region. (C) Plot of BrdU incorporation (normalized to mtDNA loading) over time; the linear regression for each cell line is shown. Each data point represents the mean of two replicates ± SD.

References

    1. Lamperti C., Zeviani M. Encephalomyopathies caused by abnormal nuclear-mitochondrial intergenomic cross-talk. Acta Myol. 2009;28:2–11. - PMC - PubMed
    1. Copeland W.C. Defects in mitochondrial DNA replication and human disease. Crit. Rev. Biochem. Mol. Biol. 2012;47:64–74. - PMC - PubMed
    1. Ronchi D., Di Fonzo A., Lin W., Bordoni A., Liu C., Fassone E., Pagliarani S., Rizzuti M., Zheng L., Filosto M. Mutations in DNA2 link progressive myopathy to mitochondrial DNA instability. Am. J. Hum. Genet. 2013;92:293–300. - PMC - PubMed
    1. Kornblum C., Nicholls T.J., Haack T.B., Schöler S., Peeva V., Danhauser K., Hallmann K., Zsurka G., Rorbach J., Iuso A. Loss-of-function mutations in MGME1 impair mtDNA replication and cause multisystemic mitochondrial disease. Nat. Genet. 2013;45:214–219. - PMC - PubMed
    1. Cerritelli S.M., Crouch R.J. Cloning, expression, and mapping of ribonucleases H of human and mouse related to bacterial RNase HI. Genomics. 1998;53:300–307. - PubMed

Publication types

MeSH terms