. 2015 Jul 2;17(1):35-46.
doi: 10.1016/j.stem.2015.05.003. Epub 2015 Jun 18.

Functionally Distinct Subsets of Lineage-Biased Multipotent Progenitors Control Blood Production in Normal and Regenerative Conditions

Affiliations

Functionally Distinct Subsets of Lineage-Biased Multipotent Progenitors Control Blood Production in Normal and Regenerative Conditions

Eric M Pietras et al. Cell Stem Cell. .

Abstract

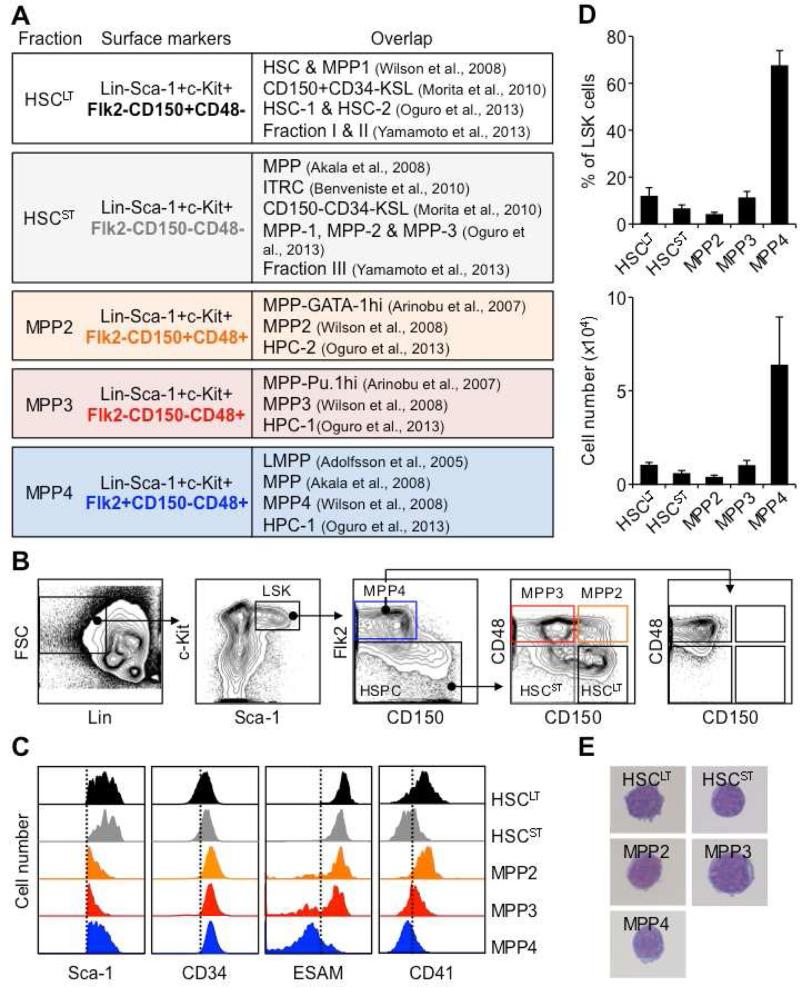
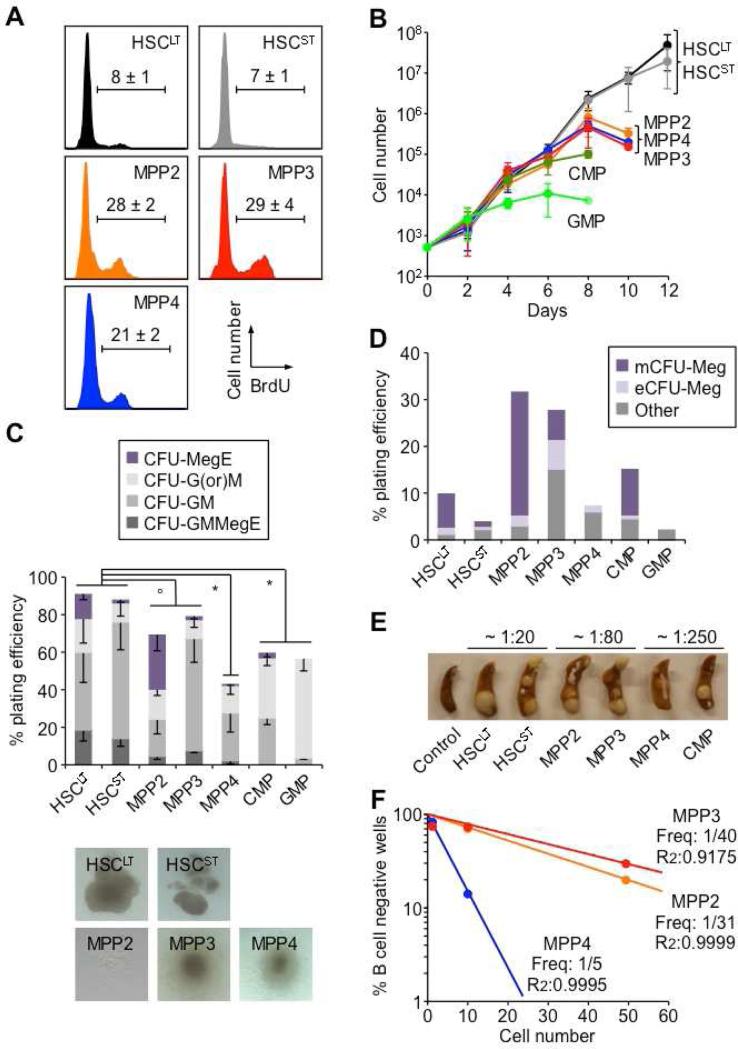
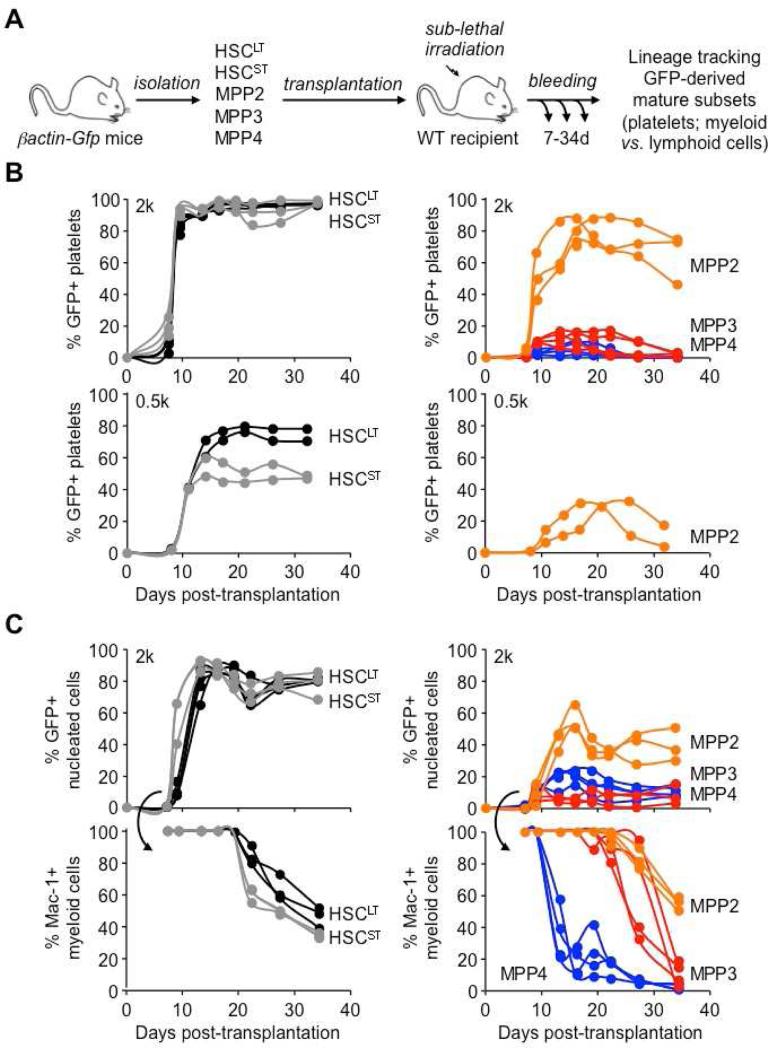
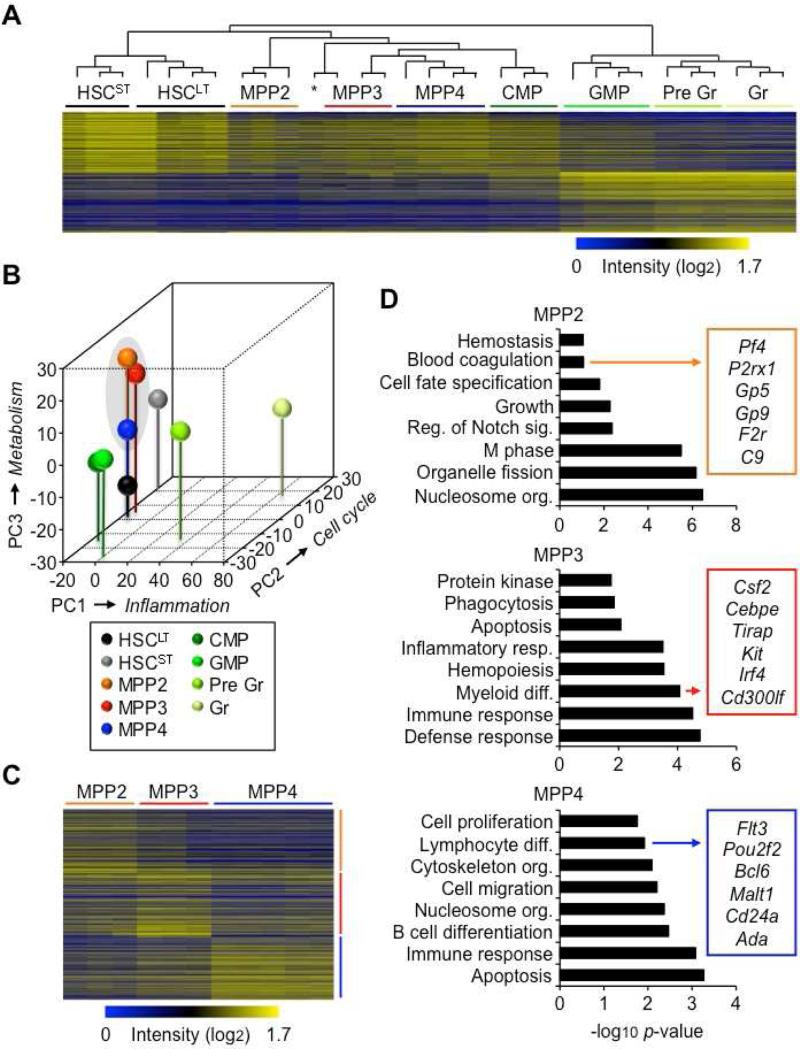
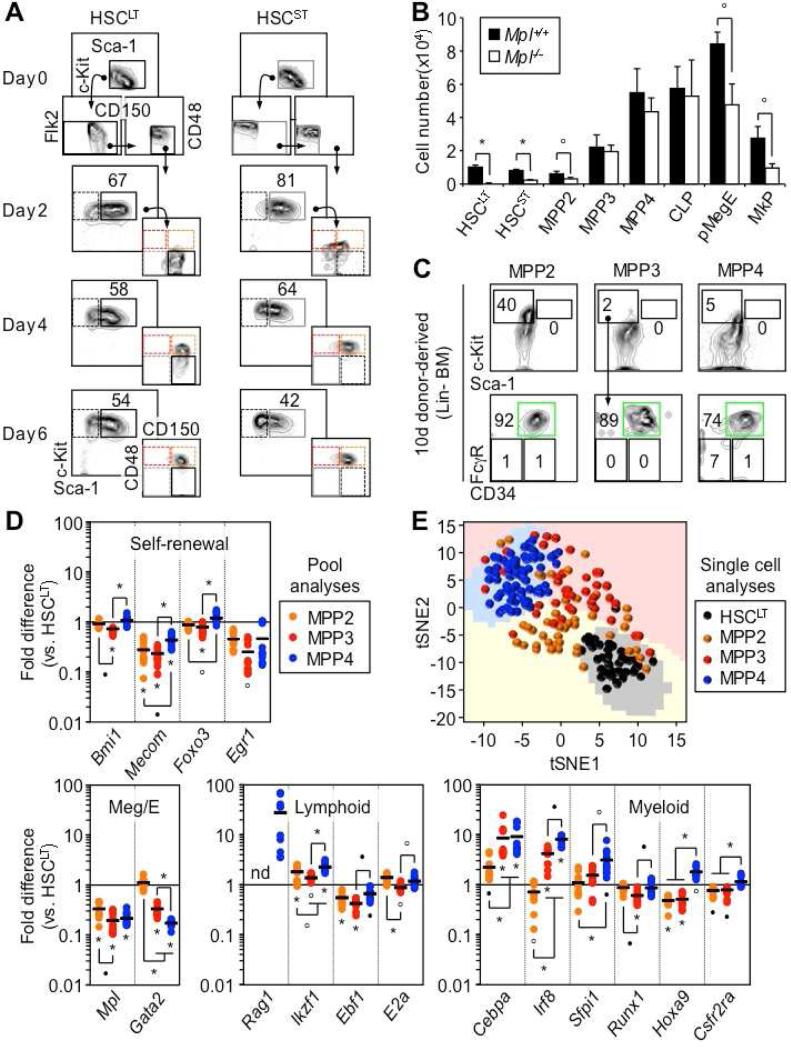
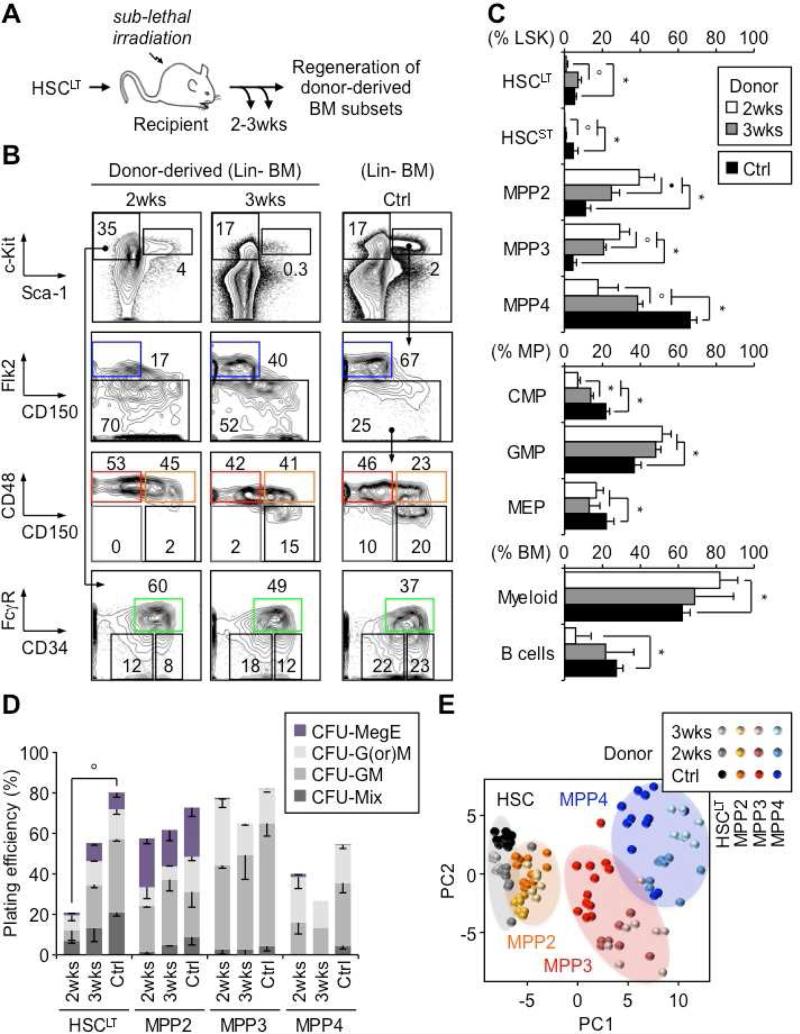
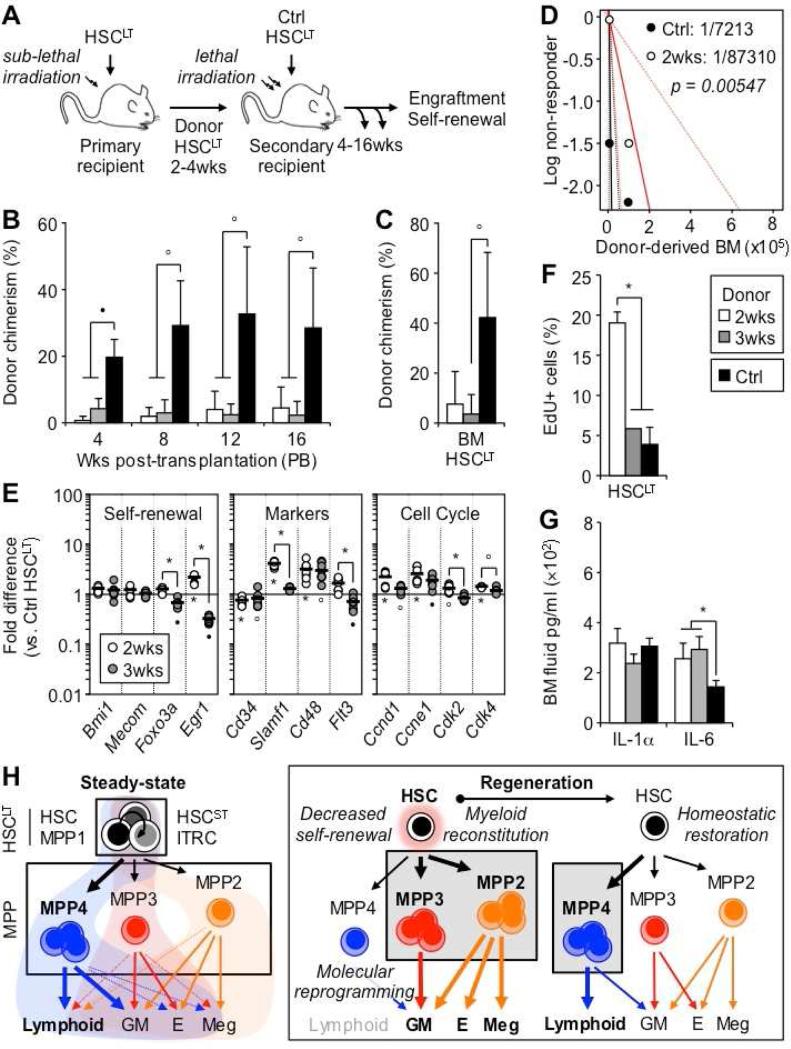
Despite great advances in understanding the mechanisms underlying blood production, lineage specification at the level of multipotent progenitors (MPPs) remains poorly understood. Here, we show that MPP2 and MPP3 are distinct myeloid-biased MPP subsets that work together with lymphoid-primed MPP4 cells to control blood production. We find that all MPPs are produced in parallel by hematopoietic stem cells (HSCs), but with different kinetics and at variable levels depending on hematopoietic demands. We also show that the normally rare myeloid-biased MPPs are transiently overproduced by HSCs in regenerating conditions, hence supporting myeloid amplification to rebuild the hematopoietic system. This shift is accompanied by a reduction in self-renewal activity in regenerating HSCs and reprogramming of MPP4 fate toward the myeloid lineage. Our results support a dynamic model of blood development in which HSCs convey lineage specification through independent production of distinct lineage-biased MPP subsets that, in turn, support lineage expansion and differentiation.


Figures

Figure 1
Figure 1. Re-investigating MPP subsets
(A) Table showing overlap of MPP subsets with previously published definitions. (B) Representative gating strategy used to identify and isolate HSCLT, HSCST, MPP2, MPP3 and MPP4 based on expression of Flk2, CD48 and CD150 in BM LSK. (C) Representative histograms of Sca-1, CD34, ESAM and CD41 expression in the indicated LSK subsets. (D) Average percentage in BM LSK and absolute numbers of each population (8 mice/group). (E) Wright-Giemsa staining of the indicated LSK subsets. Results are expressed as mean ± SD.
Figure 2
Figure 2. Co-existence of functionally distinct MPP subsets
(A) Proliferation rates. Cells were pulsed for 1h with BrdU before analysis (n ≥ 3). (B) Expansion in liquid culture. Cells were counted every other day (n = 2). (C) Methylcellulose clonogenic assays and pictures of representative colonies. Single cells were used to measure plating efficiency and colony forming unit (CFU) activity (n ≥ 3). (D) Meg differentiation potential in collagen-based MegaCult assays (n = 2). mCFU-Meg: small mature colony of ≤ 6 Meg; eCFU-Meg: large early colony of ≥ 6 Meg. (E) CFU-S assays. Representative photograph of spleen colonies obtained after transplantation of the indicated populations in lethally irradiated mice (n = 2). CFU-S frequency is given at day12. (F) Clonogenic B-cell differentiation potential on OP9/IL-7 stromal cells. Single, 10 and 50 cells were grown for 16 days and analyzed by flow cytometry for production of CD19+ B cells (10-34 wells/cell dose). Results are expressed as mean ± SEM; op < 0.05, • p < 0.01, * p < 0.001. See also Figure S1.
Figure 3
Figure 3. Specific lineage biases in MPP subsets
(A) Experimental scheme for the in vivo lineage tracking experiments. GFP+ populations were transplanted into sub-lethally irradiated recipients and followed over time for their reconstitution activity and lineage potential in PB. (B) Platelet chimerism following transplantation of 2,000 (upper graphs) or 500 (lower graphs) cells of the indicated donor GFP+ population. Each line represents individual mice (2-4/group). (C) Nucleated cell chimerism (upper graphs) and percent of donor-derived Mac1+ myeloid cells (lower graphs) following transplantation of 2,000 cells of the indicated donor GFP+ population. Each line represents individual mice (2-4/group). See also Figure S2.
Figure 4
Figure 4. Molecular biases in MPP subsets
(A) Hierarchical clustering analysis based on the 1000 most highly expressed genes in HSCLT and GM lineage-committed cells (GMP, Gr precursors: pre Gr; Gr). * Indicates one MPP4 sample clustering independently. (B) Principal component (PC) analysis of the microarray results shown in (A). Axis labels indicate the primary gene signature driving each PC separation. (C) Individual gene signatures representing the 1000 most highly expressed genes in MPP2, MPP3 and MPP4 relative to the other two populations. (D) Gene ontology (GO) analyses of the gene signatures shown in (C). See also Figure S3 and Table S1, S2, S3, S4.
Figure 5
Figure 5. Hierarchical organization and molecular priming
(A) Differentiation in vitro. Representative FACS plots showing HSCLT and HSCST differentiation kinetics in myeloid conditions (n = 2). (B) Size of the indicated BM populations in Mpl−/− and littermate control mice (3 mice/group). (C) Differentiation in vivo. Representative FACS plots of LSK and myeloid progenitor output 10 days following transplantation of 5,000 cells of the indicated donor population (3 mice/group). (D) Fluidigm gene expression analyses at steady state. Results are expressed as mean (bar) and individual fold differences compared to HSCLT (8-12 pools of 100 cells /population; nd: not detectable). (E) t-distributed stochastic neighbor embedding (tSNE) analysis of Fluidigm gene expression data acquired from single cells (30-58 cells/population). Results are expressed as mean ± SD; op < 0.05, •p < 0.01, *p < 0.001. See also Figures S4 and S5.
Figure 6
Figure 6. Contribution to blood regeneration
(A) Experimental scheme for in vivo blood regeneration experiments. Donor HSCLT were transplanted into sub-lethally irradiated congenic recipients (2,000 HSCLT/mouse) and regeneration of donor BM subsets was followed at 2 and 3 weeks post-transplantation and compared to steady state control (Ctrl) mice. (B) Representative FACS plots of regenerating BM subsets. (C) Frequency of the indicated BM subsets (6-10 mice/group). (D) Methylcellulose clonogenic assays for the indicated populations (n = 1-4) (E) PC analysis of Fluidigm gene expression data from the indicated populations (8-12 pools of 100 cells/condition). Results are expressed as mean ± SD or SEM (D); op < 0.05, •p < 0.01, *p < 0.001. See also Figure S5, S6.
Figure 7
Figure 7. Myeloid-biased MPPs are a transient compartment of myeloid amplification
(A) Experimental scheme for re-transplantation of regenerating HSCLT. Donor CD45.2 HSCLT isolated from primary recipients at 2 and 3 weeks post-transplantation or from Ctrl mice were injected into lethally irradiated secondary CD45.1 recipients (100 HSCLT/mouse) together with 3×10⁵ Sca-1-depleted CD45.1 BM cells (4-13 mice/group). (B) Engraftment over time in PB. (C) Engraftment in BM HSCLT at 16 weeks post-transplantation. (D) Limit dilution analyses (LDA) of Ctrl (black) and 2 weeks post-transplantation (red) BM cells. Dotted lines represent confidence intervals and values the estimated HSC frequency. (E) Fluidigm gene expression analyses of key self-renewal determinant, surface marker and cell cycle genes in regenerating HSCLT at 2 and 3 weeks post-transplantation. Results are expressed as mean (bar) and individual fold compared to steady state Ctrl HSCLT (8-12 pools of 100 cells/condition). (F) Proliferation rates in mice pulsed for 1h with EdU (n = 1-3). (G) IL-1 and IL-6 levels in BM fluids (5 mice/group). (H) Revised model of blood production at steady state and in regenerating conditions. Results are expressed as mean ± SD or SEM (F); op < 0.05, •p < 0.01, *p < 0.001. See also Figure S7.

References

    1. Adolfsson J, Mansson R, Buza-Vidas N, Hultquist A, Liuba K, Jensen CT, Bryder D, Yang L, Borge OJ, Thoren LA, et al. Identification of Flt3+ lympho-myeloid stem cells lacking erythro-megakaryocytic potential a revised road map for adult blood lineage commitment. Cell. 2005;121:295–306. - PubMed
    1. Akala OO, Park IK, Qian D, Pihalja M, Becker MW, Clarke MF. Long-term haematopoietic reconstitution by Trp53−/−p16Ink4a−/−p19Arf−/− multipotent progenitors. Nature. 2008;453:228–232. - PubMed
    1. Arinobu Y, Mizuno S, Chong Y, Shigematsu H, Iino T, Iwasaki H, Graf T, Mayfield R, Chan S, Kastner P, et al. Reciprocal activation of GATA-1 and PU.1 marks initial specification of hematopoietic stem cells into myeloerythroid and myelolymphoid lineages. Cell Stem Cell. 2007;1:416–427. - PubMed
    1. Beerman I, Bhattacharya D, Zandi S, Sigvardsson M, Weissman IL, Bryder D, Rossi DJ. Functionally distinct hematopoietic stem cells modulate hematopoietic lineage potential during aging by a mechanism of clonal expansion. Proc Natl Acad Sci USA. 2010;107:5465–5470. - PMC - PubMed
    1. Benveniste P, Frelin C, Janmohamed S, Barbara M, Herrington R, Hyam D, Iscove NN. Intermediate-term hematopoietic stem cells with extended but time-limited reconstitution potential. Cell Stem Cell. 2010;6:48–58. - PubMed

Publication types

MeSH terms

Associated data