. 2015 Jul 2;162(1):170-83.
doi: 10.1016/j.cell.2015.05.051. Epub 2015 Jun 18.

A Conserved Circular Network of Coregulated Lipids Modulates Innate Immune Responses

Affiliations

A Conserved Circular Network of Coregulated Lipids Modulates Innate Immune Responses

Marielle S Köberlin et al. Cell. .

Abstract

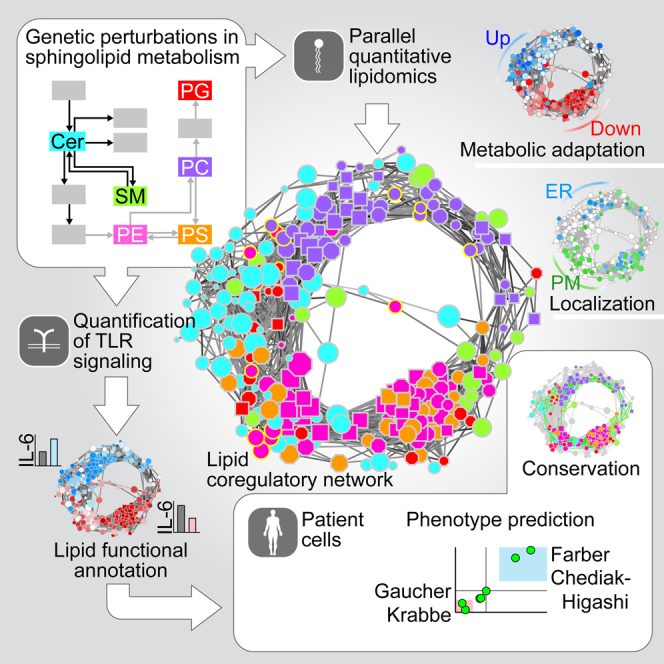
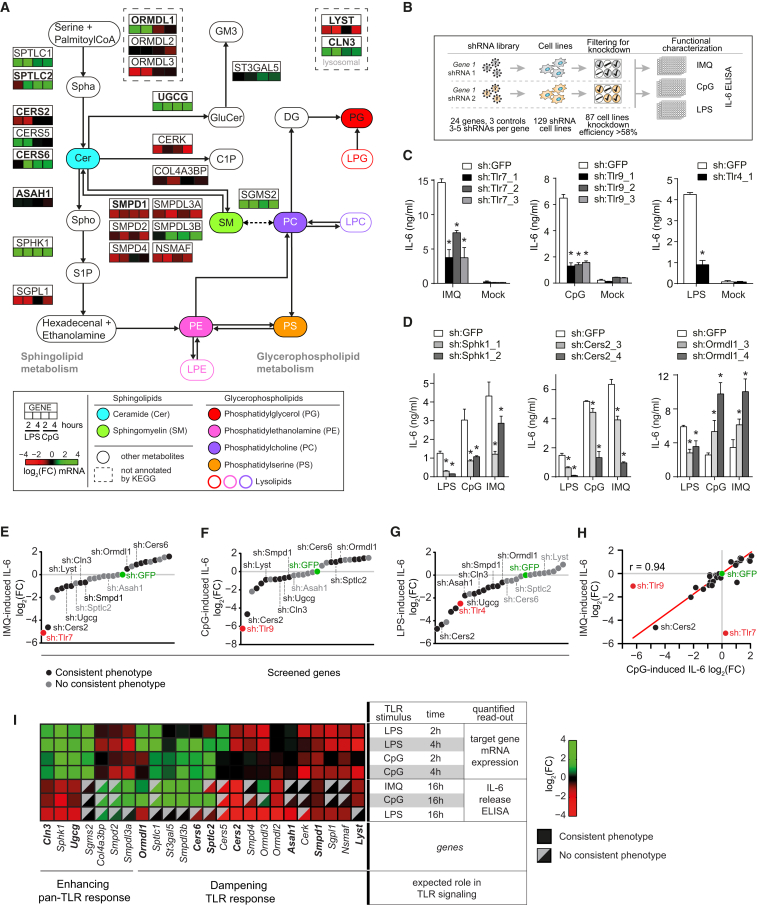
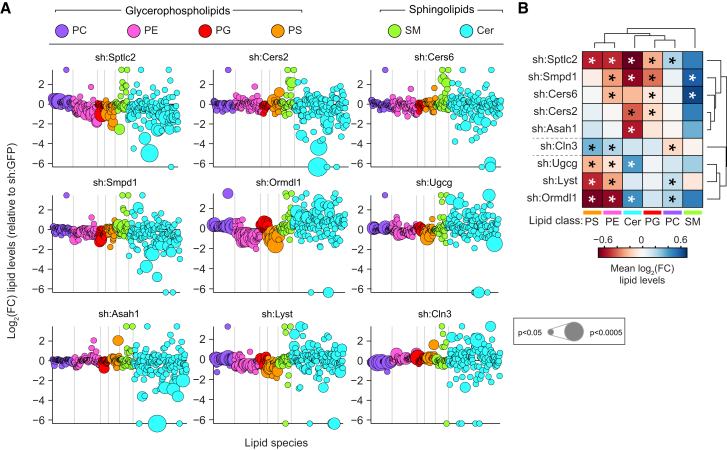
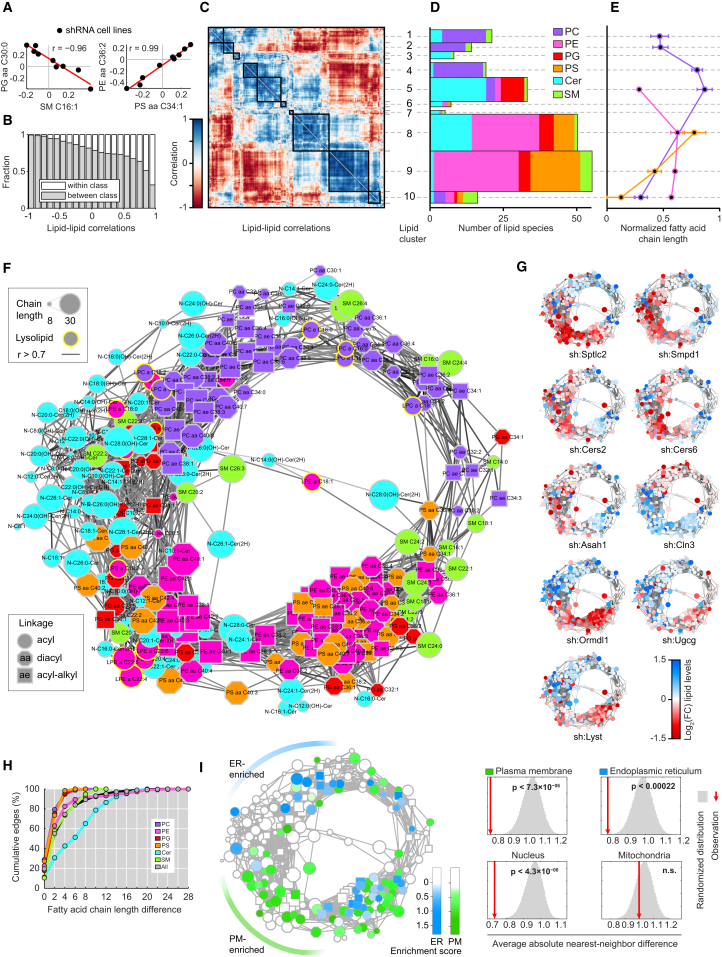
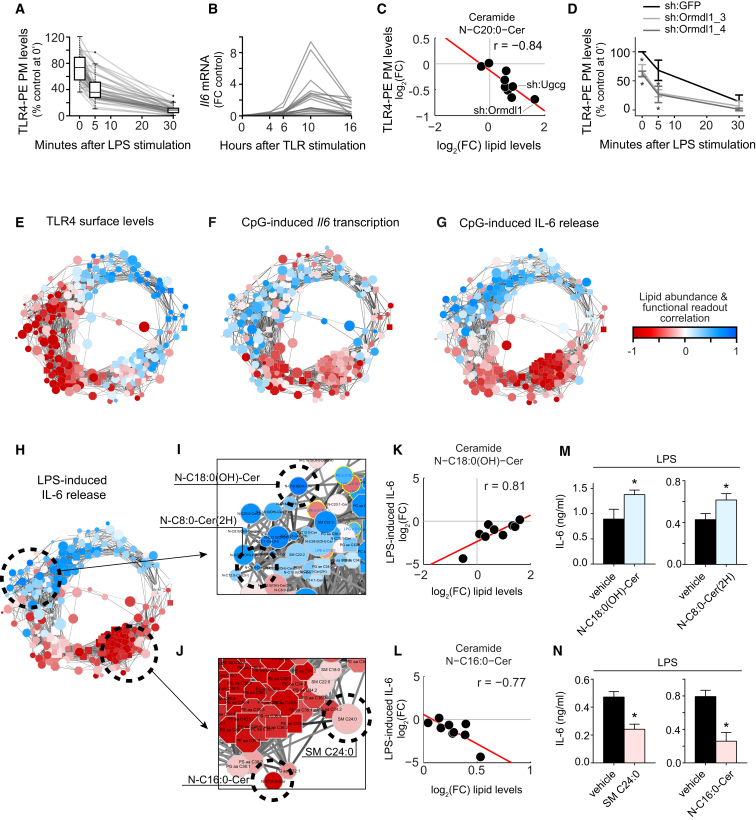
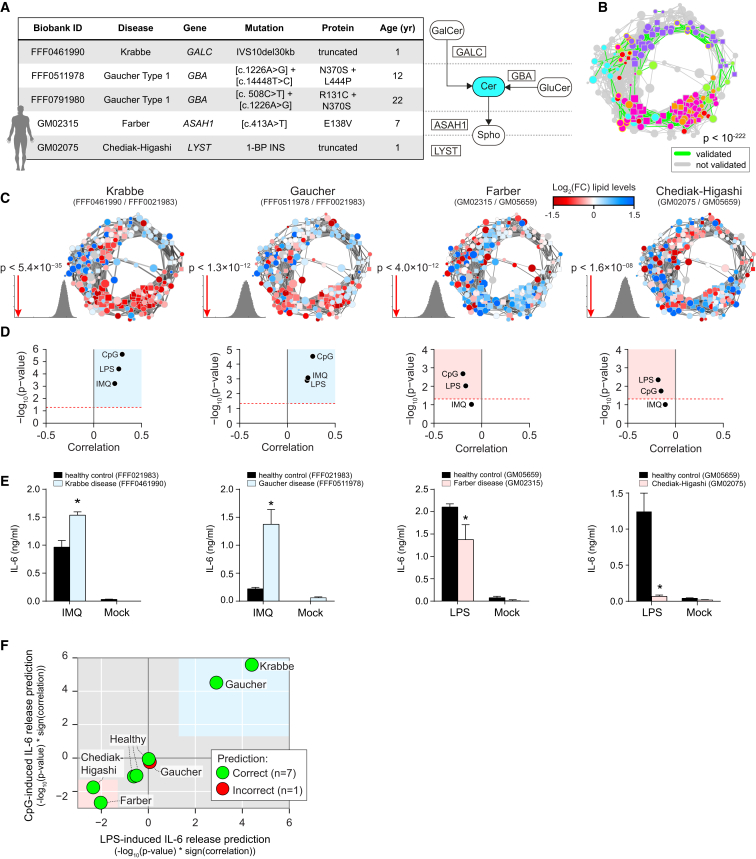
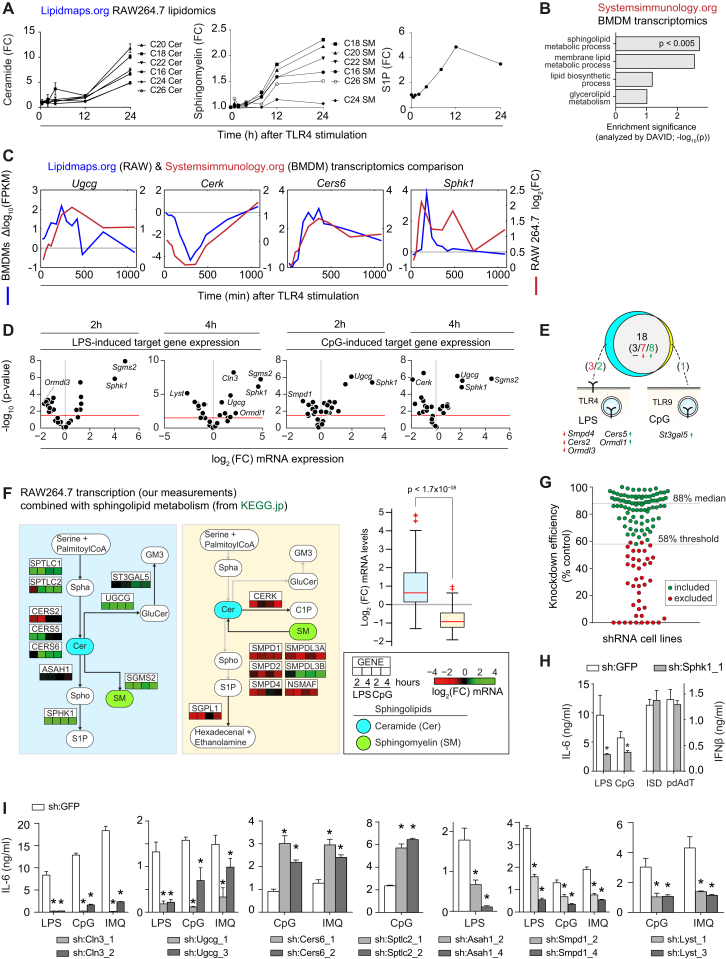
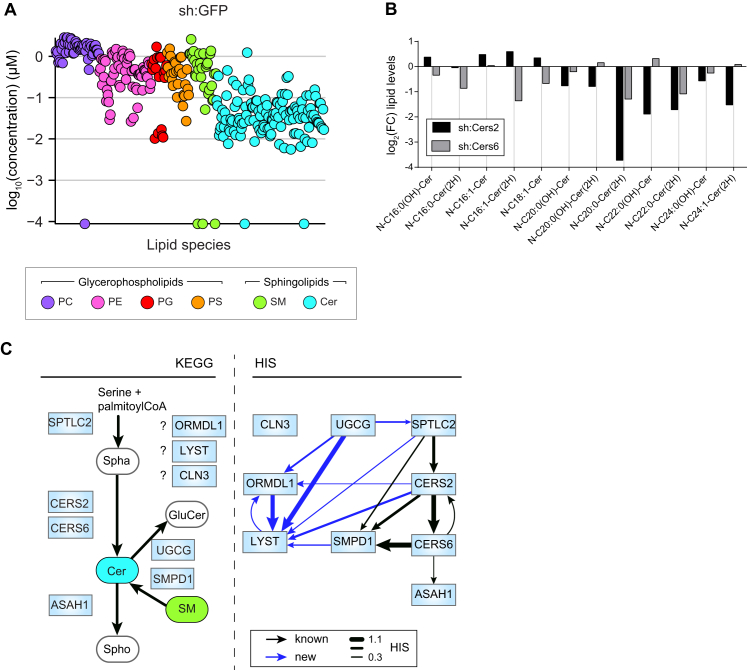
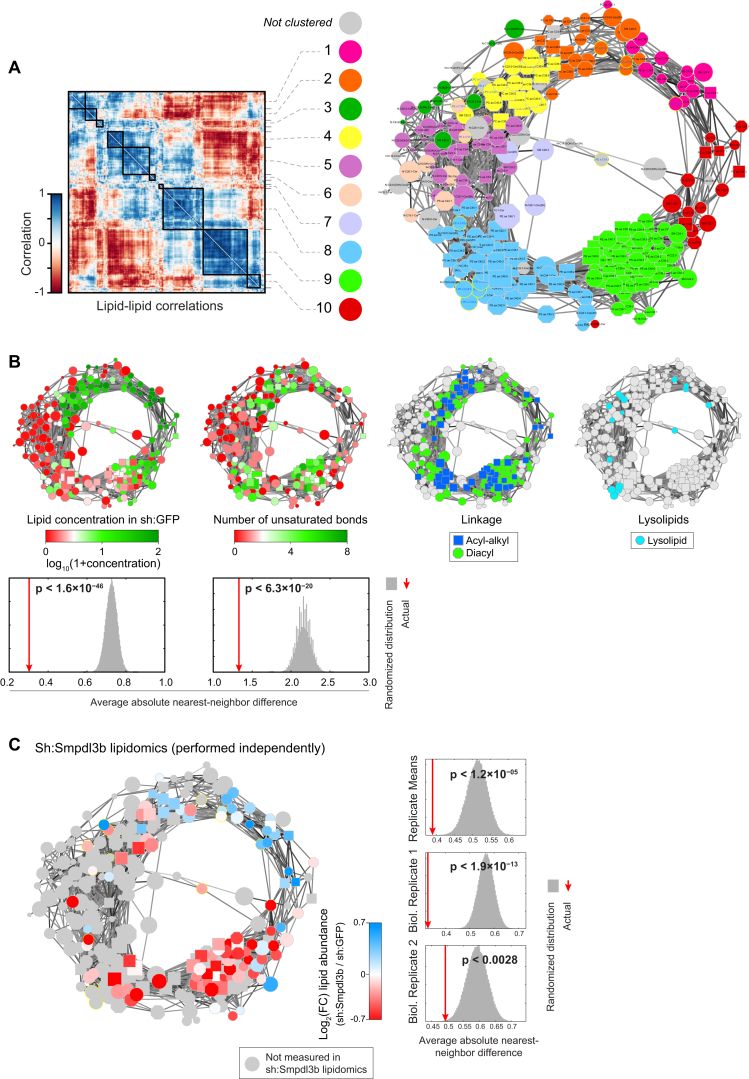
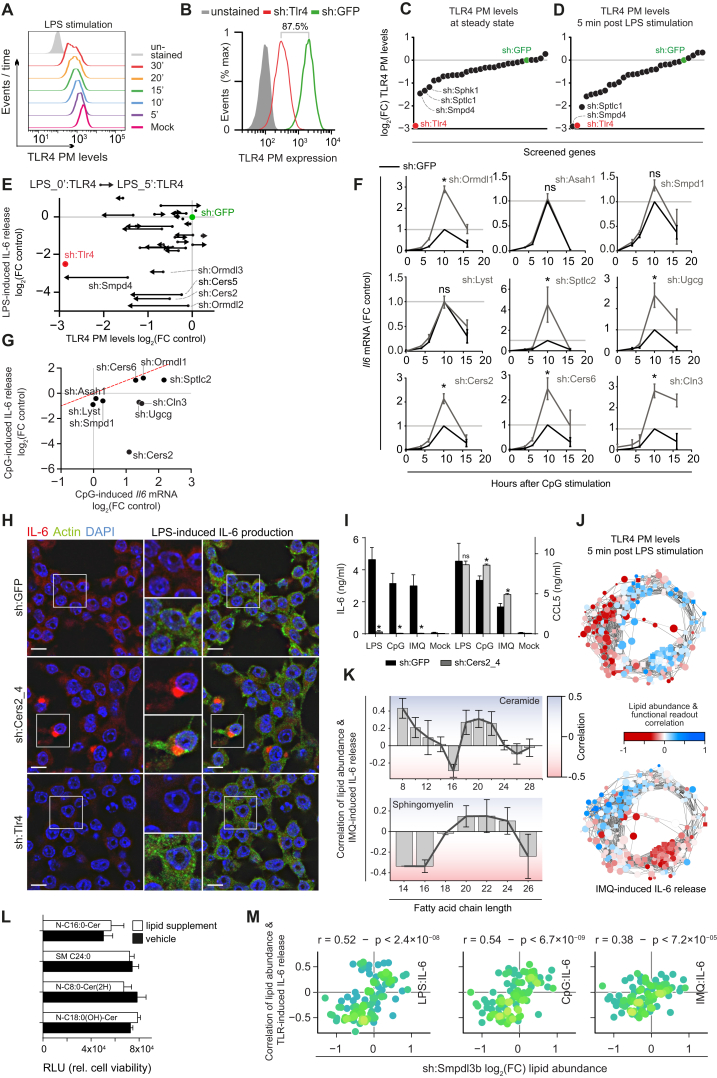
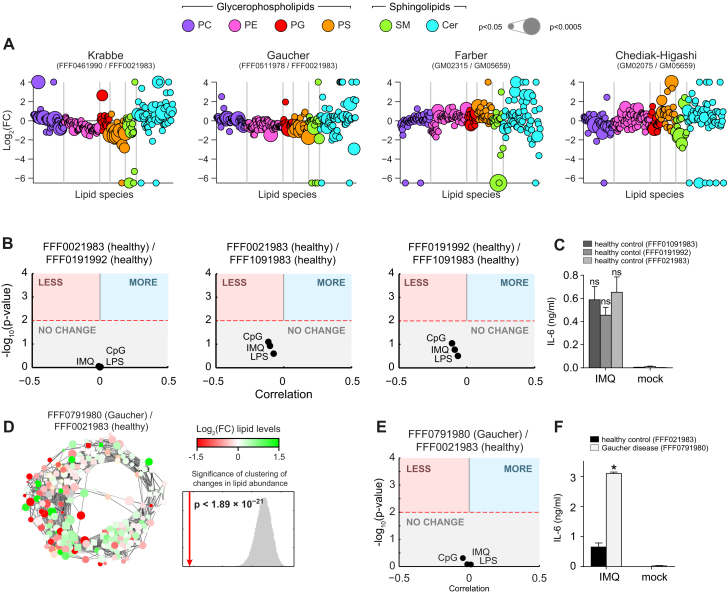
Lipid composition affects the biophysical properties of membranes that provide a platform for receptor-mediated cellular signaling. To study the regulatory role of membrane lipid composition, we combined genetic perturbations of sphingolipid metabolism with the quantification of diverse steps in Toll-like receptor (TLR) signaling and mass spectrometry-based lipidomics. Membrane lipid composition was broadly affected by these perturbations, revealing a circular network of coregulated sphingolipids and glycerophospholipids. This evolutionarily conserved network architecture simultaneously reflected membrane lipid metabolism, subcellular localization, and adaptation mechanisms. Integration of the diverse TLR-induced inflammatory phenotypes with changes in lipid abundance assigned distinct functional roles to individual lipid species organized across the network. This functional annotation accurately predicted the inflammatory response of cells derived from patients suffering from lipid storage disorders, based solely on their altered membrane lipid composition. The analytical strategy described here empowers the understanding of higher-level organization of membrane lipid function in diverse biological systems.


Figures

None
Graphical abstract
Figure 1
Figure 1
TLR-Driven Transcription of the Sphingolipid Metabolic Network and Characterization of Cytokine Release upon shRNA-Mediated Silencing of This Network (A) Selected sphingolipid and glycerophospholipid metabolic reactions (KEGG), shown together with main metabolites (rounded rectangles) and 24 selected proteins (rectangles). Protein location based on KEGG where possible. Heatmaps show relative expression of 24 selected genes after stimulation of RAW cells with LPS (100 ng/ml) or CpG (5 μM) for indicated time points measured by qRT-PCR. Bold protein names indicate selection for lipidomics analysis. Metabolites are colored consistently throughout the study. Data are combined of at least two independent experiments with technical triplicates. FC, fold-change; Spha, sphinganine; Spho, sphingosine; C1P, ceramide-1-phosphate. For other abbreviations, see text or legend and Table S1. (B) Schematic representation of the generation and characterization of stable shRNA RAW cell lines, filtered based on knockdown efficiency. (C) IL-6 release as measured by ELISA in sh:Tlr and sh:GFP control cell lines stimulated with IMQ (5 μM), or LPS (100 ng/ml) or CpG (5 μM) for 16 hr. Data are representative of at least five independent experiments and shown as mean ± SD of four technical replicates. p < 0.0001. (D) As in (C), but for sh:Sphk1, sh:Cers2, and sh:Ormdl1 cell lines. Data are representative of at least five independent experiments and shown as mean ± SD of four technical replicates. p < 0.005. (E–G) Screening results of three IL-6 release screens in 87 loss-of-function cell lines stimulated for 16 hr with IMQ, CpG, and LPS as measured by ELISA. Values are plotted as log2 fold-change relative to the respective sh:GFP control cell line and averaged over multiple shRNA cell lines. Black dots represent the averages of two or more shRNA cell lines with consistent phenotypes, while gray dots represent averages of all shRNA cell lines per gene. Indicated genes are selected for lipidomics analysis. Data are combined of at least five independent experiments. (H) Scatter plot of IMQ and CpG screening results. Red line indicates linear fit. Data are combined of at least five independent experiments. (I) Heatmap shows integration of target gene expression in wild-type RAW cells after stimulation with LPS and CpG and IL-6 release screening results of shRNA cell lines. Gray triangles indicate absence of consistent phenotypes for multiple shRNAs per gene. Data are combined of at least five independent experiments. See also Figure S1 and Table S1.
Figure 2
Figure 2
Quantitative Lipidomics of Nine Stable shRNA Cell Lines Targeting Sphingolipid Metabolism Reveals Strongly Altered Lipid States (A) Lipidomics analysis of nine loss-of-function cell lines. Values are shown as log2 fold-change relative to sh:GFP. Each dot represents a lipid species, color coded per lipid class. Dot size indicates significance. Lipidomics data are combined of three independent experiments and represented as mean. (B) Hierarchical clustering of average log2 fold-change lipid levels per lipid class and cell line. Lipidomics data are combined of three independent experiments and represented as mean. p < 0.05. See also Figure S2 and Table S2.
Figure 3
Figure 3
Analysis of Lipid Abundance Reveals the Circular Organization of the Lipid Coregulatory Network (A) Scatter plots show example pairs of lipids whose relative abundance over the nine perturbations is negatively (left panel) or positively (right panel) correlated. Red lines indicate linear fit. Data are combined of three independent experiments and shown as mean. (B) Analysis of the fraction of correlations that link lipids of the same lipid class (white) or different lipid classes (gray), as function of correlation strength. Data are combined of three independent experiments and shown as mean. (C) Hierarchical clustering of the lipid-lipid correlation matrix. Rows and columns correspond to the 245 measured lipid species. Black boxes indicate clusters of strongly positively correlated lipids. Lipid cluster numbers indicated on the right. Data are combined of three independent experiments and shown as mean. (D) Analysis of the number of lipids in each cluster per lipid class. Width of the bars is scaled to match (C). Data are combined of three independent experiments and shown as mean. (E) Normalized fatty acid chain lengths for selected clusters and lipid classes. Lipid classes are colored as in (D). Chain length is normalized from the shortest to the longest fatty acid side chain per class. Data are combined of three independent experiments and shown as mean. Values are mean ± SEM. (F) Network visualization of the positive lipid-lipid correlations. Edges are correlations of r ≥ 0.7. Nodes are lipids. Node shape, size, and outline represent fatty acid bonds, chain length, and lysolipids, respectively (see legends). Data are combined of three independent experiments and shown as mean. (G) Nodes of the network are color-coded based on the fold-change of relative lipid abundance for each of the nine shRNA cell lines as indicated in legend. Data are combined of three independent experiments and shown as mean. (H) Cumulative percentage of lipid coregulation as a function of the maximum fatty acid chain length difference per lipid class and for all (see legend). Data are combined of three independent experiments and shown as mean. (I) Left: network visualization of lipid enrichment in either ER (blue) or plasma membrane (PM, green) subcellular fractions. White nodes depict not enriched or not measured lipids. Right: significance of the clustering on the circular network for the enrichment in four subcellular fractions. Red lines indicate the average absolute difference between enrichment scores of direct neighbors in the network, gray areas indicate the distribution of randomized repeats. NS, not significant. Subcellular fraction data are from http://lipidmaps.org combined of three independent experiments and shown as mean. See also Figure S3.
Figure 4
Figure 4
Inference and Validation of Lipid Function in TLR-Related Processes (A) TLR4 PM levels after stimulation with LPS for indicated time points normalized to unstained and steady-state control levels for 41 cell lines silencing 24 genes. Both box-and-whisker plots and individual line plots are shown. Lines represent mean values of two independent experiments. (B) Il6 expression after TLR stimulation measured at indicated time points and normalized to unstimulated and 10h sh:GFP control for 14 cell lines. Lines represent mean values of two independent experiments. (C) Scatter plot shows example correlation between relative lipid abundance and TLR4 PM levels over the nine perturbations. Red line indicates linear fit. (D) As in (A), TLR4 PM levels for sh:Ormdl1_3, sh:Ormdl1_4 and sh:GFP control. Data are shown as mean ± SD of two technical replicates p < 0.05. (E–H) Correlations between relative lipid abundance and measurements of selected TLR-related processes plotted on the circular network. (I and J) Network close-up of lipids positively (I) and negatively (J) correlated with LPS-induced IL-6 release. (K) Example correlation of the relative abundance of N-C18:0(OH)-Cer with LPS-induced IL-6 release over all nine cell lines. Red line indicates linear fit. (L) As in (K), but for the negatively correlated N-C16:0-Cer. (M) IL-6 release as measured by ELISA after pre-treatment with N-C18:0(OH)-Cer (15μM) or N-C8:0-Cer(2H) (15 μM) or respective vehicle controls. Data are representative of three independent experiments and presented as mean ± SD of four technical replicates. p < 0.005. (N) As in (M), pre-treatment with N-C16:0-Cer (15 μM) or SM C24:0 (15 μM) or respective vehicle controls. Data are representative of three independent experiments and presented as mean ± SD of four technical replicates. p < 0.005. See also Figure S4 and Table S1.
Figure 5
Figure 5
Lipidomics Analysis of Patient-Derived Fibroblasts Confirms the Circular Lipid Coregulatory Network and Functional Lipid Annotations (A) Overview of different patient-derived fibroblast samples. Mutated genes are indicated in a close-up of the ceramide metabolic network. (B) Coregulated lipids observed in both datasets (see legend). Significance (p < 10−222) calculated by the hypergeometric distribution. Data are combined of three independent experiments. (C) Lipid abundance plotted on the circular network for four patient fibroblast samples. Significance of the clustering on the circular network for the lipid abundance measurements is calculated and shown as in Figure 3I. Data are combined of three independent experiments. (D) IL-6 release phenotype predictions for each of the patient fibroblast samples are based on the correlation between lipid functional annotation and lipid abundance. Red dashed line indicates p < 0.05. Colored areas indicate significant phenotype predictions (blue, increased IL-6 release; red, reduced IL-6 release). (E) IL-6 release after stimulation with IMQ (25 μM) and LPS (1 μg/ml) as measured by ELISA for patient fibroblasts and age-matched healthy controls. Mock: unstimulated. Patient fibroblast bars are colored according to the predictions. Data are representative of three independent experiments and presented as mean ± SD of four technical replicates. p < 0.001. (F) Summary of the LPS- and CpG-induced phenotype predictions for all fibroblast samples, colored according to the agreement between predictions and experiments. Blue and red areas indicate significant (p < 0.05) phenotype predictions as in (D). See also Figure S5 and Table S3.
Figure S1
Figure S1
TLR-Driven Transcription of the Sphingolipid Metabolic Network and Characterization of Cytokine Release upon shRNA-Mediated Silencing of This Network, Related to Figure 1 (A) TLR4-induced changes in the abundance of selected sphingolipids in RAW macrophages. Data from http://lipidmaps.org (Dennis et al., 2010). (B) Pathway enrichment analysis of all differentially regulated genes in a genome-wide analysis of TLR4-stimulated bone marrow-derived macrophages (BMDMs). Shown are the highest enriched lipid-related annotations. Data from http://systemsimmunology.org (Ramsey et al., 2008). Enrichment analyzed by DAVID. (C) Relative expression of key regulators of sphingolipid metabolism upon TLR4 stimulation over indicated time points in BMDMs and RAW cells. Relative expression calculated as delta log10 of the FPKM, or as log2 fold-change. (D) Scatter plot of log2 fold-change expression (x axis) versus significance (y axis; t test) of RAW macrophages stimulated with LPS or CpG for 2 and 4 hr. Red lines indicate p < 0.05. Strongest regulated genes are indicated. Data are combined of two independent experiments with two technical replicates each. (E) Venn diagram shows the number of regulated genes upon TLR4 stimulation by LPS and/or TLR9 stimulation by CpG. Predominant TLR localizations indicated in schemas. Red and green numbers in brackets indicate down- and upregulated genes respectively. (F) LPS- and CpG-induced relative expression of selected genes separated by different branches of the sphingolipid metabolic pathway (KEGG). Boxplots group all expression values per subnetworks, with colors corresponding to subnetwork background colors. Abbreviations are as in Figure 1. Data are combined of two independent experiments with two technical replicates each. (G) Knockdown efficiency measured by qRT-PCR of all 129 shRNA cell lines, normalized to sh:GFP. Each dot represents one cell line. Green dots were included in the screen, red dots were excluded due to insufficient knockdown efficiency. Threshold and median knockdown efficiency are indicated. Data are mean of technical triplicates. (H) IL-6 release after stimulation with LPS or CpG, and IFNβ release after stimulation with Interferon-stimulatory DNA (ISD) or pdAdt in sh:Sphk1_1 and sh:GFP. Data are representative of three independent experiments. (I) IL-6 release after stimulation with LPS, CpG or IMQ after 16 hr measured in selected shRNA cell lines and sh:GFP. indicates p < 0.005. Data are representative of five independent experiments and shown as mean ± SD of four technical replicates. See also Table S1.
Figure S2
Figure S2
Quantitative Lipidomics of Nine Stable shRNA Cell Lines Targeting Sphingolipid Metabolism Reveals Strongly Altered Lipid States, Related to Figure 2 (A) Lipidomics measurements of sh:GFP control cell line shown as log10-transformed lipid concentrations (μM). (B) Values are log2 fold-change relative abundance of selected ceramide species in sh:Cers2 (black bars) and sh:Cers6 (gray bars) relative to sh:GFP. (C) Part of the sphingolipid metabolic pathway as defined by KEGG (left) compared to the hierarchical interactions (Snijder et al., 2013) between proteins inferred from changes in lipid abundance (right). Arrows indicate inferred hierarchy; known metabolic connections are indicated in black, unknown inferred interactions indicated in dark blue. Line thickness represents strength of hierarchical interaction. Spha: Sphinganine; Spho: Sphingosine; GluCer: Glucosylceramide. (A–C) Lipidomics data are combined of three independent experiments and represented as mean. See also Table S2.
Figure S3
Figure S3
Further Characterization and Validation of the Circular Lipid Coregulatory Network, Related to Figure 3 (A) Lipid clusters as identified in Figure 3C indicated in different colors on the lipid coregulatory network. Lipids that could not be assigned to any single cluster are indicated in gray. (B) Visualization of diverse measurements on the network: lipid abundance in sh:GFP (far left), the number of unsaturated bonds (left), the type of linkage (right), or lysolipids (far right). For lipid abundance and the number of unsaturated bonds the significance of clustering of these properties are displayed below the respective networks. Color-coded as indicated in corresponding legends. (C) Left: Relative lipid abundance in sh:Smpdl3b (Heinz et al., 2015) mapped onto the lipid network. Color-coded as indicated in legend. Significances of clustering of these features on the network are displayed.
Figure S4
Figure S4
Inference and Validation of Lipid Function in TLR-Related Processes, Related to Figure 4 (A) Histograms of TLR4-PE PM levels measured by FACS at steady state or after LPS (100ng/ml) stimulation at indicated time points in wild-type RAW cells. (B) Histogram of steady-state TLR4-PE PM levels measured in sh:Tlr4 and sh:GFP cell lines analyzed by FACS. (C and D) Screening results of TLR4 PM levels unstimulated (C) and after 5 min (D) of LPS (100 ng/ml) stimulation in loss-of-function cell lines stained with TLR4-PE and measured by FACS. Values are log2 fold-change of mean fluorescence intensity relative to sh:GFP. Indicated are genes with strongest knockdown phenotypes. (E) Vector plot of log2 fold-change TLR4 PM levels from 0 to 5 min (x axis) versus log2 fold-change in LPS-induced IL-6 release (y axis). Vector origin (dot) indicates 0 min and end (arrow) indicates 5 min. (F) Time course measurements of CpG-induced Il6 transcription in the nine knockdown cell lines used for lipidomics (gray line) normalized to unstimulated and 10h sh:GFP control (black line). (G) Scatter plot of log2 fold-change CpG-induced Il6 mRNA levels (x axis) versus log2 fold-change in CpG-induced IL-6 release (y axis). Indicated are the nine genes selected for lipidomics analysis. (H) Immunofluorescence microscopy of IL-6 protein levels in sh:Cers2_4, sh:GFP and sh:Tlr4 reveals perinuclear accumulation after 8h stimulation with LPS in sh:Cers2_4. IL-6 (red), actin (green), DAPI (blue). Scale bars indicate 10μm. Inserts show close-ups of indicated areas. (I) IL-6 and CCL5 release after stimulation with LPS, CpG, or IMQ, in sh:GFP and sh:Cers2_4. (J) Correlations between relative lipid abundance and measurements of LPS-induced TLR4 PM levels (top) and IMQ-induced IL-6 release (bottom) plotted on the circular network. Nodes of the network are color coded based on the strength of the correlation as indicated in legend. (K) Average (gray bars) and SEM of the correlations between lipid abundance and IMQ-stimulated IL-6 release, per lipid fatty acid chain length, for ceramides (top) and sphingomyelins (bottom). Dark gray lines indicate chain length trends. Background colors vary with strength of correlation (red for negative, blue for positive correlations). (L) Cell viability as measured by CellTiter-Glo luminescence, expressed in relative luminescence units (RLU) after supplementation with selected lipids (gray) or respective vehicle control (black). (M) Scatter plots between relative lipid abundance independently measured for sh:Smpdl3b (x axis) against functional lipid correlations (y axis) for all measured TLR-induced IL-6 release. Dots represent individual lipids, colored based on the local data density. Strong and significant positive correlations of IL-6 release predict a pro-inflammatory phenotype, as confirmed (Heinz et al., 2015). P-values are indicated above panels. (A) and (B) Data are representative of at least two independent experiments. (C) and (D) Data are combined of two independent experiments with two technical replicates each. (F) Transcriptional data are combined of two independent experiments and shown as mean ± SEM (H) Microscopy results are representative of two independent experiments. (I) Data are representative of at least two independent experiments. indicate p < 0.05. ns: not significant. (L) Data are representative of at least three independent experiments.
Figure S5
Figure S5
Lipidomics Analysis of Patient-Derived Fibroblasts Confirms Functional Lipid Annotations, Related to Figure 5 (A) Lipidomics analysis of 245 lipid species in four human fibroblast samples. Values are shown as log2 fold-change relative to the respective healthy controls. Each dot represents a lipid species, color coded per lipid class; dot size indicates significance. Vertical gray bars separate lipid classes. (B) IL-6 release phenotype prediction for the log2 fold-change normalized lipid states of pairs of healthy controls derived from the same biobank, based on the correlation between lipid functional annotation and lipid abundance. Red dashed line indicates p < 0.05. Colored areas indicate significant phenotype predictions (blue, increased IL-6 release; red, reduced IL-6 release). (C) IL-6 release after stimulation with IMQ as measured by ELISA for different healthy fibroblast samples (see legend). (D) Lipid abundance plotted on the circular network for the second Gaucher patient fibroblast sample relative to the respective healthy control. Significance of the clustering on the circular network for the lipid abundance measurements is shown. Red line indicates the average absolute difference between abundance of direct neighbors in the network; gray area indicates the distribution of randomized repeats. (E) As in (B), for the second Gaucher patient fibroblast sample. (F) IL-6 release after stimulation with IMQ as measured by ELISA for the second Gaucher patient fibroblast sample and age matched healthy control (see legend). Mock: Unstimulated. (A) and (D) Data are combined of three independent experiments. (C) and (F) Data are representative of three independent experiments and presented as mean ± SEM of three technical replicates. indicated p < 0.005; ns: not significant. See also Table S3.

References

    1. Alvarez S.E., Harikumar K.B., Hait N.C., Allegood J., Strub G.M., Kim E.Y., Maceyka M., Jiang H., Luo C., Kordula T. Sphingosine-1-phosphate is a missing cofactor for the E3 ubiquitin ligase TRAF2. Nature. 2010;465:1084–1088. - PMC - PubMed
    1. Andreyev A.Y., Fahy E., Guan Z., Kelly S., Li X., McDonald J.G., Milne S., Myers D., Park H., Ryan A. Subcellular organelle lipidomics in TLR-4-activated macrophages. J. Lipid Res. 2010;51:2785–2797. - PMC - PubMed
    1. Atilla-Gokcumen G.E., Muro E., Relat-Goberna J., Sasse S., Bedigian A., Coughlin M.L., Garcia-Manyes S., Eggert U.S. Dividing cells regulate their lipid composition and localization. Cell. 2014;156:428–439. - PMC - PubMed
    1. Bandyopadhyay S., Mehta M., Kuo D., Sung M.K., Chuang R., Jaehnig E.J., Bodenmiller B., Licon K., Copeland W., Shales M. Rewiring of genetic networks in response to DNA damage. Science. 2010;330:1385–1389. - PMC - PubMed
    1. Barak V., Acker M., Nisman B., Kalickman I., Abrahamov A., Zimran A., Yatziv S. Cytokines in Gaucher’s disease. Eur. Cytokine Netw. 1999;10:205–210. - PubMed

Publication types