. 2015 Jul 2;162(1):184-97.
doi: 10.1016/j.cell.2015.05.047. Epub 2015 Jun 18.

Data-Driven Phenotypic Dissection of AML Reveals Progenitor-like Cells that Correlate with Prognosis

Affiliations

Data-Driven Phenotypic Dissection of AML Reveals Progenitor-like Cells that Correlate with Prognosis

Jacob H Levine et al. Cell. .

Abstract

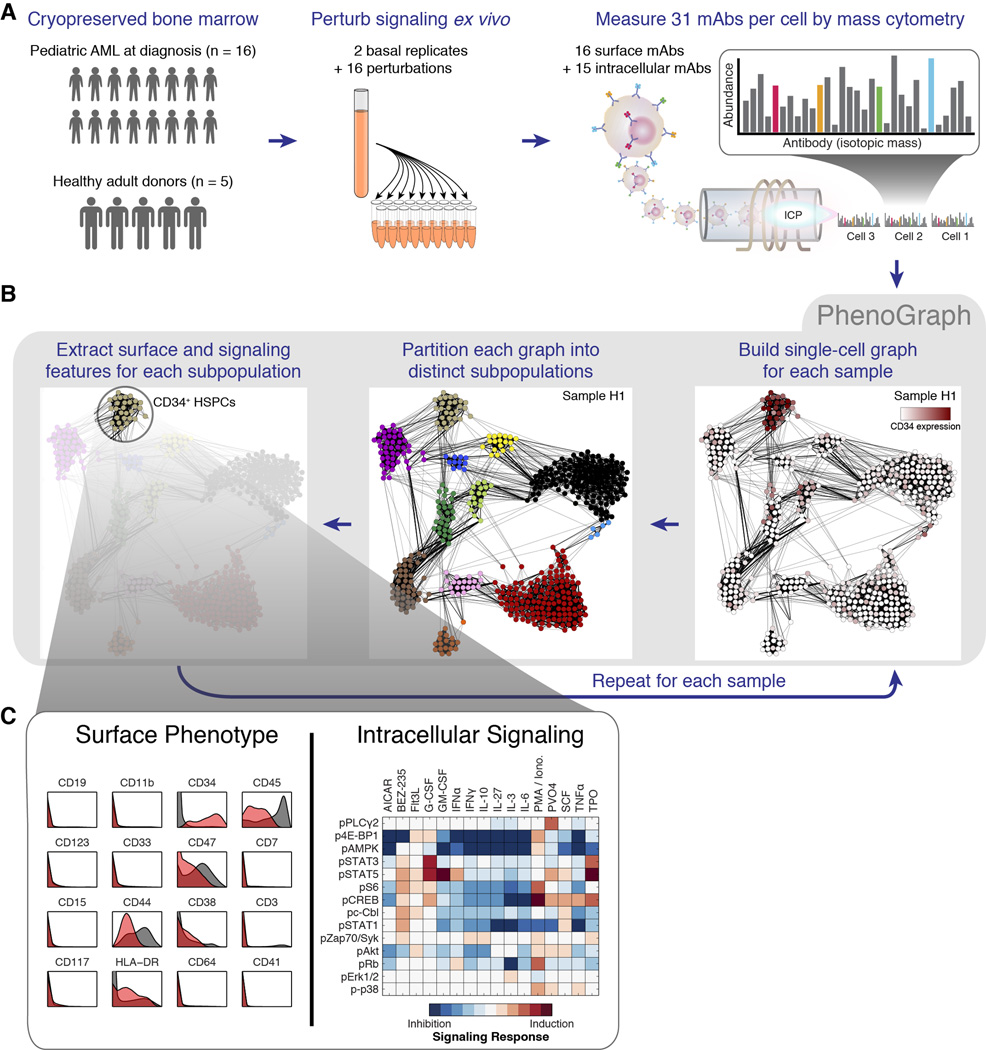
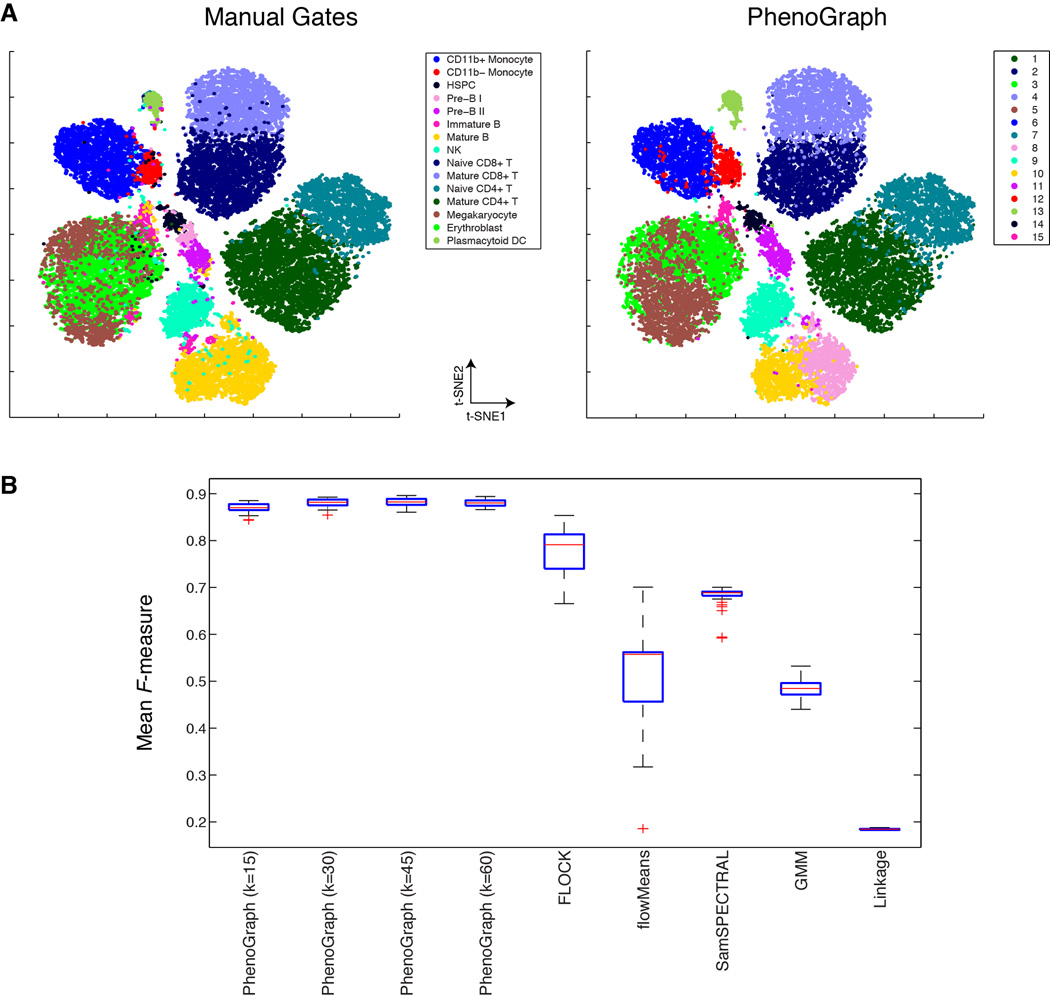
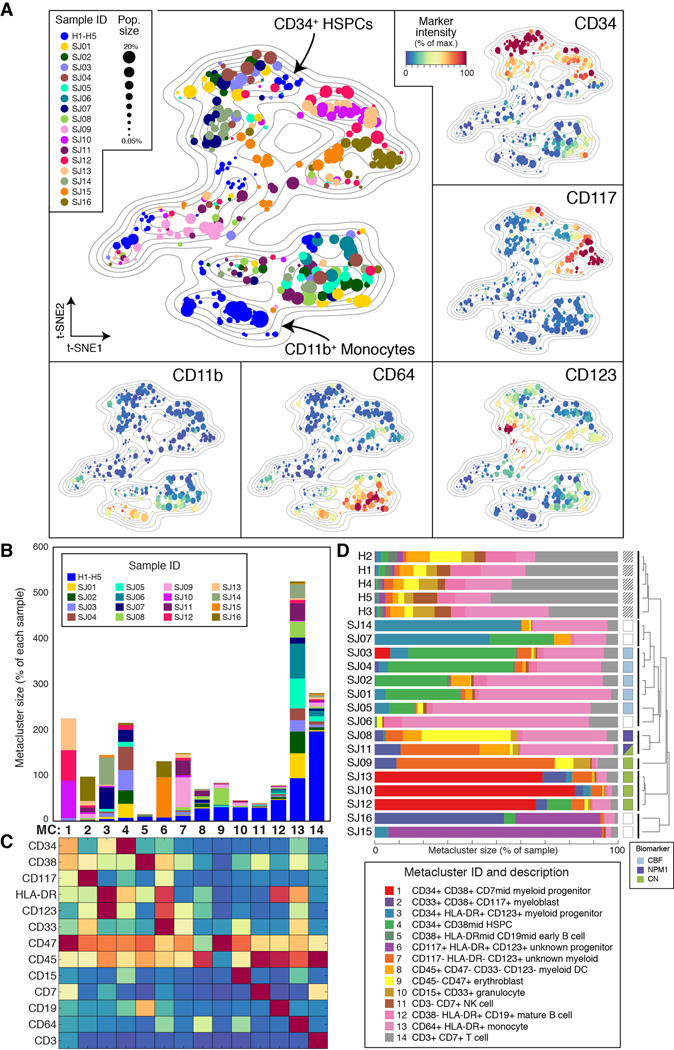
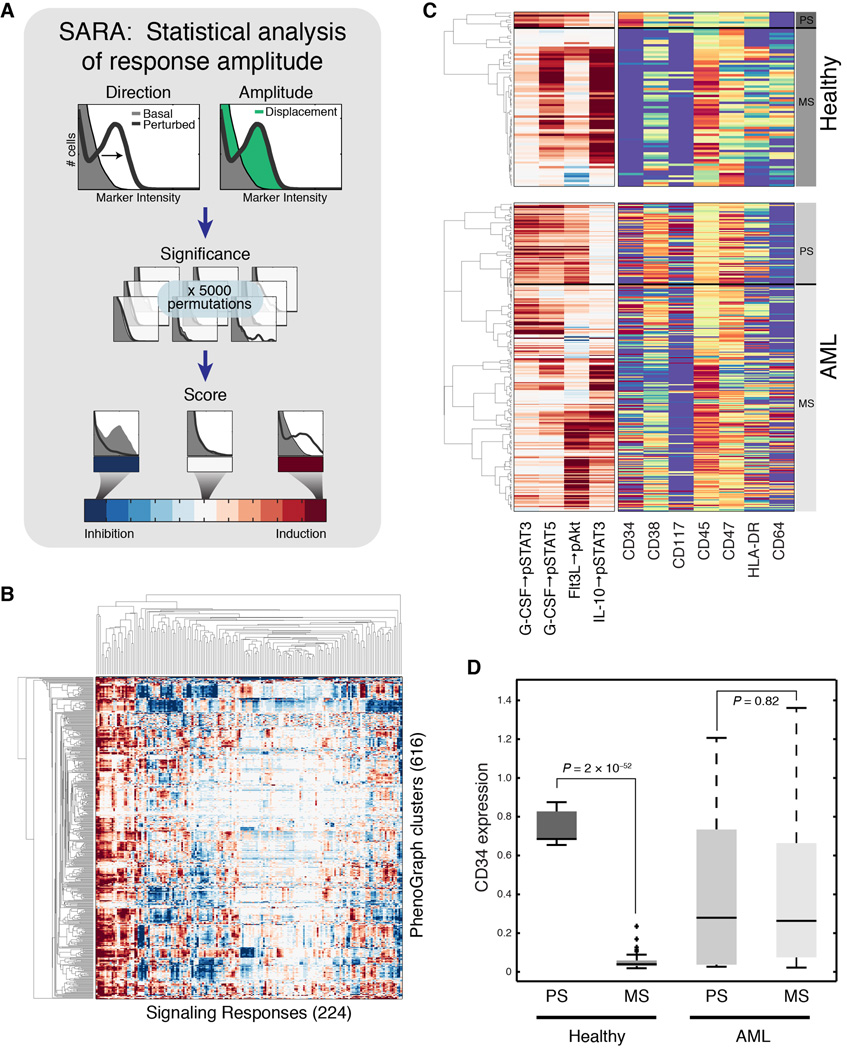
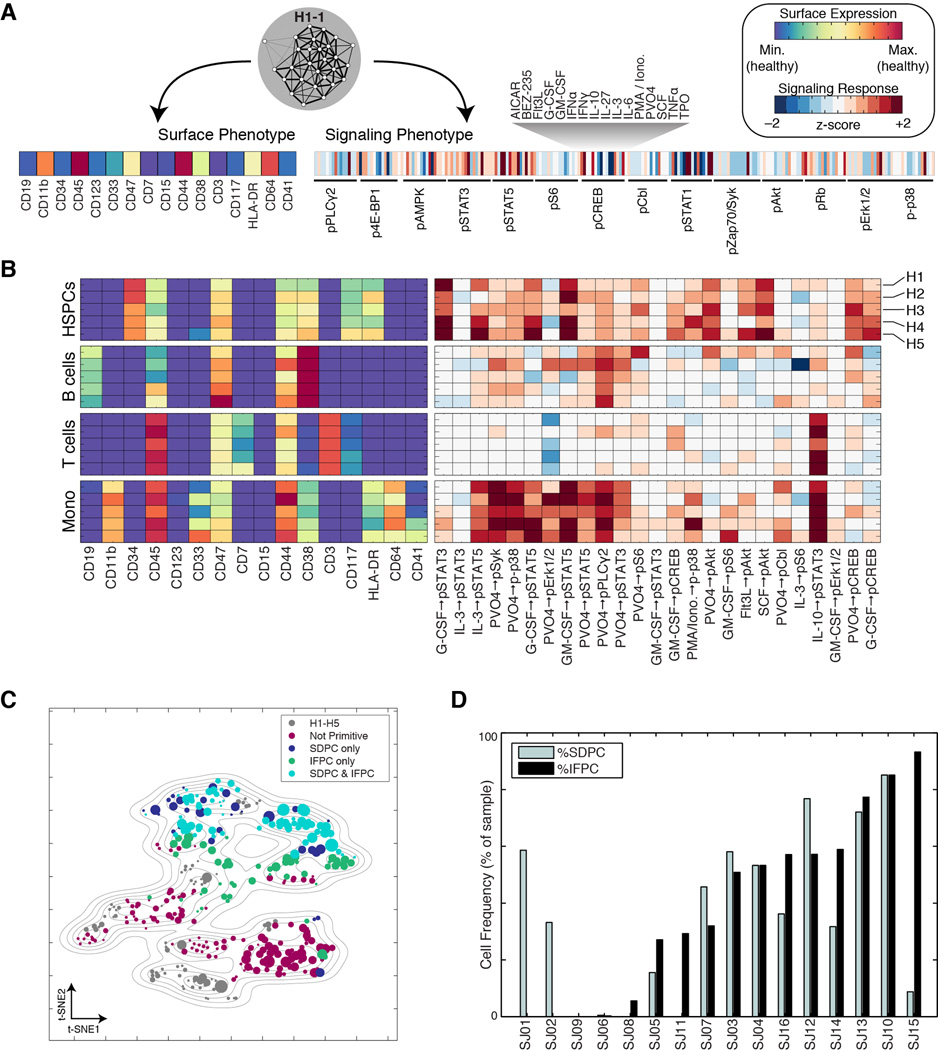
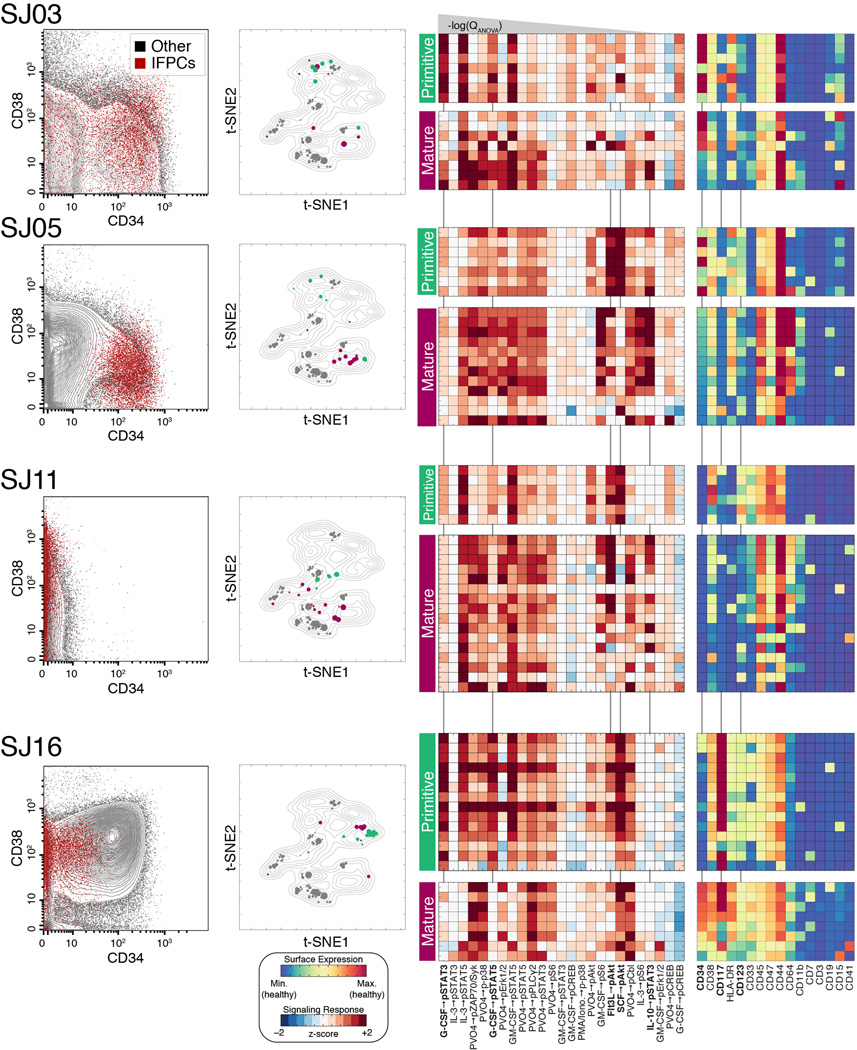
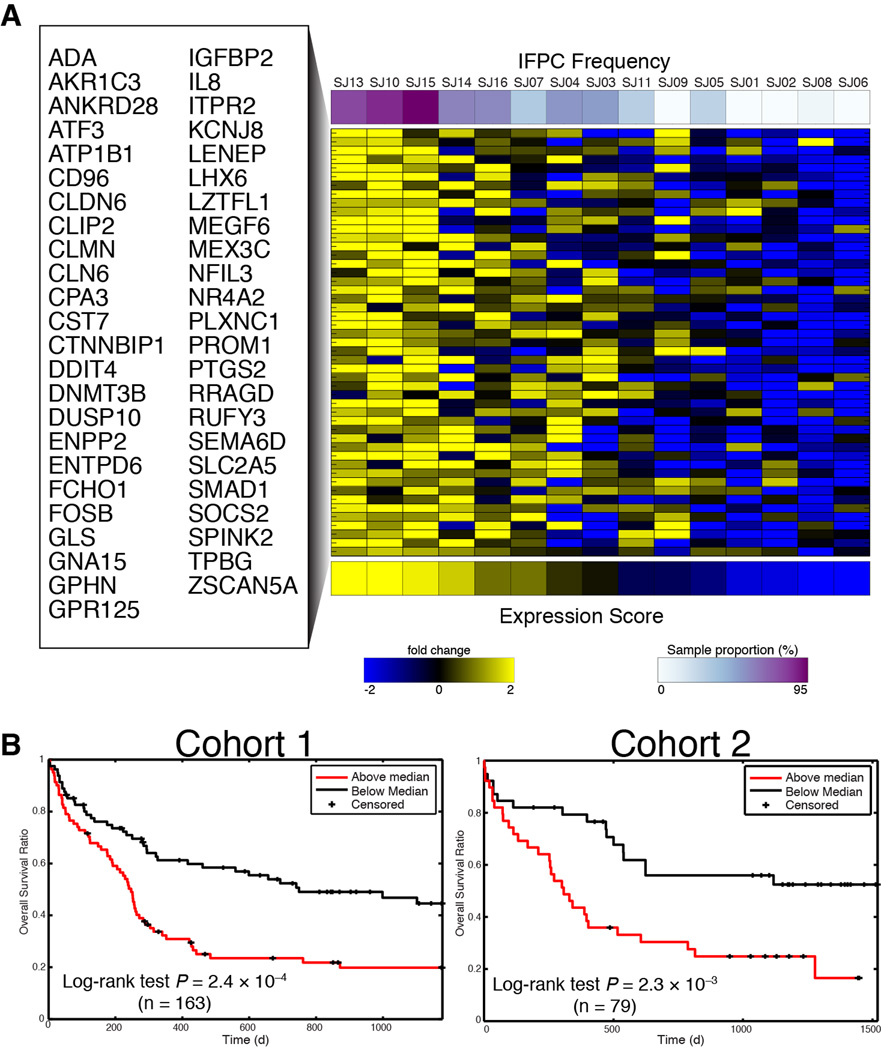
Acute myeloid leukemia (AML) manifests as phenotypically and functionally diverse cells, often within the same patient. Intratumor phenotypic and functional heterogeneity have been linked primarily by physical sorting experiments, which assume that functionally distinct subpopulations can be prospectively isolated by surface phenotypes. This assumption has proven problematic, and we therefore developed a data-driven approach. Using mass cytometry, we profiled surface and intracellular signaling proteins simultaneously in millions of healthy and leukemic cells. We developed PhenoGraph, which algorithmically defines phenotypes in high-dimensional single-cell data. PhenoGraph revealed that the surface phenotypes of leukemic blasts do not necessarily reflect their intracellular state. Using hematopoietic progenitors, we defined a signaling-based measure of cellular phenotype, which led to isolation of a gene expression signature that was predictive of survival in independent cohorts. This study presents new methods for large-scale analysis of single-cell heterogeneity and demonstrates their utility, yielding insights into AML pathophysiology.


Figures

Fig. 1
Fig. 1. Mass cytometry analysis of signaling responses in pediatric acute myeloid leukemia
(A) Summary of experimental design. (B) PhenoGraph method for clustering high-dimensional single-cell data. Each node in the neighbor graph represents one of 500 random cells from healthy donor H1 colored by CD34 expression. CD34+ HSPCs form a dense subgraph and are automatically assigned to a single subpopulation. See Figure S1 and Experimental Procedures for more details on the PhenoGraph algorithm. (C) HSPCs identified by PhenoGraph from donor H1. This subpopulation (red histograms) had a CD34+/CD45low phenotype relative to the other cells in the sample (gray histograms). Each PhenoGraph subpopulation contained cells from all perturbations, permitting analysis of 224 signaling responses.
Fig. 2
Fig. 2. PhenoGraph clustering recapitulates manual assignments of healthy immune cells
(A) viSNE (Amir et al., 2013) display of 30,000 cells from healthy BPMC benchmark data (Bendall et al., 2011). Cells are colored by cell type assignments established by manual gating (left panel) or subpopulations detected by PhenoGraph (right panel). (B) Comparison PhenoGraph to other methods on the benchmark data set, assessed for ability to recover the manual cell type assignments shown in (A, left panel), quantified using the F-measure statistic (Aghaeepour et al., 2013) and normalized mutual information (Fig. S2C). Box plots show the distributions of F-measure computed from 50 random samples of 20,000 cells from the full data set. PhenoGraph was tested with 4 different settings of its single parameter k, small interquartile ranges demonstrate that PhenoGraph accurately identifies the structure of the original population and is robust to random subsampling and its single parameter k. Comparison on additional benchmark datasets is provided in Data S1G–I.
Fig. 3
Fig. 3. Intra- and intertumor heterogeneity is visible across the phenotypic landscape of pediatric AML
(A) t-SNE landscape of average surface marker expression of non-lymphoid PhenoGraph clusters from the AML cohort. Each cluster is represented by a single point scaled to represent its sample proportion and in the main panel colored by patient identity. Normal bone marrow cell types (H1–H5; blue) provide landmarks for interpreting the phenotypes of the leukemic bone marrow samples (SJ01–SJ16). In additional panels each subpopulation is colored by median expression of indicated surface markers. (B) PhenoGraph applied to cluster centroids consolidated the 616 patient-level subpopulations into 14 cohort-level metaclusters (MCs). Stacked columns indicate the contribution made by each patient to each MC. (C) Average surface marker expression in each MC, summarizing the major phenotypes observed across the cohort. Columns match those represented in B. (D) Intrapatient heterogeneity for each patient is represented graphically by a horizontal bar in which segment lengths represent the proportion of the patient assigned to each MC, colored according to the accompanying legend (bottom right). Hierarchical clustering of these patient descriptions revealed that some patterns of intrapatient heterogeneity were significantly correlated with genetic biomarkers. (CBF, core binding transcription factor translocation: P=0.0014; NPM1: P=0.0083, nucleophosmin mutation; CN, cytogenetically normal: P=0.018).
Fig. 4
Fig. 4. Analysis of perturbation response generates signaling phenotypes
(A) A cartoon depicting how SARA uses the single-cell distributions together with permutation testing to score signaling response. (B) SARA, applied to every signaling molecule for every perturbation in every subpopulation, produced ~138,000 responses, which were compiled into 224-dimensional signaling phenotypes for each subpopulation (columns) for each of 616 subpopulations (rows). Rows and columns ordered by agglomerative linkage. (C) Hierarchical clustering of 4 developmentally-relevant signaling responses in the healthy samples (top panel) identified patterns of primitive signaling (PS) and mature signaling (MS) correlated with expression of CD34 and CD45, in the healthy samples. Hierarchical clustering of the same signaling responses in the AML samples (bottom panel) identified a cluster of subpopulations that recapitulated the primitive signaling pattern, but lacked a consistent surface phenotype. Color scales are as in Figures 3A and 4A. (D) Box plots comparing CD34 expression between signaling clusters identified in (C). CD34 expression was significantly associated with primitive signaling only in the healthy samples.
Fig. 5
Fig. 5. Data-driven scoring of leukemic maturity by either surface or signaling phenotype
(A) Each PhenoGraph subpopulation has two alternative phenotypes: surface and signaling (B) Normal cell types identified in healthy samples display characteristic surface and signaling phenotypes, represented by heat maps. Each row represents the indicated cell type. Surface markers (left) and signaling responses (right) are colored as in (A). Signaling responses are ordered from left to right by decreasing significance of association with cell type (Table S2). (C) The same t-SNE map presented in Fig. 3A, labeled by results of PhenoGraph classification. Colors depict whether a subpopulation was assigned to either, both, or neither primitive class as determined IFPC or SDPC; (see Fig. S4A–B). (D) Frequencies of primitive cells: %IFPC or %SDPC for each patient sample.
Fig. 6
Fig. 6. Leukemic subpopulations with primitive signaling exhibit diverse surface phenotypes
Detailed surface and signaling phenotypes of IFPC subpopulations in 4 representative samples. Each row represents a particular patient using a number of visuals. Biaxial dot plots (left) show the CD34/CD38 phenotype of IFPCs (red) in each sample. IFPCs displayed the canonical primitive CD34+/CD38mid phenotype in only a subset of samples. The IFPCs displayed using the t-SNE landscape of Fig. 3A (center; IFPCs in green, non-IFPCs in maroon, healthy cells in gray). Heat maps (right) display the signaling and surface phenotypes of all non-lymphoid subpopulations of each sample, stratified by IFPC classification (indicated by green and maroon bars). Signaling responses are ordered as in Fig. 5B. Signaling responses marked in bold with vertical lines were especially distinctive of IFPCs (see Main Text and Extended Experimental Procedures). See Figure S5A for all patients not shown here.
Fig. 7
Fig. 7. Frequency of IFPCs identifies a gene expression signature that predicts clinical outcome
(A) IFPC gene signature identified by deconvolution of bulk expression data using IFPC frequency. The heat map displays expression of each gene in the bulk measurements. Rows are alphabetically ordered; columns are ordered by the mean expression of the genes in the signature. (B) The mean of the IFPC signature forms a clinically significant prognostic indicator of overall survival in 2 independent cohorts of adult AML (Metzeler et al., 2008). Patients were assigned to groups for Kaplan-Meier analysis based on whether their IFPC expression score was below or above the cohort median. P values obtained from log-rank test.

Comment in

  • From mass cytometry to cancer prognosis.
    Winter DR, Ledergor G, Amit I. Winter DR, et al. Nat Biotechnol. 2015 Sep;33(9):931-2. doi: 10.1038/nbt.3346. Nat Biotechnol. 2015. PMID: 26348963 No abstract available.

References

    1. Aghaeepour N, Finak G, Hoos H, Mosmann TR, Brinkman R, Gottardo R, Scheuermann RH FlowCAP Consortium, DREAM Consortium. Critical assessment of automated flow cytometry data analysis techniques. Nat Methods. 2013;10:228–238. - PMC - PubMed
    1. Akavia U-D, Litvin O, Kim J, Sanchez-Garcia F, Kotliar D, Causton HC, Pochanard P, Mozes E, Garraway LA, Pe'er D. An Integrated Approach to Uncover Drivers of Cancer. Cell. 2010;143:1005–1017. - PMC - PubMed
    1. Amir E-AD, Davis KL, Tadmor MD, Simonds EF, Levine JH, Bendall SC, Shenfeld DK, Krishnaswamy S, Nolan GP, Pe'er D. viSNE enables visualization of high dimensional single-cell data and reveals phenotypic heterogeneity of leukemia. Nat Biotechnol. 2013 - PMC - PubMed
    1. Bendall SC, Davis KL, Amir E-AD, Tadmor MD, Simonds EF, Chen TJ, Shenfeld DK, Nolan GP, Pe'er D. Single-Cell Trajectory Detection Uncovers Progression and Regulatory Coordination in Human B Cell Development. Cell. 2014 - PMC - PubMed
    1. Bendall SC, Simonds EF, Qiu P, Amir E-AD, Krutzik PO, Finck R, Bruggner RV, Melamed R, Trejo A, Ornatsky OI, et al. Single-cell mass cytometry of differential immune and drug responses across a human hematopoietic continuum. Science (New York, NY) 2011;332:687–696. - PMC - PubMed

Publication types