. 2015 Jul 2;162(1):59-71.
doi: 10.1016/j.cell.2015.05.049. Epub 2015 Jun 18.

Differential Requirements for eIF4E Dose in Normal Development and Cancer

Affiliations

Differential Requirements for eIF4E Dose in Normal Development and Cancer

Morgan L Truitt et al. Cell. .

Abstract

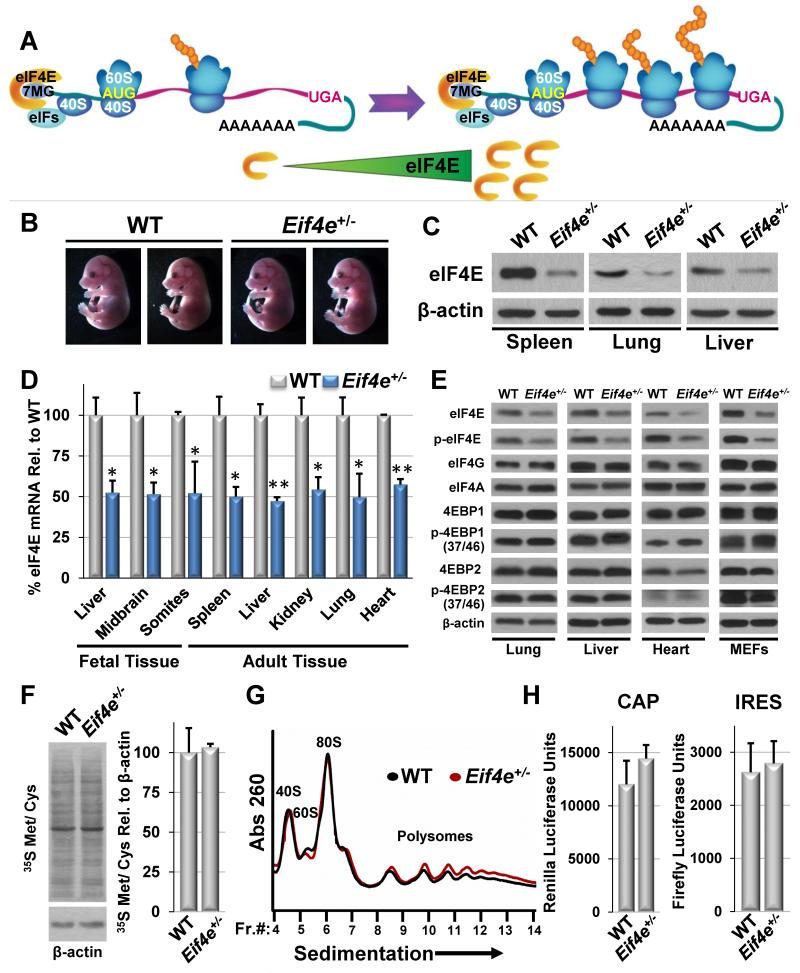
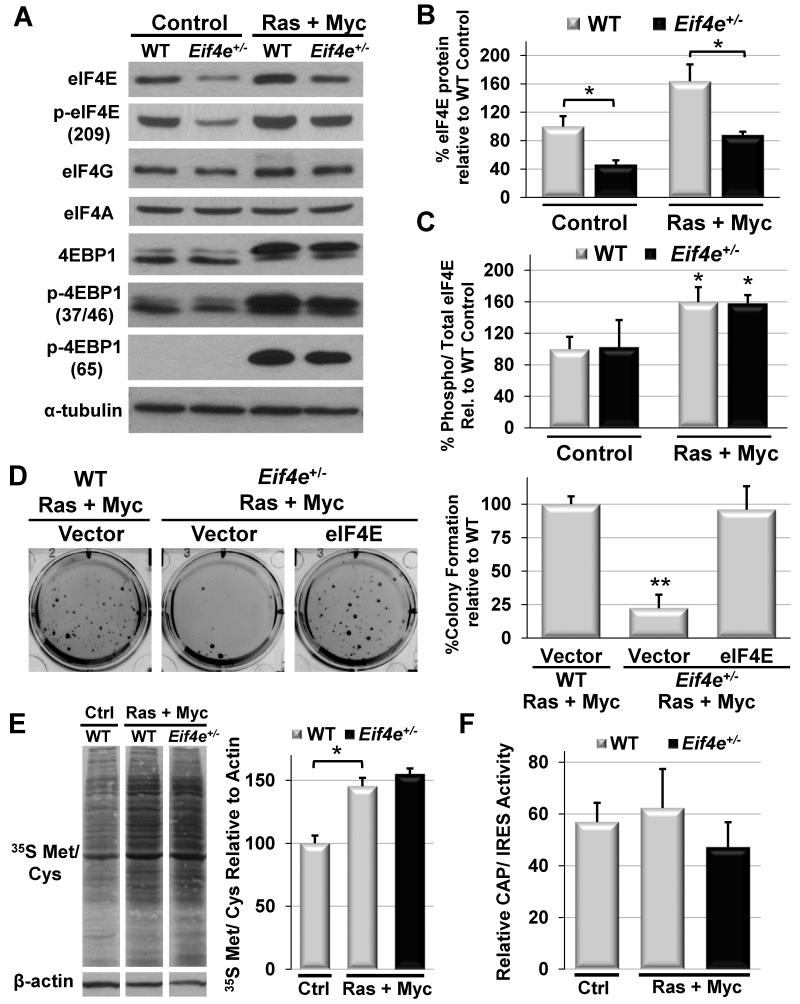
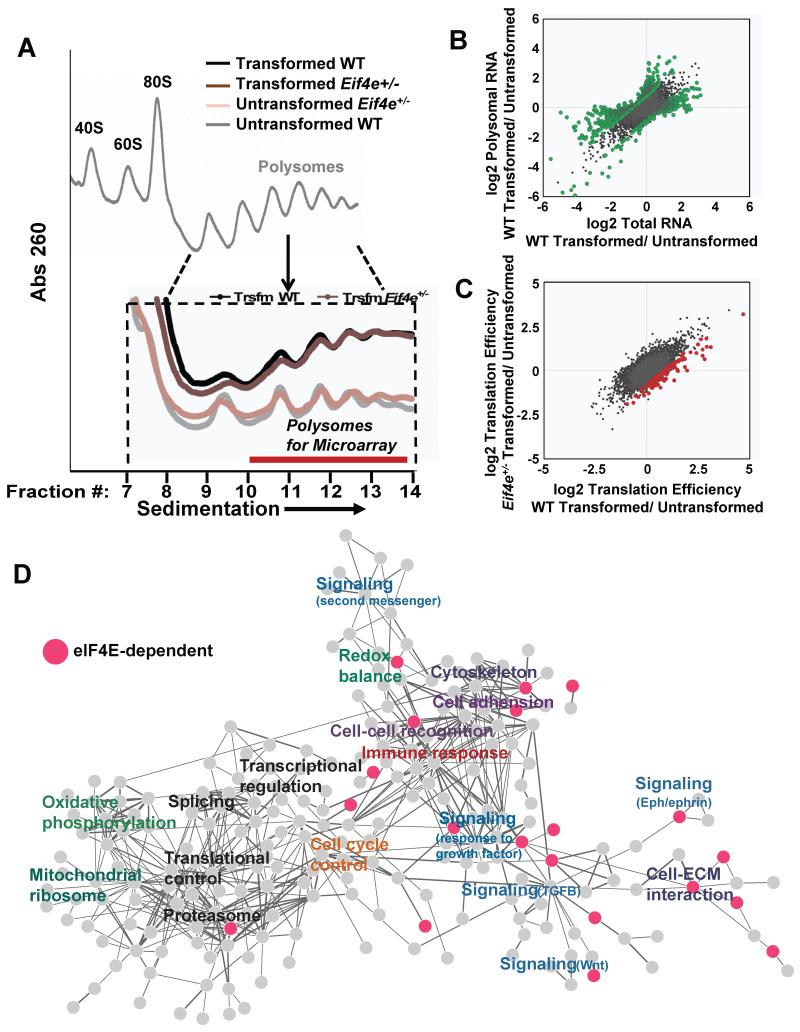
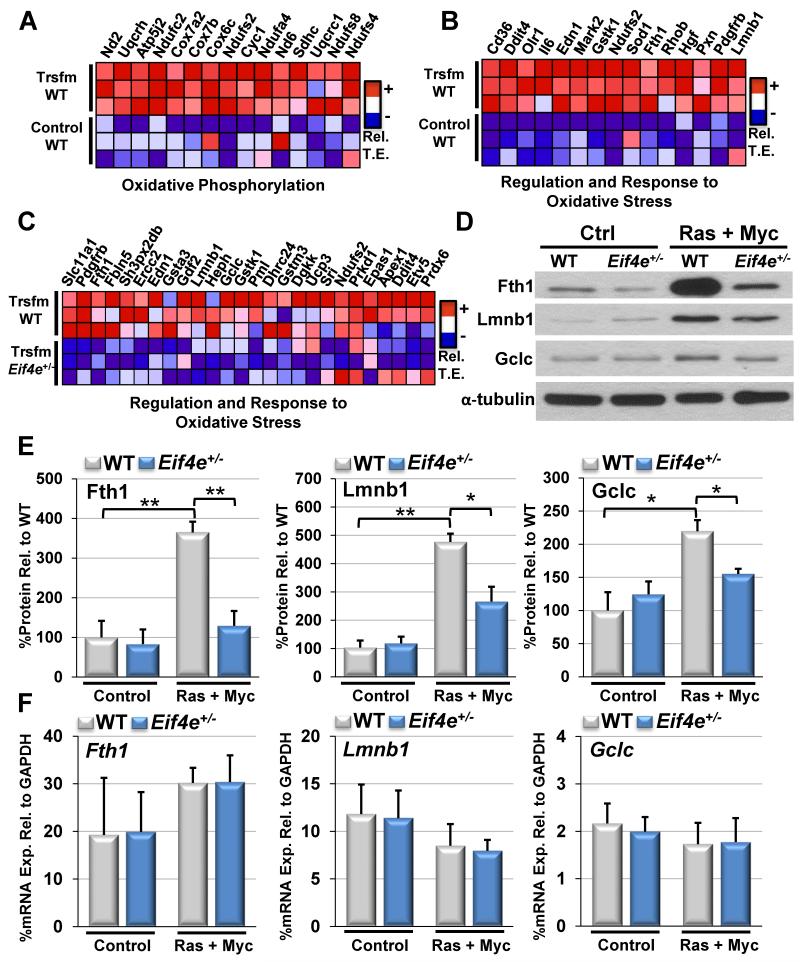
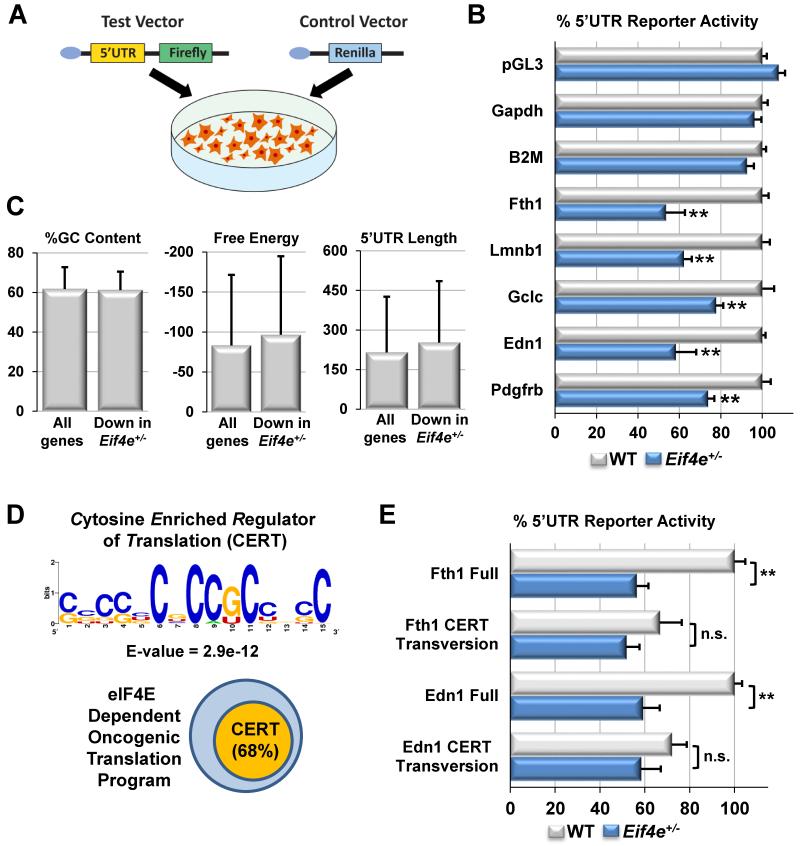
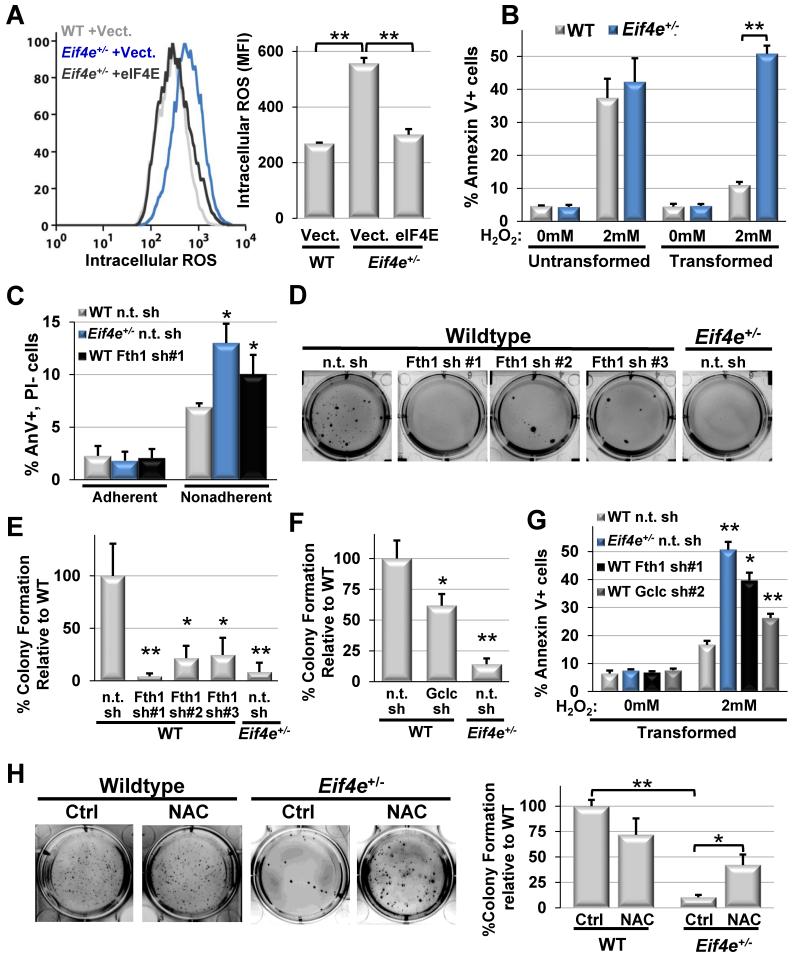
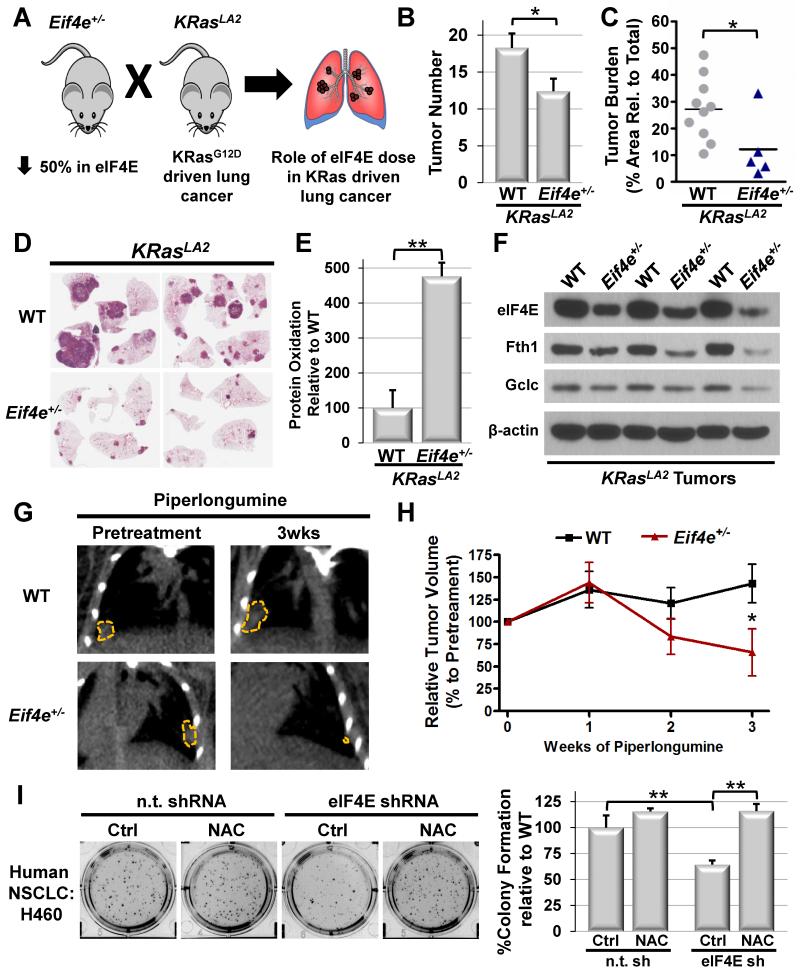
eIF4E, the major cap-binding protein, has long been considered limiting for translating the mammalian genome. However, the eIF4E dose requirement at an organismal level remains unexplored. By generating an Eif4e haploinsufficient mouse, we found that a 50% reduction in eIF4E expression, while compatible with normal development and global protein synthesis, significantly impeded cellular transformation. Genome-wide translational profiling uncovered a translational program induced by oncogenic transformation and revealed a critical role for the dose of eIF4E, specifically in translating a network of mRNAs enriched for a unique 5' UTR signature. In particular, we demonstrate that the dose of eIF4E is essential for translating mRNAs that regulate reactive oxygen species, fueling transformation and cancer cell survival in vivo. Our findings indicate eIF4E is maintained at levels in excess for normal development that are hijacked by cancer cells to drive a translational program supporting tumorigenesis.


Figures

Figure 1
Figure 1. A 50% reduction in eIF4E dose is compatible with normal in vivo development and protein synthesis
A) Cartoon demonstrating the current dogma of eIF4E as quantitatively limiting for protein synthesis. “7MG” denotes the 5′ 7-methylguanosine cap. “eIFs” denotes eukaryotic initiation factors that promotes the association of eIF4E with the 40S ribosomal subunit. B) Gross morphology of WT and Eif4e+/− E15.5 embryos. C) Representative western blots for eIF4E protein levels in adult tissues of mice. D) Quantitative polymerase chain reaction analysis of eIF4E mRNA levels in fetal (E11.5) and adult tissues. E) Representative western blots for eIF4F complex members and regulators in adult tissues and primary MEFs. F) Global protein synthesis measured by 35S methionine/cysteine incorporation in MEFs. G) Representative polysome profiles of WT and Eif4e+/− MEFs. “Fr.#” denotes the fraction number for sucrose gradient fractionation. Lower molecular weight (MW) complexes (40S and 60S) are on the left side of the x-axis and higher MW complexes (polysomes) are on the right. H) Cap and IRES dependent translation measured by luciferase activity in MEFs from the CMV-HCV-IREST reporter mouse. All values represent the mean +SEM. Results are representative of at least three independent experiments. See also Figures S1 and S2.
Figure 2
Figure 2. eIF4E is haploinsufficient for oncogenic transformation
A) Representative western blots for eIF4F complex members and regulators in WT and Eif4e+/− MEFs before and after overexpression of HRasV12 and Myc. B) Quantification of total eIF4E protein levels relative to β-actin and normalized to primary WT MEFs. C) Quantification of eIF4E phosphorylation relative to total eIF4E levels in WT MEFs. D) Soft agar colony formation as a measure of oncogenic transformation upon overexpression of HRasV12 and Myc in WT and Eif4e+/− MEFs with and without eIF4E rescue (average WT vector colony number = 115). E) Global protein synthesis measured by 35S methionine/cysteine incorporation upon transformation in MEFs. F) Relative Cap and IRES luciferase activity in transformed MEFs derived from the CMV-HCV-IREST reporter mouse. Asterisks indicate a statistically significant change (*= p<0.05, **= p<0.01). All values represent the mean +SD. Results are representative of at least three independent experiments. See also Figure S2.
Figure 3
Figure 3. eIF4E is required for expression of the oncogenic translational program
A) Representative polysome profiles of transformed and untransformed WT and Eif4e+/− MEFs separated on a sucrose gradient. Inset highlights the polysomal fractions (10-13) used for translational profiling by polysomal microarray. B) Changes in total RNA and polysome associated RNA in WT MEFs upon oncogenic transformation by HRasV12 and Myc. Green points indicate genes with a fold change in translation efficiency (polysomal/total RNA) greater than 1.7 fold, p<0.05 (See Table S3). C) Changes in translation efficiency (TE) induced by transformation in WT and Eif4e+/− MEFs. Red points indicate genes whose fold change in TE during transformation is reduced in Eif4e+/− MEFs compared to WT MEFs (>1.7 fold decrease in TE, p<0.05) (See Table S2). D) Network-based cluster analysis of genes and associated functional classes whose translation is increased upon transformation in WT MEFs. Pink nodes represent genes whose translation is impaired in transformed Eif4e+/− cells. See also Figure S3,
Figure 4
Figure 4. eIF4E is critical for the translation of distinct functional classes of mRNAs induced by oncogenic transformation
GSEA analysis demonstrating A) enrichment for genes involved in oxidative phosphorylation during cellular transformation (KEGG, FDR<0.01), B) enrichment for a broad class of genes involved in the regulation and response to oxidative stress (see Table S6), during cellular transformation (FDR<0.01), and C) Eif4e+/− MEFs are defective in a subset of translationally regulated genes involved in the regulation and response to oxidative stress during cellular transformation (see Table S6) (FDR <0.01). Each square represents the relative translational efficiency (TE) for a given gene from one individual biological replicate (n=3 per group) with red indicating relatively increased TE and blue indicating decreased TE. Top 15 genes with the highest enrichment scores are shown for A and B and all enriched genes are shown for (C). D) Western blot validation of eIF4E ROS target genes. E) Quantification of eIF4E target protein expression levels. Values represent mean +SEM. F) qPCR analysis of eIF4E target mRNA levels. Values represent mean +SD. Asterisks indicate a statistically significant change from WT samples (*= p<0.05, **= p<0.01). Results are representative of experiments from at least three sets of independently isolated primary and transformed WT and Eif4e+/− cells. See also Figures S4, S5, and S6.
Figure 5
Figure 5. The 5′UTR confers translational sensitivity to eIF4E target mRNAs
A) Diagram of the 5′UTR luciferase reporter assay. B) Requirements for eIF4E in 5′UTR mediated translation of target mRNAs (Fth1, Lmnb1, Gclc, Edn1, and Pdgfrb) and control mRNAs (Gapdh and B2M) by 5′UTR luciferase reporter assay in transformed MEFs. “pGL3” denotes the test vector lacking a 5′UTR. Results are normalized to 5′UTR reporter activity in transformed WT cells. C) Comparison of canonical 5′UTR features between all mouse genes and the subset whose translation efficiency is reduced in Eif4e+/− during oncogenic transformation. D) Consensus sequence and enrichment value (E-value) of the Cytosine Enriched Regulator of Translation (CERT) motif identified by MEME analysis along with a diagram illustrating the frequency of eIF4E target mRNAs containing a CERT. E) Effect of C to G transversion mutations of the CERT domains in Fth1 (+153 nt from 5′cap and −1nt from the ATG) and in Edn1 (+422 nt from the 5′cap and −188nt from the ATG) on 5′UTR luciferase reporter activity in transformed WT and Eif4e+/− MEFs. Results are normalized to non-mutated 5′UTR reporter activity in transformed WT cells. Asterisks indicate a statistically significant change (*= p<0.05, **= p<0.01). “n.s.” = not significant. All values represent the mean +SEM except for (C) which represent mean +SD.
Figure 6
Figure 6. eIF4E-dependent control of reactive oxygen species is critical for cellular transformation
A) CM-H2DCFDA mean fluorescence intensity (MFI) quantification by FACS as a relative measure of intracellular ROS levels in transformed WT and Eif4e+/− MEFs with and without eIF4E rescue. B) Annexin V staining as a measure of apoptosis in response to exogenous ROS (2mM H2O2) in untransformed and transformed MEFs. C) Apoptosis under adherent and non-adherent growth conditions in transformed WT and Eif4e+/− MEFs expressing either a non-targeting (n.t) shRNA or a Fth1 targeting shRNA. D) Soft agar colony formation upon shRNA-mediated knock down (k.d.) of three independent Fth1 shRNAs (average WT n.t. shRNA colony number = 115). E) Quantification of soft agar colony formation in (D). F) Quantification of soft agar colony formation upon shRNA-mediated k.d. of Gclc (average WT n.t. shRNA colony number = 97). G) Annexin V staining in response to the addition of exogenous ROS (2mM H2O2) in transformed WT and Eif4e+/− n.t. shRNA MEFs compared to Fth1 or Gclc shRNA mediated k.d. H) Restoration of soft agar colony forming potential in Eif4e+/− MEFs upon addition of 1mM of the antioxidant N-acetyl cysteine (NAC) (average WT control colony number = 121). Asterisks indicate a statistically significant change from WT samples (*= p<0.05, **= p<0.01). All values represent the mean +SD. Results are representative of at least three independent experiments. See also Figure S7.
Figure 7
Figure 7. eIF4E is required for lung tumorigenesis and regulation of the oxidative stress response in vivo
A) Cartoon outlining experimental mouse crosses used to test the requirements for eIF4E dose during in vivo lung tumorigenesis. B) Counts of superficial KRasLA2 lung tumors in WT KRasLA2 mice (n=11) and Eif4e+/−; KRasLA2 mice (n=10) at 12wks of age. C) Representative cross-section of lungs from 1yr old KRasLA2 mice. D) Quantification of tumor burden in 1yr old KRasLA2 mice (WT n=10 mice; Eif4e+/− n=5 mice). E) Quantification of protein expression for the oxidative stress marker dityrosine in 12wk old lung tumors (WT n=3 tumors, Eif4e+/− n=3 tumors). F) Representative western blots of eIF4E ROS target gene expression in three independent WT KRasLA2 tumors and three independent Eif4e+/−; KRasLA2 tumors. G) Representative micro x-ray computed tomography (μCT) cross sections of established size matched WT and Eif4e+/− tumors from 8mo old KRasLA2 mice prior to and after 3wks of treatment with the ROS inducer piperlongumine (tumors are outlined in yellow). H) Relative tumor volumes of established KRasLA2 tumors followed longitudinally by μCT imaging upon treatment with piperlongumine (WT n=8 tumors, Eif4e+/− n=6 tumors). (I) Soft agar colony formation potential in the H460 human NSCLC line is decreased upon shRNA-mediated k.d. of eIF4E and can be rescued by addition of 0.5mM of the antioxidant NAC (average WT control colony number = 139). Asterisks indicate a statistically significant change (*= p<0.05, **= p<0.01). All values represent the mean +SEM except for (I) which represent mean +SD.

References

    1. Aoki M, Blazek E, Vogt PK. A role of the kinase mTOR in cellular transformation induced by the oncoproteins P3k and Akt. Proceedings of the National Academy of Sciences of the United States of America. 2001;98:136–141. - PMC - PubMed
    1. Bah A, Vernon RM, Siddiqui Z, Krzeminski M, Muhandiram R, Zhao C, Sonenberg N, Kay LE, Forman-Kay JD. Folding of an intrinsically disordered protein by phosphorylation as a regulatory switch. Nature. 2014 - PubMed
    1. Barna M, Pusic A, Zollo O, Costa M, Kondrashov N, Rego E, Rao PH, Ruggero D. Suppression of Myc oncogenic activity by ribosomal protein haploinsufficiency. Nature. 2008;456:971–975. - PMC - PubMed
    1. Bellodi C, Kopmar N, Ruggero D. Deregulation of oncogene-induced senescence and p53 translational control in X-linked dyskeratosis congenita. The EMBO journal. 2010;29:1865–1876. - PMC - PubMed
    1. Blackshear PJ, Stumpo DJ, Carballo E, Lawrence JC., Jr. Disruption of the gene encoding the mitogen-regulated translational modulator PHAS-I in mice. The Journal of biological chemistry. 1997;272:31510–31514. - PubMed

Publication types

Substances

Associated data