. 2015 Jun 22:4:e07166.
doi: 10.7554/eLife.07166.

A Cambrian origin for vertebrate rods

Affiliations

A Cambrian origin for vertebrate rods

Sabrina Asteriti et al. Elife. .

Abstract

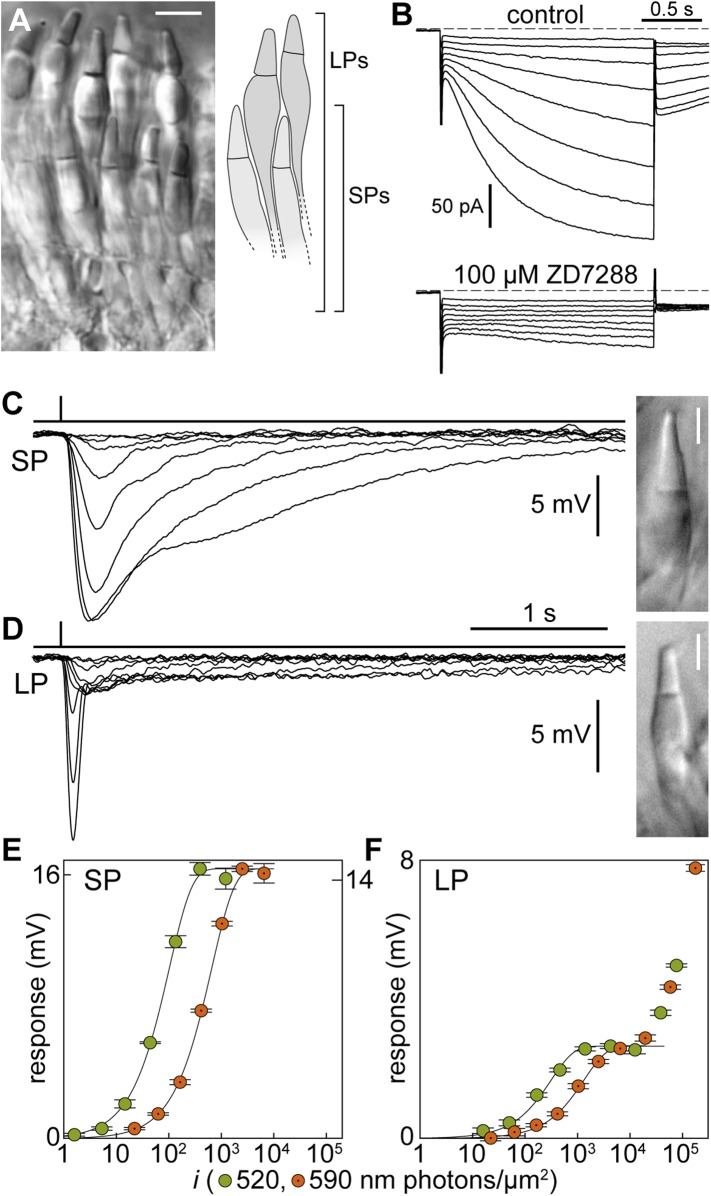
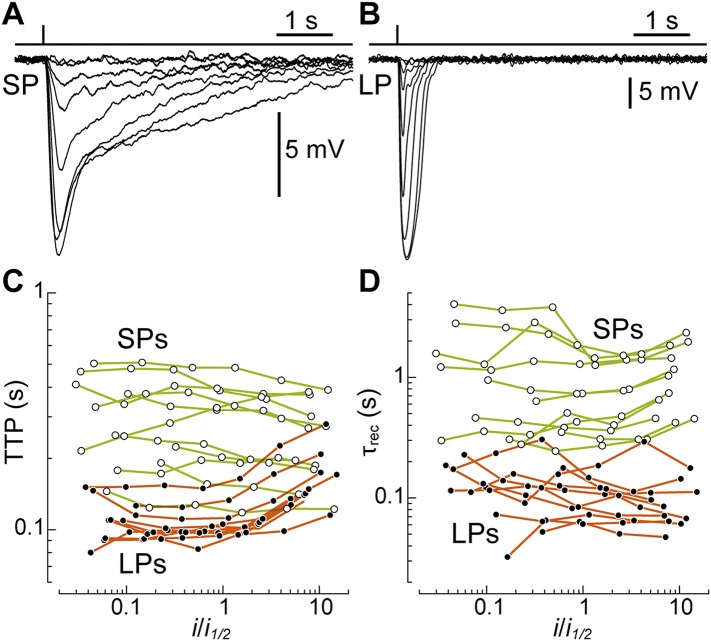
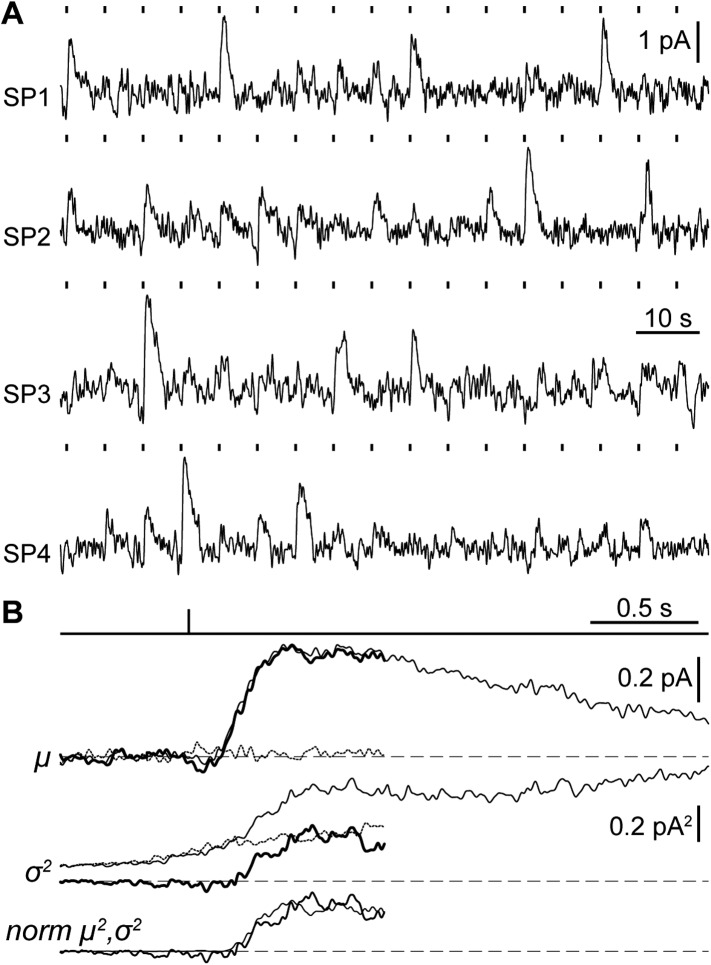
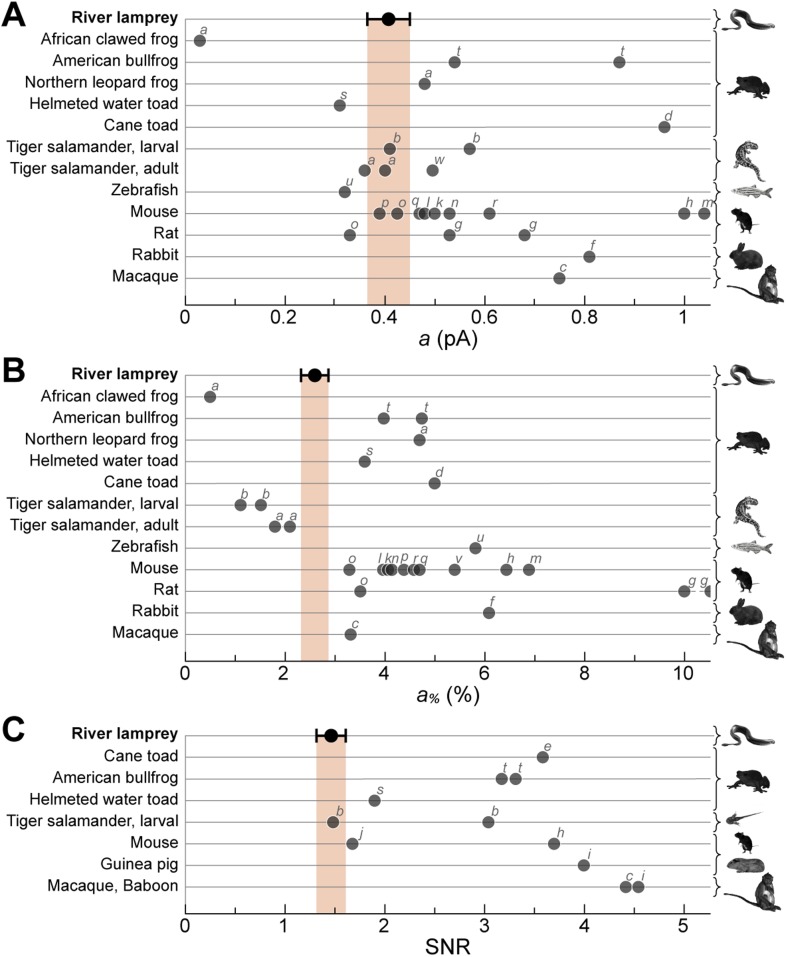
Vertebrates acquired dim-light vision when an ancestral cone evolved into the rod photoreceptor at an unknown stage preceding the last common ancestor of extant jawed vertebrates (~420 million years ago Ma). The jawless lampreys provide a unique opportunity to constrain the timing of this advance, as their line diverged ~505 Ma and later displayed high-morphological stability. We recorded with patch electrodes the inner segment photovoltages and with suction electrodes the outer segment photocurrents of Lampetra fluviatilis retinal photoreceptors. Several key functional features of jawed vertebrate rods are present in their phylogenetically homologous photoreceptors in lamprey: crucially, the efficient amplification of the effect of single photons, measured by multiple parameters, and the flow of rod signals into cones. These results make convergent evolution in the jawless and jawed vertebrate lines unlikely and indicate an early origin of rods, implying strong selective pressure toward dim-light vision in Cambrian ecosystems.

Keywords: evolution; lamprey; neuroscience; photoreceptors; retina; rods.


Conflict of interest statement

The authors declare that no competing interests exist.

Figures

Figure 1.
Figure 1.. Signal processing in the inner segment of lamprey photoreceptors resembles that found in jawed vertebrates.
(A) Image of a live retinal slice showing the layered organization of lamprey photoreceptors: short photoreceptors (SPs) in an inner tier and long photoreceptors (LPs) in an outer tier. Scale bar 10 µm. (B) Photoreceptors express the Ih current: membrane current of a SP in response to hyperpolarizing voltage clamp steps (from a holding potential of −53 mV to −60/−67/−74/−81/−88/−95/−102/−109 mV and repolarization to −65 mV) in control and during superfusion of the Ih blocker ZD7288 at 100 µM. Records are not averages. (CF) Photovoltage responses reveal that SPs feed their signals into LPs. (C and D) Average responses to 520-nm flashes of a SP (0.5, 1.6, 5.4, 15, 45, 136, 398, 1128 photons·µm−2) and a LP (16, 51, 170, 469, 1413, 4314, 12,597, 38,847, 77,695 ph·µm−2). Insets show their outer segments (scale bars 5 µm). (E and F) Response amplitudes to 520-nm (green circles) and 590-nm flashes (orange circles with a dot) of a SP and a LP. Fits are exponential saturation functions (for the LP restricted to the first component: see text). In panel E, left and right ordinate values refer to left and right data sets, respectively, which were adjusted to match saturating amplitudes. In panel F such an adjustment could not be performed. Error bars are SEM. Action spectra templates for SPs and LPs are shown in Figure 1—figure supplement 1. DOI: http://dx.doi.org/10.7554/eLife.07166.003
Figure 1—figure supplement 1.
Figure 1—figure supplement 1.. Predicted action spectra of SPs and LPs and their relative sensitivities at 520 and 590 nm.
(A) 11-cis-Retinal (11A1) based visual pigment templates (Equation 1 in Govardovskii et al., 2000) centered at the absorption peaks of SP (517 nm, green curve) and LP outer segments (555 nm, orange curve) determined previously by microspectrophotometry (Govardovskii and Lychakov, 1984). Small circles indicate, for each of the two photoreceptor types, the normalized sensitivities at our two stimulus wavelengths (520 nm, left vertical line; 590 nm, right vertical line). The predicted sensitivities ratios (520/590 nm) match well with those found in our experiments (see ‘Results’). (B) 9-cis-Retinal (9A1) based visual pigment template for regenerated LPs (peak at 541 nm), obtained from that of red salamander cones (Equation 3 and Table 2 in Makino et al., 1999) by: (i) assuming full replacement of the native chromophore and (ii) introducing a slight hypsochromic shift (1 nm) so as to match our experimentally determined sensitivities at 520 and 590 nm. DOI: http://dx.doi.org/10.7554/eLife.07166.004
Figure 2.
Figure 2.. Lamprey photoreceptors extend telodendrial processes.
An example of a lucifer yellow stain of a live SP showing two thin processes (arrowheads) extending laterally from the synaptic pole into the outer plexiform layer. DOI: http://dx.doi.org/10.7554/eLife.07166.005
Figure 3.
Figure 3.. Visual pigment regeneration reveals the full sensitivity of photoreceptors in the upstream migrating river lamprey.
(A) Photovoltage response amplitudes to 520-nm flashes before (gray circles) and after visual pigment regeneration with 9-cis-Retinal (red circles with a dot) of a SP. Left and right ordinate values refer to left and right data sets, respectively, which were adjusted to match saturating amplitudes. (B) Normalized-averaged-normalized dim-flash photovoltage responses in control (n = 13) and regenerated SPs (n = 9), highlighting the difference in integration time. These records were obtained as follows: (i) the average dim-flash response of each SP was normalized to its peak amplitude (always below 2 mV), (ii) normalized responses were averaged across cells, (iii) the final average was normalized to its peak. Shaded areas show ±1 SEM. (C) Photovoltage response amplitudes to 520-nm flashes before (gray circles) and after visual pigment regeneration with 9-cis-Retinal (red circles with a dot) of a LP. Responses to 590-nm flashes are also shown (small empty circles; error bars are smaller than circle diameter). Error bars are SEM. DOI: http://dx.doi.org/10.7554/eLife.07166.006
Figure 4.
Figure 4.. SPs are markedly slower than LPs.
(A and B) Average responses to 520-nm flashes of a SP (0.5, 1.6, 5.4, 15, 45, 136, 398, 1128 photons·µm−2) and a LP (16, 51, 170, 469, 1413, 4314, 12,597, 38,847, 77,695 ph·µm−2), both recorded with patch clamp after visual pigment regeneration with 9-cis-Retinal. (C and D) Plots of time-to-peak (TTP) and decay time constant (τrec) vs flash strength, normalized to its half-maximal value i1/2, in regenerated SPs (n = 11; empty circles) and LPs (n = 10; full circles). The data from each cell are connected by lines. DOI: http://dx.doi.org/10.7554/eLife.07166.007
Figure 5.
Figure 5.. Suction electrode recordings of SP photocurrents in the single photon regime.
(A) Samples of dim-flash response trains recorded from the outer segments of 4 SPs (SP1: flash strength = 1.64 photons·µm−2, a = 0.25 pA; SP2: 3.26 ph·µm−2, 0.43 pA; SP3: 1.64 ph·µm−2, 0.56 pA; SP4: 3.26 ph µm−2, 0.56·pA). (B) Single photon response analysis from one SP (SP3 in panel A), showing the mean response μ (thin trace: gross mean response, dotted trace: mean dark current, thick trace: net mean response), time-dependent variance σ2 (thin trace: gross variance, dotted trace: dark current variance, thick trace: net variance), normalized squared mean response norm μ2 (thin trace) and variance norm σ2 (thick trace). Dashed lines indicate the current baseline or zero level. Dark current records were taken from the last 2 s preceding each flash and where baselined in the first 1.1 s, therefore, dark and net current records cover up to 0.9 s after the flash (see ‘Materials and methods’). DOI: http://dx.doi.org/10.7554/eLife.07166.008
Figure 6.
Figure 6.. Lamprey SP single photon response parameters in the context of those of jawed vertebrate rods.
River lamprey: this study; Jawed vertebrates: previous studies. (A) Absolute amplitude of the single photon response (a). (B) Fractional amplitude of the single photon response (a%). (C) Signal-to-noise ratio (SNR). Data points shown in the figure were obtained with suction pipette recordings of photoreceptor outer segments. Error bars for lamprey are SEM. Letters next to the data points correspond to the following references: a (Palacios et al., 1998), b (Ala-Laurila et al., 2007), c (Baylor et al., 1984), d (Baylor et al., 1979a, 1979b), e (Baylor et al., 1980), f (Nakatani et al., 1991), g (Robinson et al., 1993), h (Field and Rieke, 2002b), i (Field and Rieke, 2002a), j (Okawa et al., 2010), k (Mendez et al., 2001), l (Burns et al., 2002), m (Azevedo and Rieke, 2011), n (Krispel et al., 2006), o (Luo and Yau, 2005), p (Makino et al., 2004), q (Wen et al., 2009), r (Gross and Burns, 2010), s (Palma et al., 2001), t (Donner et al., 1990), u (Vogalis et al., 2011), v (Nikonov et al., 2006), w (Rieke and Baylor, 2000). DOI: http://dx.doi.org/10.7554/eLife.07166.009

References

    1. Ala-Laurila P, Donner K, Crouch RK, Cornwall MC. Chromophore switch from 11-cis-dehydroretinal (A2) to 11-cis-retinal (A1) decreases dark noise in salamander red rods. The Journal of Physiology. 2007;585:57–74. doi: 10.1113/jphysiol.2007.142935. - DOI - PMC - PubMed
    1. Arnemo R. Ionic composition of some lakes in central sweden. Oikos. 1964;15:44–55. doi: 10.2307/3564747. - DOI
    1. Asteriti S, Gargini C, Cangiano L. Mouse rods signal through gap junctions with cones. eLife. 2014;3:e01386. doi: 10.7554/eLife.01386. - DOI - PMC - PubMed
    1. Attwell D, Borges S, Wu SM, Wilson M. Signal clipping by the rod output synapse. Nature. 1987;328:522–524. doi: 10.1038/328522a0. - DOI - PubMed
    1. Azevedo AW, Rieke F. Experimental protocols alter phototransduction: the implications for retinal processing at visual threshold. The Journal of Neuroscience. 2011;31:3670–3682. doi: 10.1523/JNEUROSCI.4750-10.2011. - DOI - PMC - PubMed

Publication types