. 2015 Jun 22:6:7307.
doi: 10.1038/ncomms8307.

Cancer-associated ASXL1 mutations may act as gain-of-function mutations of the ASXL1-BAP1 complex

Affiliations

Cancer-associated ASXL1 mutations may act as gain-of-function mutations of the ASXL1-BAP1 complex

Anand Balasubramani et al. Nat Commun. .

Abstract

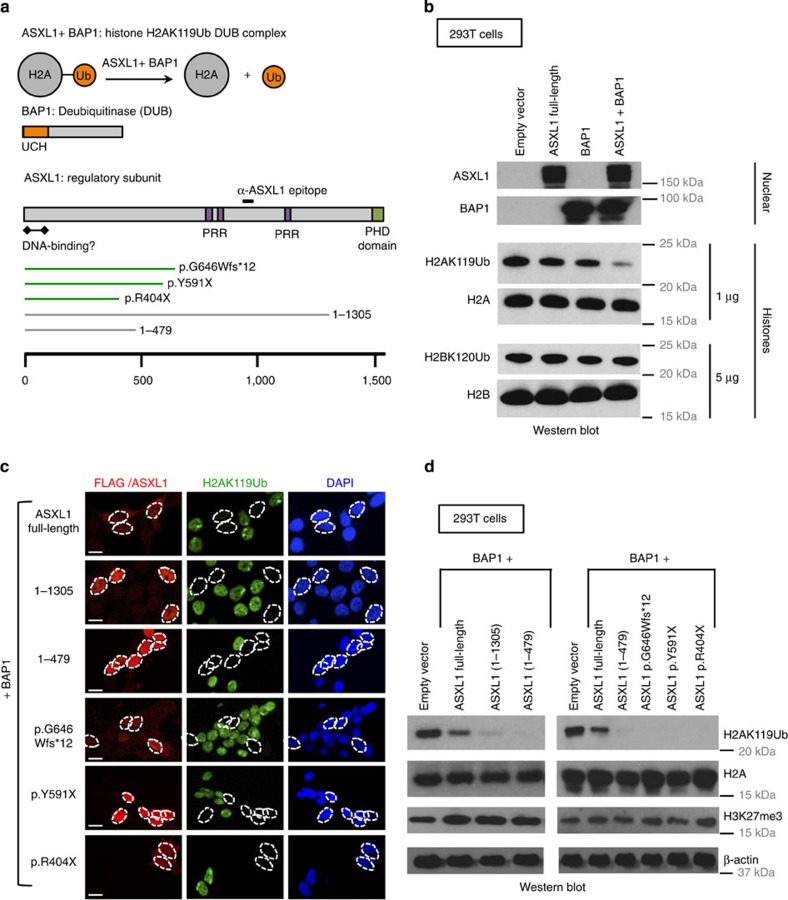
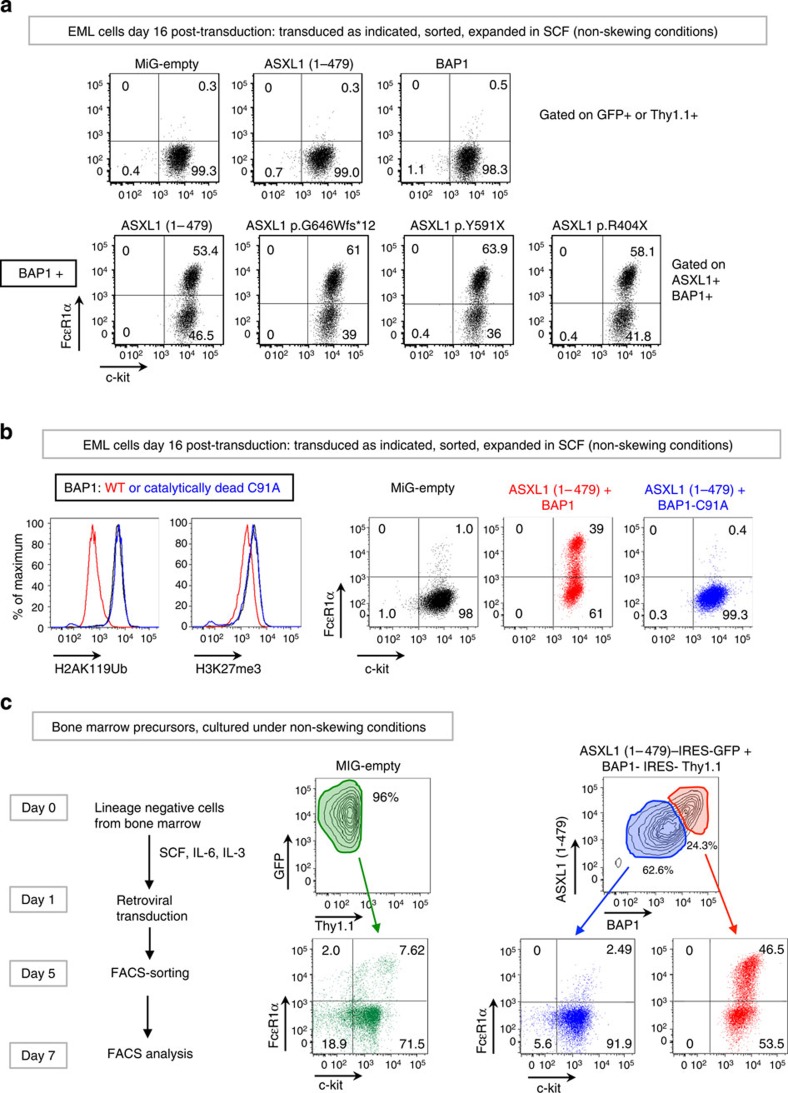
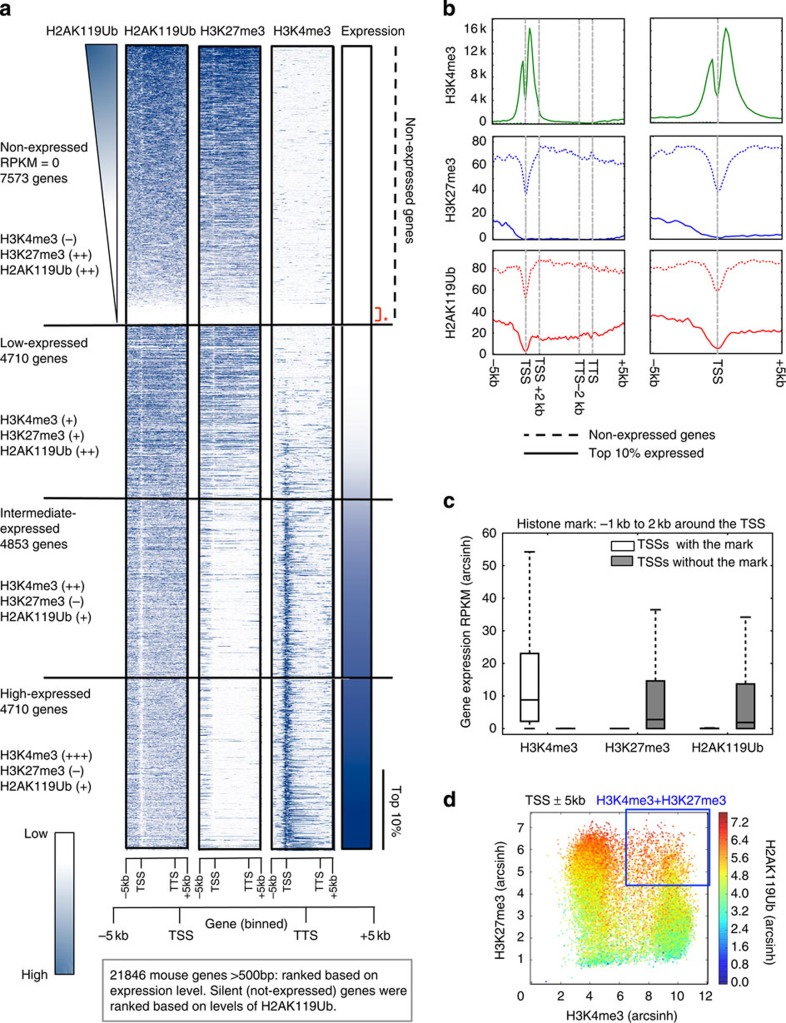
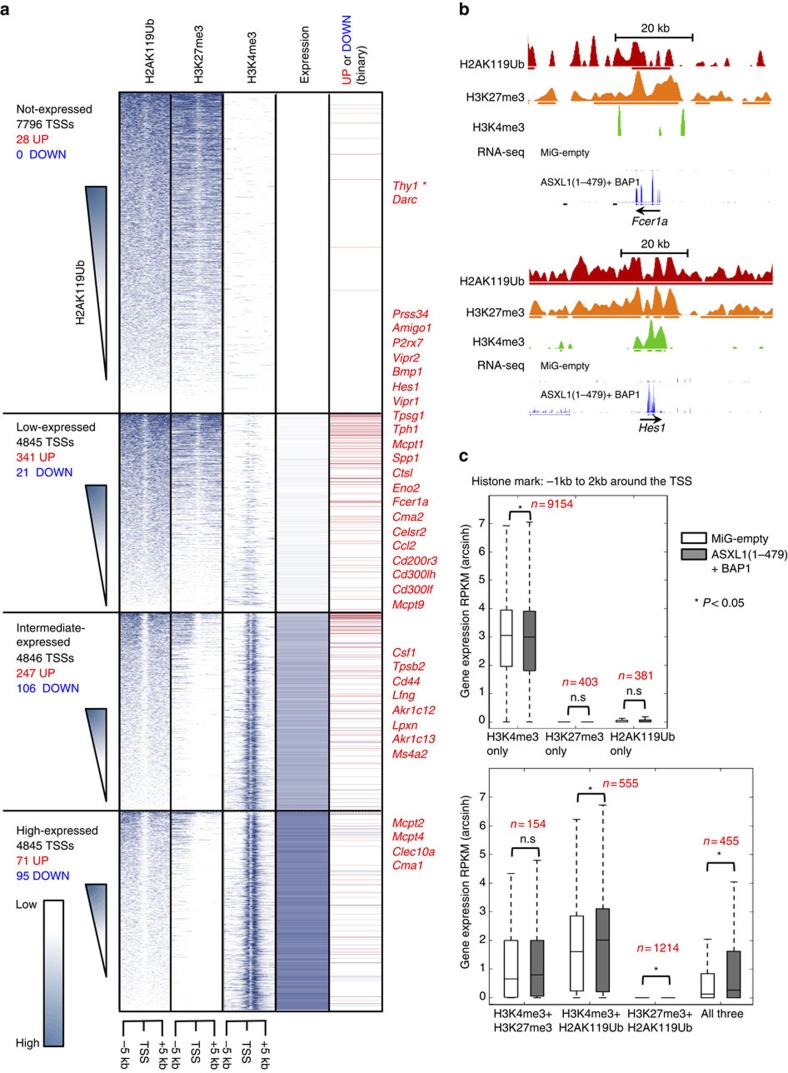
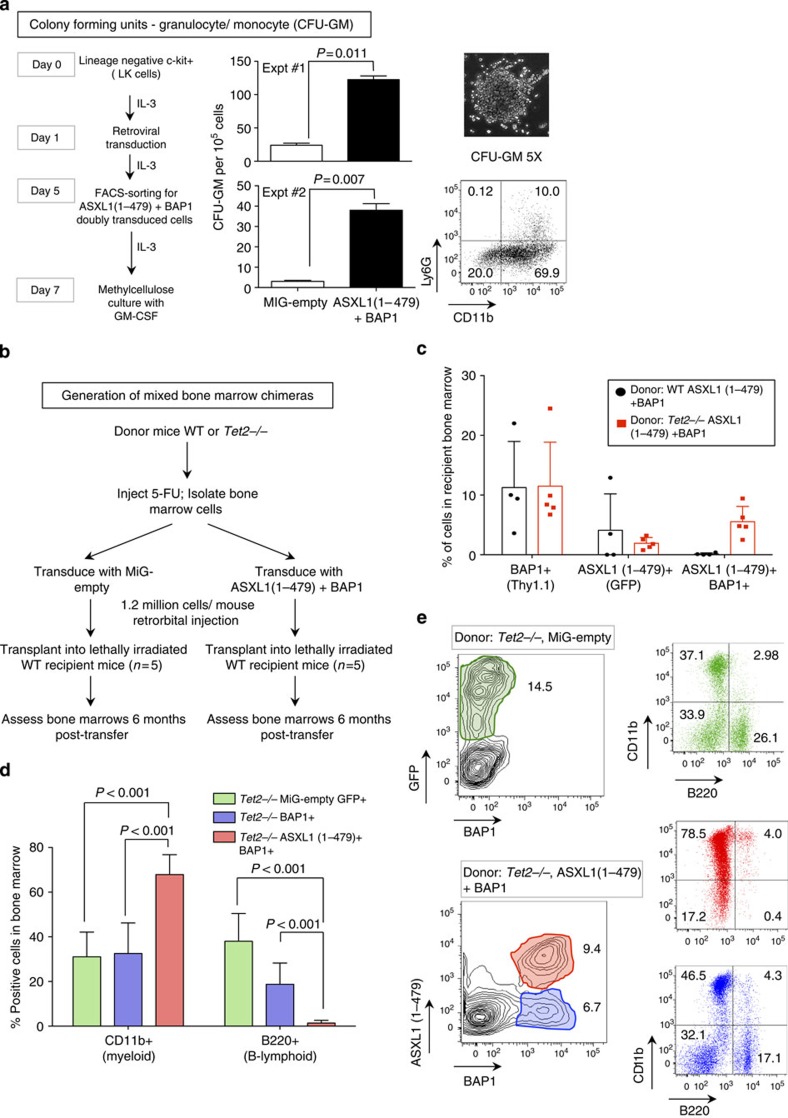
ASXL1 is the obligate regulatory subunit of a deubiquitinase complex whose catalytic subunit is BAP1. Heterozygous mutations of ASXL1 that result in premature truncations are frequent in myeloid leukemias and Bohring-Opitz syndrome. Here we demonstrate that ASXL1 truncations confer enhanced activity on the ASXL1-BAP1 complex. Stable expression of truncated, hyperactive ASXL1-BAP1 complexes in a haematopoietic precursor cell line results in global erasure of H2AK119Ub, striking depletion of H3K27me3, selective upregulation of a subset of genes whose promoters are marked by both H2AK119Ub and H3K4me3, and spontaneous differentiation to the mast cell lineage. These outcomes require the catalytic activity of BAP1, indicating that they are downstream consequences of H2AK119Ub erasure. In bone marrow precursors, expression of truncated ASXL1-BAP1 complex cooperates with TET2 loss-of-function to increase differentiation to the myeloid lineage in vivo. Our data raise the possibility that ASXL1 truncation mutations confer gain-of-function on the ASXL-BAP1 complex.


Figures

Figure 1
Figure 1. Leukemia-associated ASXL1 truncation mutations cooperate with BAP1 to promote deubiquitination of H2AK119Ub.
(a) ASXL1 interacts with BAP1 to form a deubiquitinase complex that acts on H2AK119Ub. ASXL1 is the regulatory subunit of this complex and BAP1 is the deubiquitinase. The ubiquitin-carboxyl hydrolase (UCH) domain of BAP1 is at its N terminus. ASXL1 has a C-terminal atypical PHD Zinc-finger, a putative N-terminal DNA-binding domain and three PRRs that are thought to facilitate protein–protein interactions. Shown below are three cancer-associated ASXL1 mutations and two ASXL1 truncations, ASXL1(1–1305), and ASXL1(1–479), which we have employed in our studies. (b) 293T cells were mock transfected or transfected with mammalian expression vectors encoding BAP1, full-length ASXL1, or both. Expression of ASXL1 and BAP1 was confirmed by western blotting carried out on nuclear lysates. Acid-extracted histones were probed with antibodies against the indicated proteins and histone modifications. As shown, co-transfection of ASXL1+BAP1 results in marked reduction in levels of H2AK119Ub but not H2BK120Ub. (c,d) HEK293T cells were co-transfected with mammalian expression vectors encoding BAP1 with full-length ASXL1 or ASXL1 truncations/mutations as indicated. Western blottings to examine expression of ASXL1 and ASXL1 mutations are shown in Supplementary Fig. 1c. (c) Cells were fixed 48 h post transfection, permeabilized and stained with anti-ASXL1 (red) or anti-FLAG (red) and anti-H2AK119Ub (green) antibodies. Scale bar, 10 μm. (d) Nuclear lysates and acid-extracted histones prepared from transfected cells were subjected to western blotting.
Figure 2
Figure 2. Ectopic expression of ASXL1 truncations+BAP1 results in stable depletion of H2AK119Ub in the EML haematopoietic cell line.
(a) Using retroviral constructs, we generated EML cell lines that stably express ASXL1(1–479), BAP1, or both. A schematic representation of the retroviral constructs is shown to the left. Based on expression of retroviral reporters, green fluorescent protein (GFP) and Thy1.1, EML cells that express either ASXL1(1–479), BAP1, or both were purified by fluorescence-activated cell sorting (FACS). (b,c) EML cells were transduced with the indicated viral constructs, FACS sorted and expanded for 16 days in liquid culture in media supplemented with 100 ng ml−1 SCF. (b) On day 16, nuclear lysates and acid-extracted histones prepared from these cells were subjected to western blotting with indicated antibodies. (c) On day 16, cells were subjected to intracellular staining with anti-H2AK119Ub and anti-H3K27me3 antibodies, and levels of H2AK119Ub and H3K27me3 were determined by flow cytometry. Geometric mean fluorescence intensities (gMFI) of H2AK119Ub and H3K27me3 stains were determined by subtracting gMFIs of no primary antibody controls from the absolute gMFIs. (d) EML cells transduced with either MiG-empty or ASXL1(1–479)+BAP1 were purified by FACS and expanded for 16 days in liquid culture. On day 16, total RNA was isolated, ribosome-depleted and subjected to RNA-seq. Differential expression and statistical significance were determined using DESeq. Highlighted in the plot and the table are genes that are normally expressed in the mast cell lineage that are upregulated in ASXL1(1–479)+BAP1-transduced EML cells.
Figure 3
Figure 3. Co-expression of ASXL1 truncation mutations+BAP1 skews EML and haematopoietic precursor cells to the mast cell lineage.
(a) EML cells were transduced with retroviral constructs as indicated. Cells were sorted based on expression of green fluorescent protein (GFP) and/or Thy1.1, and expanded in media supplemented with 100 ng ml−1 SCF for 16 days post transduction. Commitment to the mast cell lineage was assessed by staining with fluorochrome-conjugated antibodies against c-kit and FcɛR1α. (b) EML cells were transduced with retroviral constructs and sorted and expanded as in a. In the panels to the left, levels of H2AK119Ub and H3K27me3 were assessed by flow cytometry. Additional controls are shown in Supplementary Fig. 3b. In the panels to the right, commitment to the mast cell lineage was assessed as in a. (c) Lineage-negative, c-Kit+ (LK) cells isolated from mouse bone marrow (see Supplementary Fig.3c) were transduced and sorted as indicated and expanded in media containing 50 ng ml−1 SCF, 10 ng ml−1 IL-6 and 10 ng ml−1 IL-3 (non-skewing conditions). Commitment to the mast cell lineage was assessed on day 7 by staining with fluorochrome-conjugated antibodies against c-Kit and FcɛR1α.
Figure 4
Figure 4. H2AK119Ub marks are present at the expressed and non-expressed genes in EML cells.
Mononucleosomes prepared from EML cells transduced with MiG-empty retrovirus were immunoprecipitated with H2AK119Ub, H3K27me3 and H3K4me3 antibodies, and subjected to ChIP-seq. (a) Genes were ranked based on levels of expression. Shown alongside is the genome-wide distribution of H2AK119Ub, H3K27me3 and H3K4me3 marks across the gene body and ±5 kb around the gene body of all genes >500 bp in length. Based on expression levels in EML cells, we categorized genes into four categories: non-expressed, low, intermediate and high expressed. Non-expressed genes were ranked based on levels of H2AK119Ub. Areas around TSS (−5 kbp, 0 bp) and around TTS (0 bp, +5k bp) were both divided into twenty-five 200-bp bins. Gene bodies were divided into 50 bins of equal width. Genes <500 bp were excluded due to visualization artefacts caused by gene binning. (b) Average input-corrected levels of H2AK119Ub, H3K4me3 and H3K27me3 marks across non-expressed genes and top 10% of genes sorted by expression are represented in two formats, across gene body and ±5 kb around the gene (left) and ±5 kb around TSSs (right). (c) Presence of H2AK119Ub, H3K27me3 and H3K4me3 marks was defined based on ≥10% overlap between SICER peak calls and the area −1 kb to +2 kb around the TSSs. RPKM (reads per kilobase per million) values of genes marked by or lacking the said mark are represented as a box showing the 25th, 50th and 75th percentiles, and whiskers extending to 1.5 times interquartile range. (d) To determine the overlaps between TSSs marked by the H2AK119Ub, H3K4me3 and H3K27me3, enrichments of H3K4me3, H2AK119Ub and H3K27me3 were calculated with respect to input signal in 200 bp bins ±5 kb around each TSS. Total enrichment for each TSS was determined by summing the enrichment values of the ±5 kb area; H2AK119Ub enrichement was colour coded as indicated on the right.
Figure 5
Figure 5. Expression of ASXL1(1–479)+BAP1 leads to upregulation of low-expressed and intermediate-expressed genes.
(a) Input-corrected distribution of H2AK119Ub, H3K4me3 and H3K27me3 marks ±5 kb around mouse TSSs divided into fifty 200-bp bins is shown alongside gene expression levels in EML cells transduced with MiG-empty. Genes within each sub-class were arranged in descending order of H2AK119Ub levels. In the column to the far right is a binary representation of change in expression at these gene loci on transduction with ASXL1(1–479)+BAP1; genes upregulated or downregulated >2-fold, (P<0.05, as determined by DESeq) are represented with red and blue lines, respectively. *Thy1 is marked with an asterisk to highlight the fact that BAP1-expressing retrovirus carried Thy1.1 (a variant of Thy1) as the reporter. Names of some upregulated genes (including mast cell-associated genes) are indicated to the right. (b) UCSC browser tracks of H2AK119Ub, H3K27me3 and H3K4me3 marks from MiG-empty-transduced EML cells and RNA-seq tracks from both MiG-empty- and ASXL1(1–479)+BAP1-transduced cells of two mast cell genes Fcer1a and Hes1. The bold lines below the profiles of histone marks represent SICER peak calls. Scale bar, 20 kb. (c) The presence of H2AK119Ub, H3K27me3 and H3K4me3 marks in MiG-empty-transduced EML cells −1 to +2 kb around each TSS was determined based on 10% or greater overlap between SICER peak calls. Mean and range of RPKM (arcsinh-transformed) values of genes marked by combinations of histone marks are represented as box and whisker plots as in c. Statistical significance was determined by two-tailed Mann–Whitney U-test (*P<0.05).
Figure 6
Figure 6. ASXL1 truncations synergize with BAP1 and TET2 loss-of-function to skew commitment to the myeloid lineage in vivo.
(a) Lineage-negative, c-Kit+ (LK) cells isolated from mouse bone marrow and transduced with either MiG-empty or ASXL1(1–479)+BAP1. Transduced cells were expanded in media supplemented with 10 ng ml−1 IL-3, fluorescence-activated cell sorted (FACS) for Thy1.1 and green fluorescent protein (GFP) expression on day 5, and expanded in liquid medium supplemented with 10 ng ml−1 IL-3 till day 7. On day 7, the cells were washed extensively to remove traces of IL-3. Cells (105) were plated in triplicate in 35-mm dishes in methylcellulose medium supplemented with 10 ng ml−1 GM-CSF. Numbers of CFU-GM were counted on day 14. Statistical significance was determined by two-tailed t-test. Representative image and FACS profile of a CFU-GM are shown to the right. (b) 5-FU-treated bone marrow cells were harvested from WT and TET2-deficient donor mice as described in Methods. The donor cells were transduced as indicated 24 h post transduction; 1.2 × 10⁶ cells were transplanted into irradiated recipient mice by intravenous injection. (c) The bone marrow was harvested from recipient mice 6 months post transfer. Transduced cells were identified based on expression of GFP and Thy1.1 reporters. Shown are percentages of BAP1, ASXL1(1–479) and doubly transduced cells in the bone marrows of recipient mice 6 months post transfer. Each dot represents one mouse. (d) Percentages of CD11b (myeloid)- and B220 (B-lymphoid)-positive cells that were transduced with MiG-empty, BAP1 alone or ASXL1(1–479)+BAP1 retroviruses were determined by flow cytometry. Data shown are from recipients that received cells from TET2-deficient donors; percentages represent mean±s.d. from five recipients. Statistical significance was determined by two-tailed t-test; n=5. (e) Representative FACS plots of CD11b- and B220-positive cells in the bone marrow of recipient mice that were transplanted with Tet2−/− bone marrow cells 6 months post transfer.

References

    1. Jurgens G. A group of genes controlling expression of the bithorax complex. Nature 316, 1985 (1985).
    1. Wang H. et al. Role of histone H2A ubiquitination in Polycomb silencing. Nature 431, 873–878 (2004). - PubMed
    1. Kuzmichev A., Nishioka K., Erdjument-Bromage H., Tempst P. & Reinberg D. Histone methyltransferase activity associated with a human multiprotein complex containing the Enhancer of Zeste protein. Genes Dev. 16, 2893–2905 (2002). - PMC - PubMed
    1. Muller J. et al. Histone methyltransferase activity of a Drosophila Polycomb group repressor complex. Cell 111, 197–208 (2002). - PubMed
    1. Czermin B. et al. Drosophila enhancer of Zeste/ESC complexes have a histone H3 methyltransferase activity that marks chromosomal Polycomb sites. Cell 111, 185–196 (2002). - PubMed

Publication types

MeSH terms

Supplementary concepts