

Effect of in-painting on cortical thickness measurements in multiple sclerosis: A large cohort study
- PMID: 26096844
- PMCID: PMC4839289
- DOI: 10.1002/hbm.22875
Effect of in-painting on cortical thickness measurements in multiple sclerosis: A large cohort study
Abstract
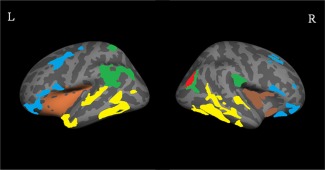
A comprehensive analysis of the effect of lesion in-painting on the estimation of cortical thickness using magnetic resonance imaging was performed on a large cohort of 918 relapsing-remitting multiple sclerosis patients who participated in a phase III multicenter clinical trial. An automatic lesion in-painting algorithm was developed and implemented. Cortical thickness was measured using the FreeSurfer pipeline with and without in-painting. The effect of in-painting was evaluated using FreeSurfer's paired analysis pipeline. Multivariate regression analysis was also performed with field strength and lesion load as additional factors. Overall, the estimated cortical thickness was different with in-painting than without. The effect of in-painting was observed to be region dependent, more significant in the left hemisphere compared to the right, was more prominent at 1.5 T relative to 3 T, and was greater at higher lesion volumes. Our results show that even for data acquired at 1.5 T in patients with high lesion load, the mean cortical thickness difference with and without in-painting is ∼2%. Based on these results, it appears that in-painting has only a small effect on the estimated regional and global cortical thickness. Hum Brain Mapp 36:3749-3760, 2015. © 2015 Wiley Periodicals, Inc.
Keywords: FreeSurfer; cortical thickness; lesion in-painting; multiple sclerosis; multiple sclerosis lesions.
© 2015 Wiley Periodicals, Inc.
Figures


References
-
- Ballester C, Bertalmio M, Caselles V, Sapiro G, Verdera J (2001): Filling‐in by joint interpolation of vector fields and gray levels. IEEE Trans Image Process 10:1200–1211. - PubMed
-
- Bock NA, Hashim E, Janik R, Konyer NB, Weiss M, Stanisz GJ, Turner R, Geyer S (2013): Optimizing T1‐weighted imaging of cortical myelin content at 3.0 T. Neuroimage 65:1–12. - PubMed
-
- Bottomley PA, Foster TH, Argersinger RE, Pfeifer LH (1984): A review of normal tissue hydrogen NMR relaxation times and relaxation mechanisms from 1–100 MHz: Dependence on tissue type, NMR frequency, temperature, species, excision, and age. Med Phys 11:425–448. - PubMed
-
- Calabrese M, Rinaldi F, Mattisi I, Grossi P, Favaretto A, Atzori M, Bernardi V, Barachino L, Romualdi C, Rinaldi L, Perini P, Gallo P (2010): Widespread cortical thinning characterizes patients with MS with mild cognitive impairment. Neurology 74:321–328. - PubMed
Publication types
MeSH terms
Grants and funding
LinkOut - more resources
Full Text Sources
Other Literature Sources
Medical
