. 2015 Jul 13;28(1):82-96.
doi: 10.1016/j.ccell.2015.05.009. Epub 2015 Jun 18.

Inhibition of Spleen Tyrosine Kinase Potentiates Paclitaxel-Induced Cytotoxicity in Ovarian Cancer Cells by Stabilizing Microtubules

Affiliations

Inhibition of Spleen Tyrosine Kinase Potentiates Paclitaxel-Induced Cytotoxicity in Ovarian Cancer Cells by Stabilizing Microtubules

Yu Yu et al. Cancer Cell. .

Abstract

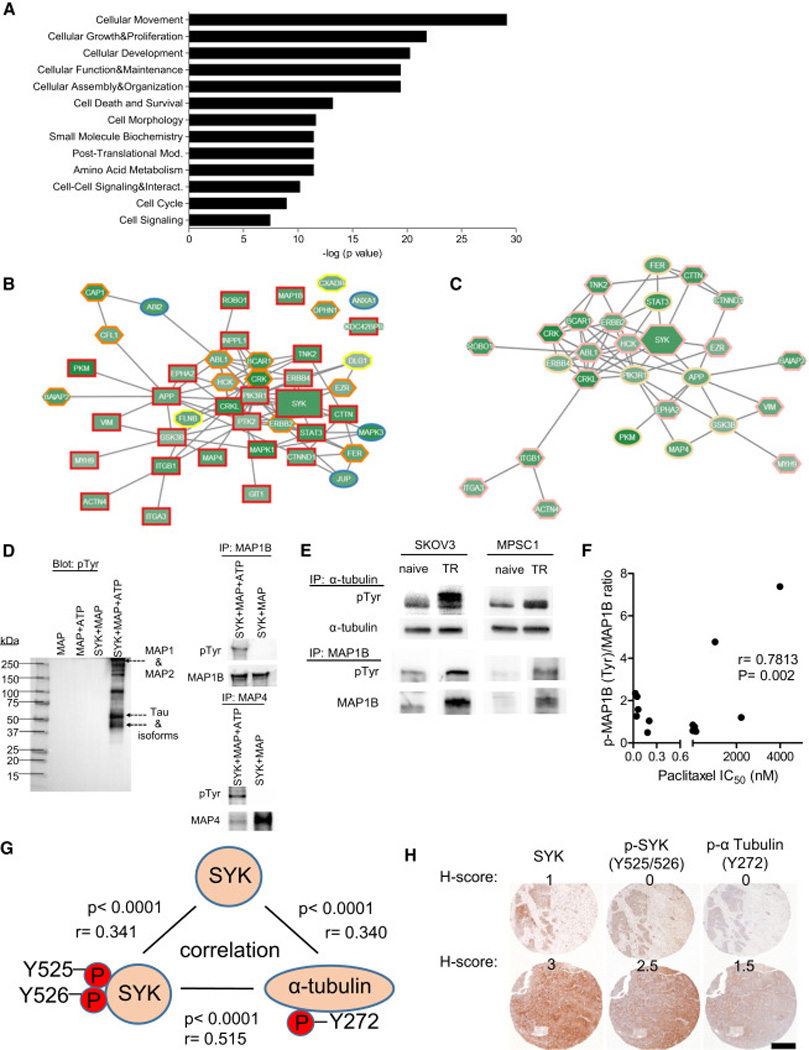
Resistance to chemotherapy represents a major obstacle for long-term remission, and effective strategies to overcome drug resistance would have significant clinical impact. We report that recurrent ovarian carcinomas after paclitaxel/carboplatin treatment have higher levels of spleen tyrosine kinase (SYK) and phospho-SYK. In vitro, paclitaxel-resistant cells expressed higher SYK, and the ratio of phospho-SYK/SYK positively associated with paclitaxel resistance in ovarian cancer cells. Inactivation of SYK by inhibitors or gene knockdown sensitized paclitaxel cytotoxicity in vitro and in vivo. Analysis of the phosphotyrosine proteome in paclitaxel-resistant tumor cells revealed that SYK phosphorylates tubulins and microtubule-associated proteins. Inhibition of SYK enhanced microtubule stability in paclitaxel-resistant tumor cells that were otherwise insensitive. Thus, targeting SYK pathway is a promising strategy to enhance paclitaxel response.


Figures

Figure 1
Figure 1. Expression of SYK and phosphorylated SYK in primary and recurrent ovarian cancers
(A, B) Immunohistochemistry shows levels of SYK (A) and phospho-SYK (p-SYK, Y525/526) (B) in recurrent ovarian high-grade serous carcinomas compared to primary untreated specimens from the same patients based on paired two-tailed t-test (n=23 pairs). H-score is used to semi-quantify the expression levels. The bottom and top of the boxplots represent the first and third quartiles, the band inside the box is the median, and the lines above and below the box indicate the maximum and minimum of all of the data. (C) Correlation of H-scores between total SYK and p-SYK levels. (D) Representative images of p-SYK staining from matched primary and recurrent tumors. Scale bars: approximately 400 µm (top panel) and 40 µm (bottom panels). (E, F) mRNA (E) and protein (F) expression of SYK and p-SYK in SKOV3 and MPSC1 naive and paclitaxel resistant (TR) cells. (G) Pearson correlation analysis between p-SYK/SYK ratio and paclitaxel or carboplatin sensitivity (as determined by IC50) in a panel of primary ovarian cancer cell cultures (red) and cell lines (black). Results are shown as ± SEM. See also Figure S1 and Table S1.
Figure 2
Figure 2. SYK knockdown or SYK inhibitor reduces ovarian cancer cell growth
(A) Immunoblot shows SYK knockdown efficiency 48 hr after transduction with lentivirus expressing SYK shRNAs as compared to control shRNA (pLKO.1). GAPDH is the loading control. Cell numbers are determined daily. ** p< 0.01; *** p< 0.001 as determined by two-way ANOVA with Bonferroni posttests. (B) Western blot analysis of SKOV3 tumor spheroids 48 hr after R406 (2.5 µM) treatment. (C) The effect of R406 on cellular proliferation. (D) Immunoblot shows SYK expression levels in indicated cell lines. (E) R406 IC50 in cells with or without detectable SYK expression (paired t-test). The bottom and top of the boxplots represent the first and third quartiles, the band inside the box is the median, and the lines above and below the box indicate the maximum and minimum of all of the data. (F) Spearman correlation analysis between SYK expression levels and R406 IC50 values. Results are shown as ± SEM. See also Figure S2.
Fig. 3
Fig. 3. Combination of SYK inhibitor and paclitaxel produces a synergistic cytotoxicity
(A) Logarithmic combination index plot of R406 (2.5 µM) is generated in combination with paclitaxel, docetaxel or carboplatin in paclitaxel-resistant SKOV3TR cells. (B) Cell viability assay in SKOV3TR cells treated with paclitaxel and R406 at indicated concentrations. (C) Structures of SYK inhibitors used in the study. (D) Heatmaps of cell viability after treatment with paclitaxel or combination of SYK inhibitor and paclitaxel in primary ovarian cancer cells and cell lines. PT: paclitaxel; R: R406; P: P505-15/PRT062607; G: GS-9973. Blue to red: cell viability from low to high. (E, F) Dose response curves showing the effect of addition of R406 to paclitaxel in paclitaxel resistant cells as compared to naive SKOV3 cells (E) or MPSC1 cells (F). Results are shown as ± SEM. See also Figure S3.
Figure 4
Figure 4. Combination of paclitaxel and R406 decreases tumor growth in mice. (A–C)
Tumor weights (A) BrdU incorporation into tumors (B) and representative tumor bearing mice (C) of the SKOV3c.2 subcutaneous tumor model treated as indicated. Tumor weights are plotted and analyzed by one-way ANOVA followed by Tukey’s post hoc test. (D) The growth of intraperitoneal SKOV3Luc tumors in vehicle treated (vehicle-1 and −2) and in paclitaxel treated (paclitaxel-1 and −2) mice. Paclitaxel IC50 of the tumors from the 4 mice was determined in individual primary cultures. (E) Mice injected intraperitoneally with cells isolated from the paclitaxel-1 tumor were treated as indicated and the luminescence signals were analyzed by two-way ANOVA with Bonferroni posttests. (F) The luminescence of the intraperitoneal SKOV3Luc tumor xenografts from different treatment groups at the indicated week. ** p< 0.01; *** p< 0.001. Results are shown as ± SEM. See also Figure S4.
Figure 5
Figure 5. Phosphoproteomic analyses identify SYK substrates including those involved in organization of cytoskeleton
(A) Ingenuity Pathway Analysis showing cellular functions participate by phosphoproteins downregulated by R406. (B) Interactome network shows that phosphoproteins downregulated by R406 are largely involved in in regulating microtubule dynamics and organizing actin cytoskeleton. The rectangle nodes with red borders: microtubules dynamics; the octagon nodes with yellow border: organization of actin cytoskeleton; and the hexagon nodes with orange borders: organization of microtubules dynamics and the organization of actin cytoskeleton. The lines between nodes are known protein-protein interactions in the PPI database. (C) Interactome network of phosphoproteins involved in microtubule stabilization. Ellipse nodes represent proteins that stabilize microtubules. The lines between nodes are known protein-protein interactions in the PPI database. (D) In vitro kinase assay using recombinant active SYK and purified bovine microtubule associated protein (MAP). Immunoprecipitation was used to enrich MAP1B and MAP4. (E) Tyr-phosphorylated (pTyr) and total α-tubulin and MAP1B in naive and paclitaxel resistant (TR) SKOV3 and MPSC1 cells. (F) Pearson correlation analysis between Tyr-phosphorylated MAP1B/MAP1B ratio and sensitivity to paclitaxel in a panel of ovarian cancer cell lines. (G) Correlation between the levels of total and phospho-SYK and phospho-tubulin (Y272) using immunohistochemistry in 161 ovarian carcinomas. (H) Representative images of SYK, phospho-SYK (Y525/526) and phospho-α tubulin (Y272) immunostaining. Scale bar: approximately 400 µm. See also Figure S5 and Tables S2 and S3.
Figure 6
Figure 6. Effects of ectopic SYK expression on paclitaxel sensitivity and tyrosine phosphorylation of MAP1B and MAP4 in SKOV3
(A) Western blot analysis shows expression of ectopic SYK-WT and SYK-130E with and without induction. (B) Paclitaxel IC50 in cells expressing ectopic SYK-WT and SYK-130E as compared to non-induced cells (+Tet). * p< 0.05; ** p< 0.01 as determined by one-way ANOVA with Tukey’s post hoc test. (C) MAP1B and MAP4 tyrosine phosphorylation in SYK-130E expressing cells. Results are shown as mean ± SEM. See also Figure S6.
Figure 7
Figure 7. Combination of SYK inhibitor and paclitaxel results in microtubule stabilization in paclitaxel resistant ovarian cancer cells
(A) Immunoblottings of acetyl or detyrosinated tubulin after treatment with DMSO, R406 (2.5 µM), paclitaxel (30 nM), or a combination of R406 (2.5 µM) and paclitaxel (30 nM) in indicated cell lines. (B) Immunoblotting analysis of acetyl-α tubulin in tumor xenografts (two representative tumors from each group) comparing combination of R406 and paclitaxel to vehicle or single agents. Statistical significance is determined by one-way ANOVA with Tukey’s post hoc test. *** p< 0.001 (C, D) FRAP assay analysis of mobility fraction between the group treated with paclitaxel and the group co-treated with R406 and paclitaxel in SKOV3 cells (C) and SKOV3TR cells (D). Mobility fraction and T1/2 were analyzed by one-way ANOVA with Tukey’s post hoc test. * p< 0.05; ** p< 0.01; *** p<0.001. Results are shown as ± SEM. See also Figure S7.

Comment in

References

    1. Abubaker K, Luwor RB, Escalona R, McNally O, Quinn MA, Thompson EW, Findlay JK, Ahmed N. Targeted Disruption of the JAK2/STAT3 Pathway in Combination with Systemic Administration of Paclitaxel Inhibits the Priming of Ovarian Cancer Stem Cells Leading to a Reduced Tumor Burden. Front Oncol. 2014;4:75. - PMC - PubMed
    1. Ahmed AA, Wang X, Lu Z, Goldsmith J, Le XF, Grandjean G, Bartholomeusz G, Broom B, Bast RC., Jr Modulating microtubule stability enhances the cytotoxic response of cancer cells to Paclitaxel. Cancer research. 2011;71:5806–5817. - PMC - PubMed
    1. Braselmann S, Taylor V, Zhao H, Wang S, Sylvain C, Baluom M, Qu K, Herlaar E, Lau A, Young C, et al. R406, an orally available spleen tyrosine kinase inhibitor blocks fc receptor signaling and reduces immune complex-mediated inflammation. J Pharmacol Exp Ther. 2006;319:998–1008. - PubMed
    1. Buchner M, Fuchs S, Prinz G, Pfeifer D, Bartholome K, Burger M, Chevalier N, Vallat L, Timmer J, Gribben JG, et al. Spleen tyrosine kinase is overexpressed and represents a potential therapeutic target in chronic lymphocytic leukemia. Cancer Res. 2009;69:5424–5432. - PubMed
    1. Chang W, Gruber D, Chari S, Kitazawa H, Hamazumi Y, Hisanaga S, Bulinski JC. Phosphorylation of MAP4 affects microtubule properties and cell cycle progression. J Cell Sci. 2001;114:2879–2887. - PubMed

Publication types

MeSH terms

Substances

LinkOut - more resources