Review
. 2015 Aug;53(8):547-60.
doi: 10.1002/dvg.22869. Epub 2015 Jul 8.

Cross-organism analysis using InterMine

Affiliations
Review

Cross-organism analysis using InterMine

Rachel Lyne et al. Genesis. 2015 Aug.

Abstract

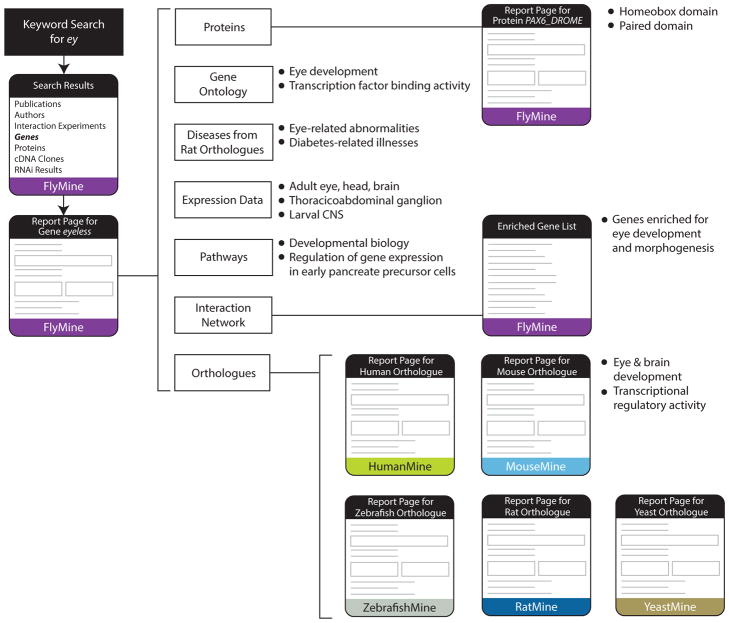
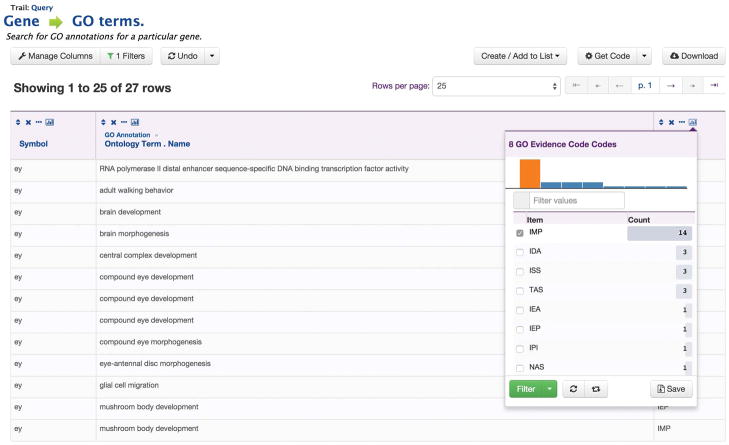
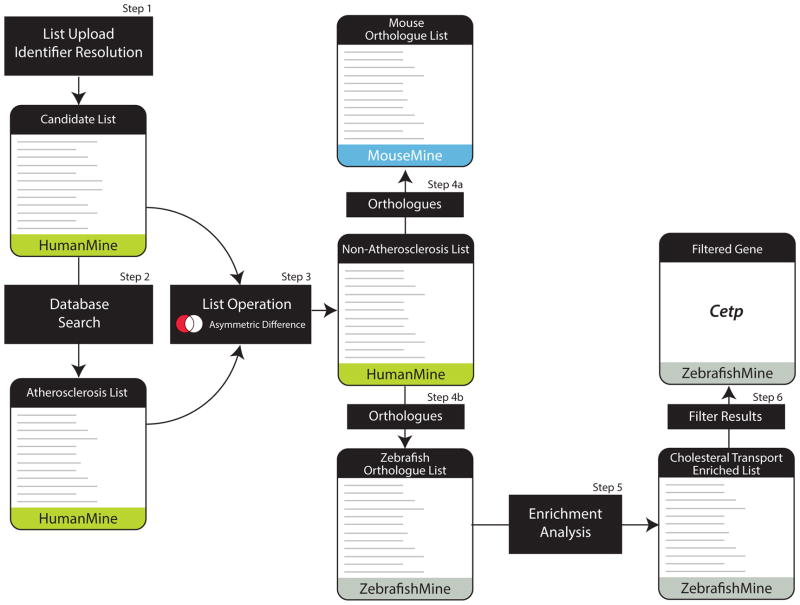
InterMine is a data integration warehouse and analysis software system developed for large and complex biological data sets. Designed for integrative analysis, it can be accessed through a user-friendly web interface. For bioinformaticians, extensive web services as well as programming interfaces for most common scripting languages support access to all features. The web interface includes a useful identifier look-up system, and both simple and sophisticated search options. Interactive results tables enable exploration, and data can be filtered, summarized, and browsed. A set of graphical analysis tools provide a rich environment for data exploration including statistical enrichment of sets of genes or other entities. InterMine databases have been developed for the major model organisms, budding yeast, nematode worm, fruit fly, zebrafish, mouse, and rat together with a newly developed human database. Here, we describe how this has facilitated interoperation and development of cross-organism analysis tools and reports. InterMine as a data exploration and analysis tool is also described. All the InterMine-based systems described in this article are resources freely available to the scientific community.

Keywords: comparative analysis; cross-organism analysis; data analysis; data integration; genomics; integrative analysis; proteomics.


Figures

Figure 1
Figure 1. Data exploration through the InterMine web interface
Data exploration through the InterMine web interface, illustrating navigation between data types within a report page, between report pages and between report pages for orthologous genes in different organisms. The workflow begins with a keyword search for ey in FlyMine followed by navigation to the D. melanogaster ey gene report page, where several data types are examined. Navigation to the corresponding protein report page, PAX6_DROME, allows protein domain data to be viewed. Links to report pages for orthologous genes allow data for equivalent genes in human, mouse, rat, zebrafish and yeast to be examined.
Figure 2
Figure 2. A template search from FlyMine
A template search, Expression + Interactions → Genes, from the FlyMine database, showing two constraints (filters), one for a tissue (in this case adult eye) and one for the interacting gene (in this case ey). This template will return any genes expressed in the adult eye that also interact (physically or genetically) with ey.
Figure 3
Figure 3. The InterMine query builder
The query builder allows navigation of the data model (left pane), where “Constrain” buttons allow the configuration of constraints (filters) on the attribute or class and “Show” buttons add an attribute to the results output. The right pane shows a summary of the query as it is built. A query that will return all Gene Ontology annotations for the D. melanogaster ey gene, together with the associated evidence code, is shown.
Figure 4
Figure 4. An InterMine results table
An InterMine results table, generated by running the template search “Gene -> GO terms” with the ey gene in the FlyMine database. A “column summary” for the Gene Ontology evidence code column is shown, allowing filtering of the results table to show only terms annotated through specific evidence codes. Note that some columns have been removed from the original results for illustration purposes.
Figure 5
Figure 5. Data Exploitation through the InterMine web interface
A hypothetical workflow in which a candidate gene list is filtered through several consecutive analysis tools. Step1: a candidate gene list, identified through a screen for lipid and cholesterol markers as part of a study on atherosclerosis, is uploaded to the HumanMine database. Step 2: A search of the database identifies those genes from the candidate list that are already associated with the disease atherosclerosis. A list is made of these genes. Step3: Using the list operation, asymmetric distribution, a new list is created which does not contain the genes identified as already being associated with atherosclerosis. This list is called the non-atherosclerosis set. Step 4: Links to MouseMine and ZebrafishMine directly from HumanMine allow lists of mouse (Step 4a) and zebrafish (Step 4b) genes orthologous to the non-atherosclerosis list to be analysed in the respective databases. Enrichment statistics for various annotations can be viewed, and in particular an enrichment for the Gene Ontology term “Cholesterol transport” is noted. Step 5: The zebrafish genes from the list annotated with the Gene Ontology term “Cholesterol transport” are saved as a list. Step 6: A database search and filtering for homologues of these genes reveals a gene, Cetp, present in Human and Zebrafish but not in mouse.
Figure 6
Figure 6
Gene Ontology enrichment analysis of a list of genes in ZebrafishMine. A Gene Ontology enrichment table showing terms from the Gene Ontology biological process ontology enriched in a set of zebrafish genes. A hypergeometric distribution is used to calculate the p-value, which is shown in the table, after a Holm-Bonferonni test correction has been applied. The number of genes with each annotation are shown. Lists of genes with each Gene Ontology annotation can be created directly from the table.

References

    1. Alam I, Antunes A, Kamau AA, Ba Alawi W, Kalkatawi M, Stingl U, Bajic VB. INDIGO - INtegrated data warehouse of microbial genomes with examples from the red sea extremophiles. PLoS One. 2013 Dec 6;8(12):e82210. - PMC - PubMed
    1. Aleksic J, Ferrero E, Fischer B, Shen SP, Russell S. The role of Dichaete in transcriptional regulation during Drosophila embryonic development. BMC Genomics. 2013 Dec 8;14:861. - PMC - PubMed
    1. Ashburner M, Ball CA, Blake JA, Botstein D, Butler H, Cherry JM, Davis AP, Dolinski K, Dwight SS, Eppig JT, Harris MA, Hill DP, Issel-Tarver L, Kasarskis A, Lewis S, Matese JC, Richardson JE, Ringwald M, Rubin GM, Sherlock G. Gene ontology: tool for the unification of biology. The Gene Ontology Consortium. Nat Genet. 2000 May;25(1):25–9. - PMC - PubMed
    1. Balakrishnan R, Park J, Karra K, Hitz BC, Binkley G, Hong EL, Sullivan J, Micklem G, Cherry JM. YeastMine-an integrated data warehouse for Saccharomyces cerevisiae data as a multipurpose tool-kit. Database (Oxford) 2012:bar062. - PMC - PubMed
    1. Caspi R, Altman T, Billington R, Dreher K, Foerster H, Fulcher CA, Holland TA, Keseler IM, Kothari A, Kubo A, Krummenacker M, Latendresse M, Mueller LA, Ong Q, Paley S, Subhraveti P, Weaver DS, Weerasinghe D, Zhang P, Karp PD. The MetaCyc database of metabolic pathways and enzymes and the BioCyc collection of Pathway/Genome Databases. Nucleic Acids Res. 2014 Jan;42(Database issue):D459–71. - PMC - PubMed

Publication types

LinkOut - more resources