Clinical Trial
. 2015 Jul 1;125(7):2795-807.
doi: 10.1172/JCI77958. Epub 2015 Jun 22.

Fresolimumab treatment decreases biomarkers and improves clinical symptoms in systemic sclerosis patients

Clinical Trial

Fresolimumab treatment decreases biomarkers and improves clinical symptoms in systemic sclerosis patients

Lisa M Rice et al. J Clin Invest. .

Abstract

Background: TGF-β has potent profibrotic activity in vitro and has long been implicated in systemic sclerosis (SSc), as expression of TGF-β-regulated genes is increased in the skin and lungs of patients with SSc. Therefore, inhibition of TGF-β may benefit these patients.

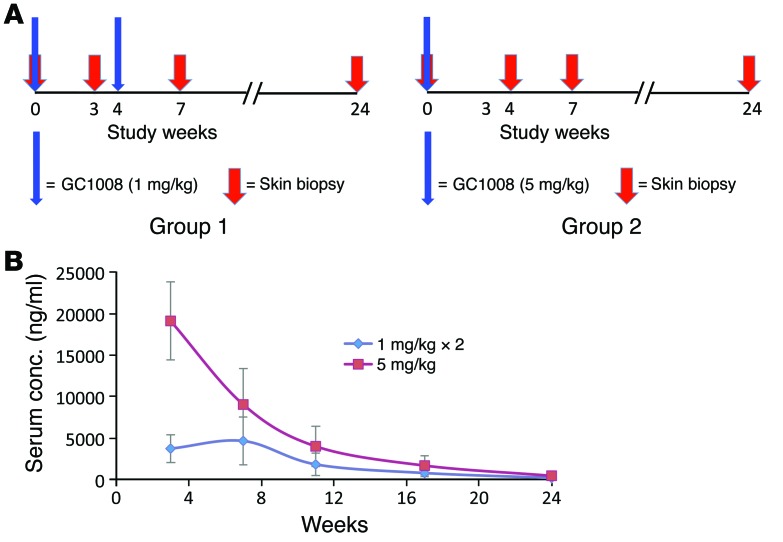
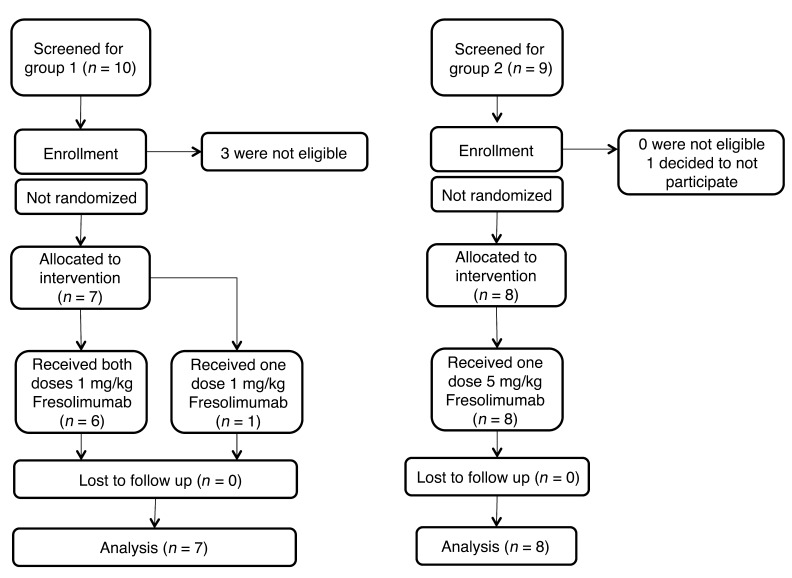
Methods: Patients with early, diffuse cutaneous SSc were enrolled in an open-label trial of fresolimumab, a high-affinity neutralizing antibody that targets all 3 TGF-β isoforms. Seven patients received two 1 mg/kg doses of fresolimumab, and eight patients received one 5 mg/kg dose of fresolimumab. Serial mid-forearm skin biopsies, performed before and after treatment, were analyzed for expression of the TGF-β-regulated biomarker genes thrombospondin-1 (THBS1) and cartilage oligomeric protein (COMP) and stained for myofibroblasts. Clinical skin disease was assessed using the modified Rodnan skin score (MRSS).

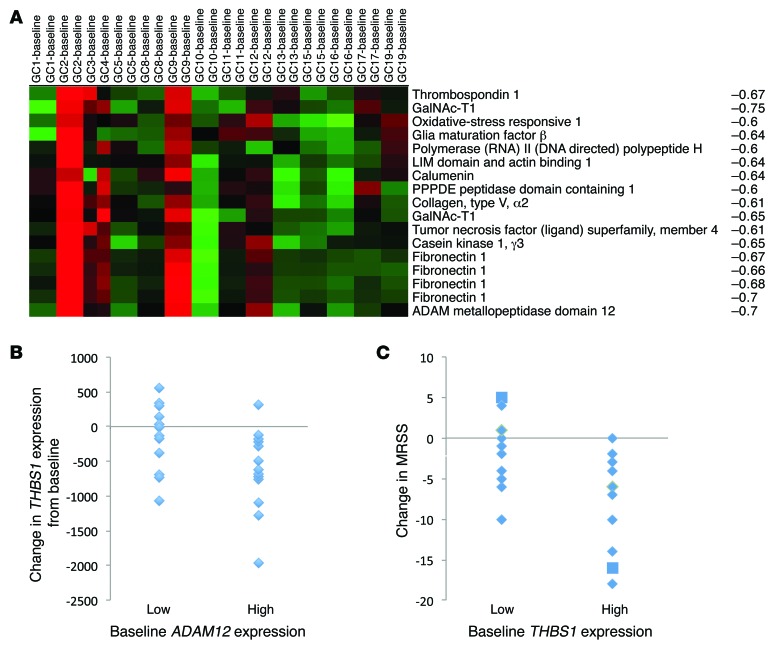
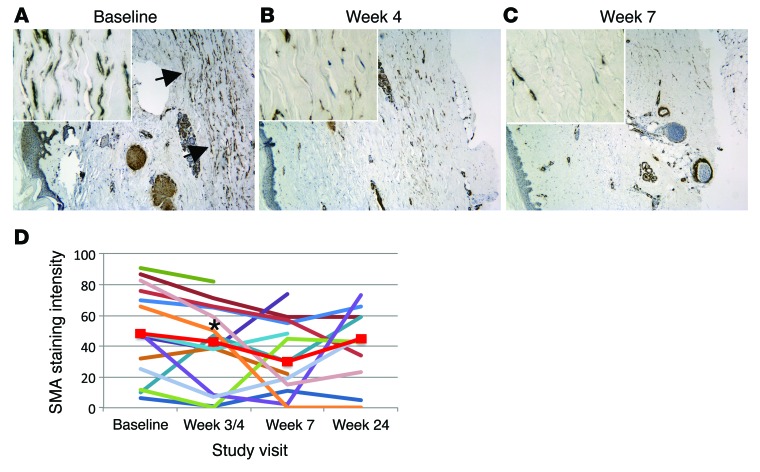
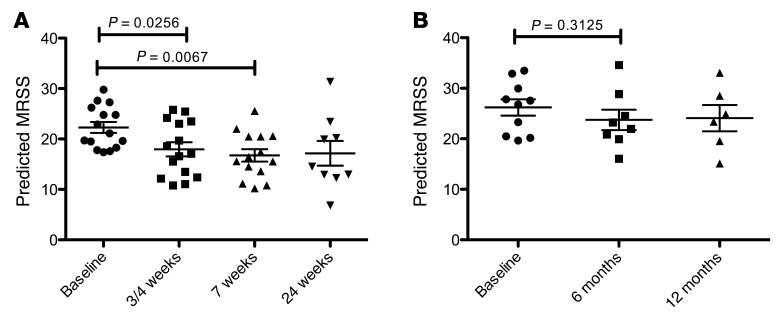
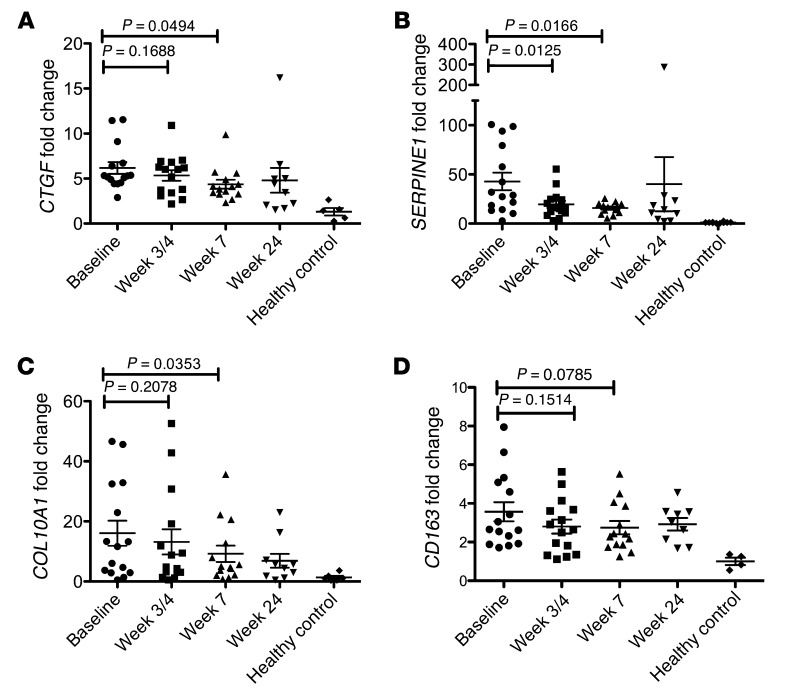
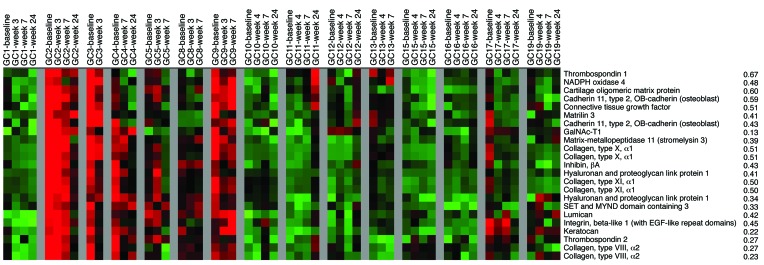
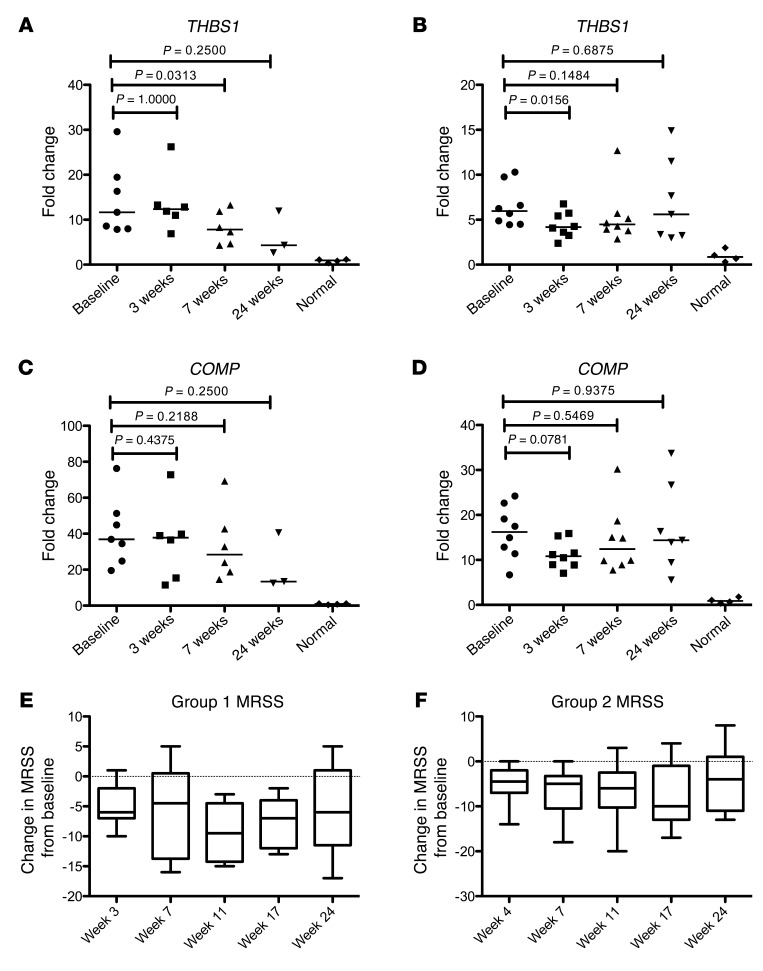
Results: In patient skin, THBS1 expression rapidly declined after fresolimumab treatment in both groups (P = 0.0313 at 7 weeks and P = 0.0156 at 3 weeks), and skin expression of COMP exhibited a strong downward trend in both groups. Clinical skin disease dramatically and rapidly decreased (P < 0.001 at all time points). Expression levels of other TGF-β-regulated genes, including SERPINE1 and CTGF, declined (P = 0.049 and P = 0.012, respectively), and a 2-gene, longitudinal pharmacodynamic biomarker of SSc skin disease decreased after fresolimumab treatment (P = 0.0067). Dermal myofibroblast infiltration also declined in patient skin after fresolimumab (P < 0.05). Baseline levels of THBS1 were predictive of reduced THBS1 expression and improved MRSS after fresolimumab treatment.

Conclusion: The rapid inhibition of TGF-β-regulated gene expression in response to fresolimumab strongly implicates TGF-β in the pathogenesis of fibrosis in SSc. Parallel improvement in the MRSS indicates that fresolimumab rapidly reverses markers of skin fibrosis.

Trial registration: Clinicaltrials.gov NCT01284322.


Figures

Figure 8
Figure 8. THBS1 and ADAM12 expression predicts response to fresolimumab.
(A) 58 genes showing correlations with the change in THBS1 expression at week 3 or 4 and week 7 compared with baseline of less than –0.6 were clustered. Baseline ADAM12, THBS1, and FN cluster together, showing strongly negative correlations with the change in THBS1 expression after fresolimumab treatment at week 3 or 4 and week 7 (red, higher expression; green, lower expression). Pearson correlations are shown to the right. (B) Patients were stratified into high (n = 14) and low (n = 14) baseline ADAM12 expression groups, based on whether they exhibited greater or less than the median level of ADAM12 expression on microarray. Patients were then graphed according to week 3 or 4 and week 7 THBS1 expression, compared with baseline (change in THBS1). Patient samples showing high baseline ADAM12 expression showed greater decreases in THBS1 after fresolimumab than patient samples with low baseline ADAM12 expression (P < 0.05, Fisher’s exact test). (C) Patient samples were stratified into high (n = 14) and low (n = 14) baseline THBS1 expression groups, based on whether they exhibited greater or less than median level of THBS1 expression on microarray. Samples were then graphed according to week 3 or 4 and week 7 THBS1 expression, compared with baseline (change in THBS1). Samples showing high baseline THBS1 expression showed greater decreases in MRSS after fresolimumab than samples with low baseline THBS1 expression (P < 0.05, Fisher’s exact test).
Figure 7
Figure 7. Myofibroblast infiltration in fresolimumab-treated patients.
Sequential biopsies from patient GC17 are shown, comparing (B) week 4 and (C) week 7 to (A) baseline myofibroblast infiltration (original magnification, ×10). Arrows indicate myofibroblasts. Insets show myofibroblast staining in the deep dermis (original magnification, ×40). (D) Skin biopsies stained for smooth muscle actin (SMA) were scored by an observer blinded to biopsy sample for intensity of myofibroblast infiltration. Median values for each time point are shown by the red line with rectangular symbols (*P < 0.01, comparing week 4 to baseline, Wilcoxon ranked-sum).
Figure 6
Figure 6. Decreased 2GSSc biomarker level in skin after fresolimumab treatment.
Skin RNAs from patients entered into (A) the fresolimumab trial or (B) a clinical trial of nilotinib were assayed by NanoString for 2GSSc skin biomarker levels in baseline, week 3 or 4, and week 7 (fresolimumab) or at baseline and 6 and 12 months (nilotinib). Statistical significance was assessed by Wilcoxon signed-rank. Error bars indicate SEM.
Figure 5
Figure 5. Changes in gene expression before and after fresolimumab treatment.
Skin biopsy RNAs were analyzed for expression of TGF-β–regulated genes, (A) CTGF, (B) SERPINE1, (C) and COL10A1, and a macrophage marker, (D) CD163, at baseline and after fresolimumab treatment. Levels from 5 healthy controls skin samples are also shown. CTGF, SERPINE1, and COL10A1 mRNA expression was assayed by RT-PCR; CD163 expression was assayed by NanoString. Statistical significance was assessed by Wilcoxon signed-rank. Error bars indicate SEM.
Figure 4
Figure 4. Hierarchical clustering of skin gene expression in study patients.
The gene cluster, including both primary outcome measures, THBS1 and COMP, is shown. Samples from each study patient (n = 15) are shown as columns of gene expression (red, high gene expression; green, low gene expression; black, intermediate gene expression), labeled by study visit, starting with the baseline biopsy, followed sequentially by subsequent biopsies (top of figure), with a blank column between each patient. Gene names and the correlation between each gene and the MRSS are shown to the right and far right, respectively. GalNAc-T1, UDP-N-acetyl-α-D-galactosamine:polypeptide N-acetylgalactosaminyltransferase 1.
Figure 3
Figure 3. Changes in biomarker gene expression and MRSS by study group.
(A and B) THBS1 and (C and D) COMP gene expression and (E and F) MRSS from study patients in (A, C, and E) group 1 (n = 7), which received 2 doses of 1 mg/kg fresolimumab, and (B, D, and F) group 2 (n = 8), which received 1 dose of 5 mg/kg fresolimumab. Dot plots show median (horizontal bars) and statistical significance of THBS1 and COMP gene expression (Wilcoxon signed-rank test, using available data). Box plots show median (horizontal line), interquartile (box), and 95% confidence limits (whiskers) of MRSS. Line graphs showing changes in individual patients over time are shown in Supplemental Figure 1.
Figure 2
Figure 2. Study design and pharmacokinetics of fresolimumab in two dosing groups.
(A) Trial protocol for each group shows dosing levels and frequency and timing of skin biopsies. Red arrows indicate skin biopsies. (B) Fresolimumab levels measured in sera at 3, 7, 11, 17, and 24 weeks in group 1, which received 2 doses of 1 mg/kg at weeks 0 and 4 (blue diamonds), and group 2, which received a single dose of 5 mg/kg fresolimumab at week 0 (red squares). Error bars indicate SD.
Figure 1
Figure 1. CONSORT flow diagram.
Schematic of patient screening, enrollment, and completion of the trial in the two study groups.

References

    1. Roberts AB, Anzano MA, Wakefield LM, Roche NS, Stern DF, Sporn MB. Type β transforming growth factor: a bifunctional regulator of cellular growth. Proc Natl Acad Sci U S A. 1985;82(1):119–123. doi: 10.1073/pnas.82.1.119. - DOI - PMC - PubMed
    1. Roberts AB, et al. Transforming growth factor type β: rapid induction of fibrosis and angiogenesis in vivo and stimulation of collagen formation in vitro. Proc Natl Acad Sci U S A. 1986;83(12):4167–4171. doi: 10.1073/pnas.83.12.4167. - DOI - PMC - PubMed
    1. Roberts AB, Heine UI, Flanders KC, Sporn MB. Transforming growth factor-β. Major role in regulation of extracellular matrix. Ann N Y Acad Sci. 1990;580:225–232. doi: 10.1111/j.1749-6632.1990.tb17931.x. - DOI - PubMed
    1. Penttinen RP, Kobayashi S, Bornstein P. Transforming growth factor β increases mRNA for matrix proteins both in the presence and in the absence of changes in mRNA stability. Proc Natl Acad Sci U S A. 1988;85(4):1105–1108. doi: 10.1073/pnas.85.4.1105. - DOI - PMC - PubMed
    1. Derynck R, Miyaono K, eds. The TGF-Beta Family. Cold Spring Harbor Monograph Series 50. Cold Spring Harbor, New York, USA: Cold Spring Harbor Laboratory Press; 2007.

Publication types

Associated data