. 2015 Jul;33(7):761-8.
doi: 10.1038/nbt.3247. Epub 2015 Jun 22.

Lineage conversion induced by pluripotency factors involves transient passage through an iPSC stage

Affiliations

Lineage conversion induced by pluripotency factors involves transient passage through an iPSC stage

Ori Bar-Nur et al. Nat Biotechnol. 2015 Jul.

Abstract

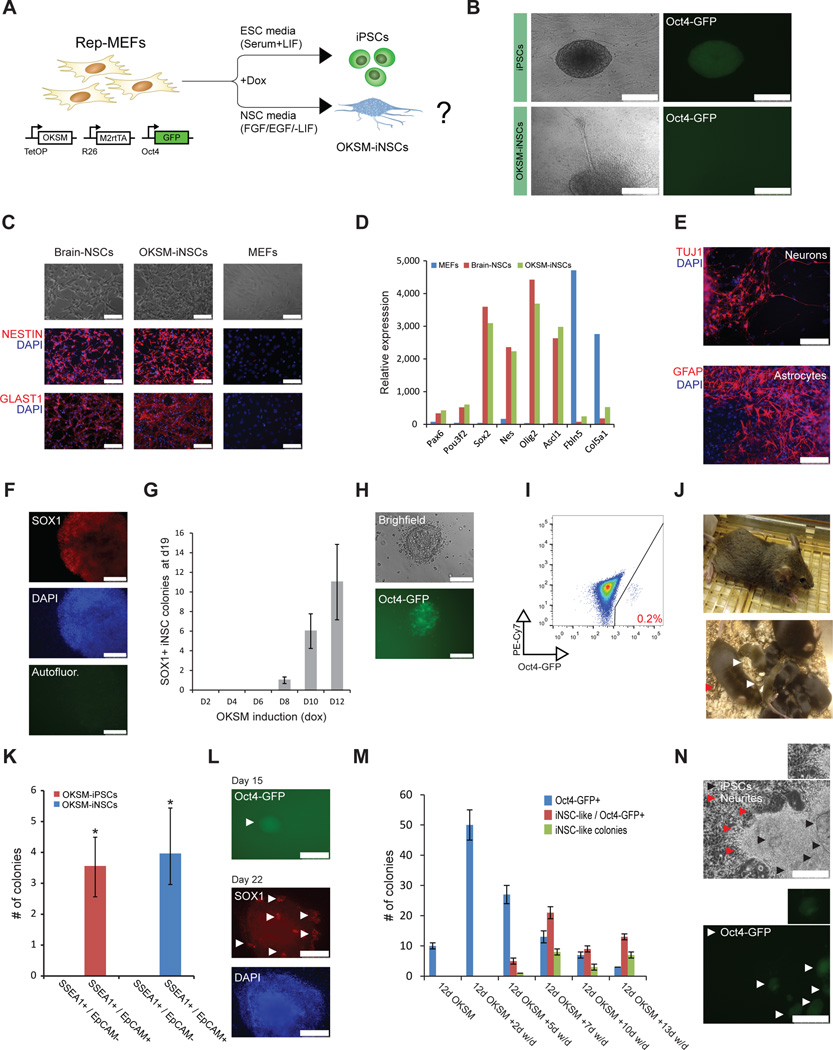
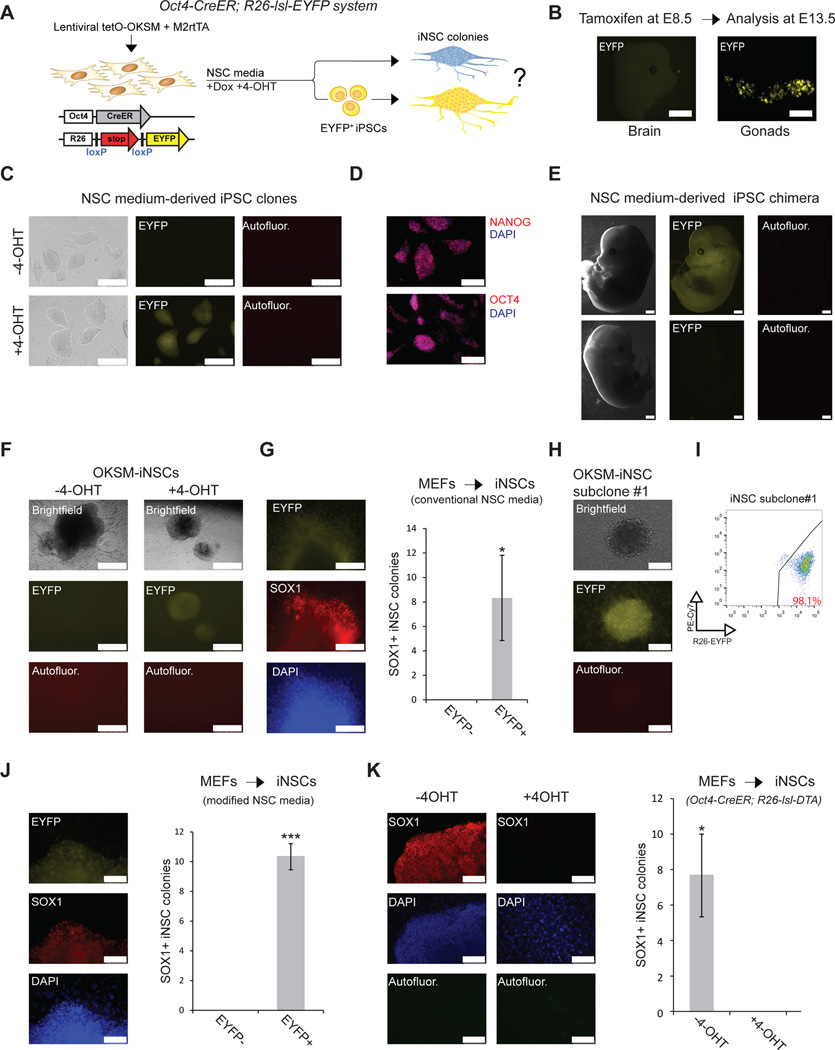
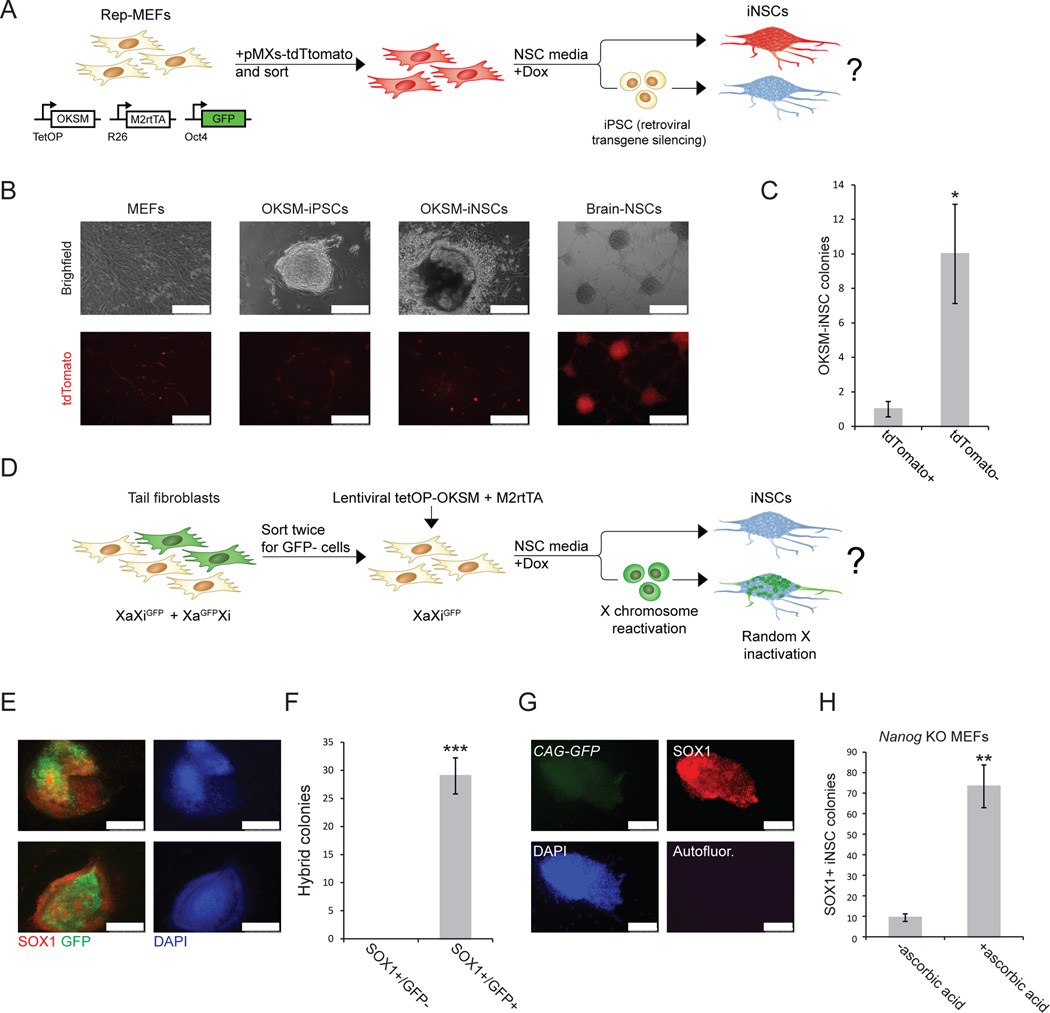
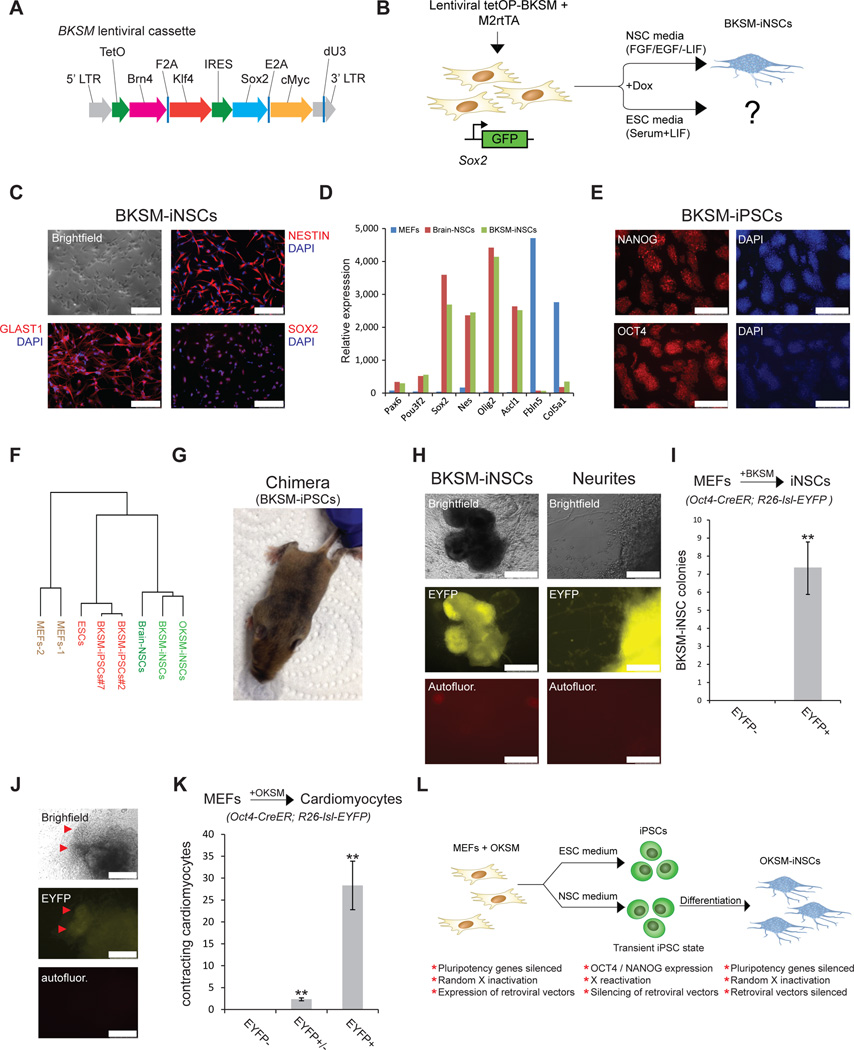
Brief expression of pluripotency-associated factors such as Oct4, Klf4, Sox2 and c-Myc (OKSM), in combination with differentiation-inducing signals, has been reported to trigger transdifferentiation of fibroblasts into other cell types. Here we show that OKSM expression in mouse fibroblasts gives rise to both induced pluripotent stem cells (iPSCs) and induced neural stem cells (iNSCs) under conditions previously shown to induce only iNSCs. Fibroblast-derived iNSC colonies silenced retroviral transgenes and reactivated silenced X chromosomes, both hallmarks of pluripotent stem cells. Moreover, lineage tracing with an Oct4-CreER labeling system demonstrated that virtually all iNSC colonies originated from cells transiently expressing Oct4, whereas ablation of Oct4(+) cells prevented iNSC formation. Lastly, an alternative transdifferentiation cocktail that lacks Oct4 and was reportedly unable to support induced pluripotency yielded iPSCs and iNSCs carrying the Oct4-CreER-derived lineage label. Together, these data suggest that iNSC generation from fibroblasts using OKSM and other pluripotency-related reprogramming factors requires passage through a transient iPSC state.


Figures

Figure 1
Figure 1. Generation of iPSCs and iNSCs under neural culture conditions
(A) Experimental design to generate iPSCs and iNSCs in different culture conditions using reprogrammable MEFs (rep-MEFs) harboring the Col1a1-tetOP-OKSM and Rosa26-M2rtTA alleles and an Oct4-GFP reporter. (B) Representative image of Oct4-GFP+ iPSC colony generated in ESC medium (serum + LIF) (upper panel) and Oct4-GFP iNSC-like colony generated in NSC medium (−LIF/+FGF, EGF) showing typical spheroid morphology with neurite-like structures projecting from the center (bottom panel). Scale bar is 250µM. (C) Representative immunofluorescence images showing staining for indicated NSC markers in brain-derived NSCs and OKSM-iNSCs. MEFs served as a negative control. Scale bar is 100µM. (D) Expression of NSC or MEF-associated markers in the indicated cell lines based on microarray gene expression analysis. (E) Differentiation potential of OKSM-iNSCs into Tuj1+ neurons and GFAP+ astrocytes. Scale bar is 100µM. (F) Representative immunofluorescence image of a Sox1+ iNSC colony obtained after 10 days of OKSM expression, followed by 9 days of dox-independent growth. Scale bar is 100µM. Autofluor., autofluorescence control. (G) Graph showing the minimal number of days required to generate stable Sox1+ iNSC colonies using conventional NSC medium. Doxycycline was applied for indicated lengths of time before scoring for iNSC colonies at day 19 to capture stable, transgene-independent colonies. For each replicate, 3x10⁴ cells were used (n=3 independent replicates for each time point; error bars, standard error of the mean (s.e.m.) for 3 independent experiments). (H) Detection of a rare Oct4-GFP+ iPSC-like colony under transdifferentiation conditions in NSC medium. Scale bar is 100µM. (I) Flow cytometric analysis for Oct4-GFP expression in bulk rep-MEF cultures subjected to the NSC transdifferentiation protocol. The PE-Cy7 channel was used to detect autofluorescence. (J) Contribution of NSC medium–derived iPSCs to chimeras as indicated by agouti coat color (upper image). Germline offspring (white arrowheads) obtained from a male chimera (red arrow) (lower image). (K) Potential of sorted SSEA1+/EpCAM+ and SSEA1+/EpCAM intermediates after 6 days of OKSM expression to produce iPSCs in ESC medium or iNSCs in conventional NSC medium, respectively. For each replicate, 10x105 cells were plated (n=3 independent replicates; error bars, s.e.m for 3 independent experiments, *p<0.05). (L) Representative images of an Oct4-GFP+ colony (top image) and a Sox1+ iNSC colony (bottom image) obtained from sorted SSEA1+/EpCAM+ intermediates (day 6) in NSC medium. White arrowheads indicate an Oct4-GFP colony (top) or clusters of Sox1+ expressing cells (bottom). Scale bar is 500µM (Oct4-GFP) or 250µM (Sox1). (M) Quantification of Oct4-GFP+ colonies, Oct4-GFP+/iNSC hybrid colonies and Oct4-GFP/iNSC colonies at the indicated time points after dox withdrawal (w/d). For each replicate, 3x10⁴ cells were used (n=3 independent replicates for each time point; error bars, s.e.m. for 3 independent experiments). (N) Representative image of iPSC/iNSC hybrid colonies detected during the transdifferentiation protocol. Note the dome-shaped iPSC-like colonies in the center and emanating neurites (indicated by black and red arrowheads, respectively). Bottom images shows patches of Oct4-GFP reporter expression (white arrowheads) within the same colony as shown above. Scale bar is 250µM. Insets show magnification of neurites (top) and a representative Oct4-GFP colony (bottom).
Figure 2
Figure 2. Oct4 lineage tracing and ablation during iNSC induction
(A) Schematic showing lineage tracing approach to test whether iNSCs pass through an Oct4+ state. (B) Head and gonads from an Oct4-CreER; R26-lsl-EYFP embryo that was induced in utero with 4-OHT (E8.5) and recovered at E13.5. Note that the brain is EYFP negative, while the gonads are EYFP positive, indicating specificity of the lineage-tracing allele in-vivo. (C) Generation of EYFP+ iPSCs from Oct4-CreER; R26-lsl-EYFP MEFs generated in NSC medium. Note that iPSCs are EYFP+ only when 4-OHT is administered to the reprogramming medium. Scale bar is 250µM. Autofluor., autofluorescence control. (D) Representative immunofluorescence images for the indicated pluripotency markers in NSC medium–derived EYFP+ iPSCs. Scale bar is 100µM. (E) EYFP+ iPSCs, derived in NSC medium, contribute to an E13.5 midgestation chimera (upper images); non-chimeric littermate lacks EYFP signal (bottom images). (F) Images of EYFP+ OKSM-iNSC colonies with typical neurites protruding from the center. OKSM-iNSC colonies remain EYFP when 4-OHT is not applied. Scale bar is 500µM. (G) Quantification of Sox1+ EYFP+ and Sox1+ EYFP iNSC colonies generated in conventional NSC medium after 8–12 days of OKSM induction, followed by 14–18 days of dox-independent growth. For each replicate, 3x10⁴ cells were used (n=3 biological replicates; error bars, s.e.m. for 3 independent experiments, *p<0.05). A representative EYFP+ iNSC colony with patches of Sox1+ expressing cells is shown to the left. Scale bar is 100µM. (H) Immunofluorescence for EYFP of OKSM-iNSC subclone #1 at passage 20, demonstrating continuous and uniform EYFP expression. Scale bar is 100µM. (I) Flow cytometric analysis for EYFP expression of the same OKSM-iNSC subclone #1. The PE-Cy7 channel was used to control for autofluorescence. (J) Quantification of Sox1+ EYFP+ and Sox1+ EYFP iNSC colonies, generated in modified NSC medium after 4–5 days of OKSM induction, followed by 2–4 weeks of dox-independent growth. For each replicate, 5x10⁵ cells were used (n=3 biological replicates; error bars, s.e.m. for 3 independent experiments, ***p<0.0005). A representative EYFP+/Sox1+ iNSC colony is shown to the left. Scale bar is 100µM. (K) Quantification of Sox1+ iNSC colonies obtained from Oct4-CreER; R26-lsl-DTA (Diphtheria Toxin fragment A) MEFs after 5 days of OKSM expression, followed by 3 weeks of dox-independent growth in modified NSC medium in the absence or presence of 4-OHT. For each replicate, 5x10⁵ cells were used (n=3 independent replicates; error bars, s.e.m. for 3 independent experiments, *p<0.05). Scale bar is 100µM. Autofluor., autofluorescence. Representative images are shown to the left.
Figure 3
Figure 3. Silencing of retroviral transgenes and X chromosome reactivation during iNSCs induction
(A) Experimental design to assess retroviral silencing during iNSC formation. (B) Representative images comparing tdTomato expression in MEFs, iPSCs, OKSM-iNSCs and brain-derived NSCs. Note that tdTomato+ non-reprogrammed MEFs surround the iPSC and iNSC colonies. Scale bar is 250µM. (C) Quantification of iNSC colonies expressing tdTomato+. For each replicate, 3x10⁴ cells were used (n=5 independent replicates; error bars, s.e.m. for 5 independent experiments, *p<0.05). (D) Experimental design to follow X chromosome inactivation status during iNSC formation. Tail tip fibroblasts (TTFs) from a female mouse heterozygous for an X-linked CMV-GFP reporter (mix of XiGFPXa and XiXaGFP cells) were sorted twice for cells that carried the GFP transgene on the inactive X chromosome (XiGFPXa). These cells were reprogramed for 4–5 days in modified NSC medium, after which dox was withdrawn and GFP expression was assessed in emerging Sox1+ iNSC colonies 2–4 weeks later. (E) Representative immunofluorescence images of Sox1+ iNSC colonies that show reactivation of the silent XiGFP reporter. Scale bar is 250µM. (F) Quantification of Sox1+ iNSC colonies that reactivated the silenced X chromosome as determined by GFP reporter reactivation. All examined Sox1+ iNSC colonies showed patchy GFP expression. For each replicate, 3x10⁴ cells were used (n=3 independent replicates; error bars, s.e.m. for 3 independent experiments, ***p<0.0005). (G) Representative immunofluorescence images showing Nanog knockout Sox1+ iNSC colony generated in the presence of ascorbate. Nanog-deficient iNSCs express the constitutive CAG-GFP marker, confirming their origin from Nanog-mutant MEFs. Scale bar is 100µM. Autofluor., autofluorescence control. (H) Quantification of Sox1+ iNSC colonies generated from Nanog-deficient MEFs with and without ascorbate. For each replicate, 3x10⁴ cells were used (n=3 independent replicates; error bars, s.e.m. for 3 independent experiments, **p<0.005).
Figure 4
Figure 4. An alternative transdifferentiation cocktail generates iNSCs and iPSCs via an Oct4+ intermediate stage
(A) Replacement of the Oct4 gene within the Oct4-Klf4-Sox2-cMyc (OKSM cassette) by the neuronal transcription factor Brn4 (BKSM cassette). (B) Experimental design to generate iPSCs and iNSCs using the BKSM cassette from MEFs harboring a Sox2-GFP knock-in allele in ESC or NSC culture conditions. (C) Immunofluorescence of typical NSC markers in an expanded BKSM-iNSC clone. Scale bar is 100µM. (D) Expression of selected NSC-associated genes in indicated cell lines based on microarray data. Microarray analysis was performed on expanded clonal iNSC cultures. (E) Immunofluorescence for indicated pluripotency markers in expanded BKSM-iPSC clone. Scale bar is 250µM. (F) Dendrogram based on microarray analysis of indicated samples. Note that BKSM-iNSCs and OKSM-iNSCs cluster with brain-derived NSCs while BKSM-iPSCs cluster with mouse ESCs. (G) Contribution of BKSM-iPSCs to an adult chimera as shown by agouti coat color. (H) Representative images of EYFP+ BKSM-iNSC colonies with emanating neurites generated from MEFs in conventional NSC medium. Scale bar is 500µM for iNSC colony (left) and 100µM for neurites (right). Autofluor., autofluorescence control. (I) Quantification of EYFP+ BKSM-iNSC colonies, demonstrating that all of the examined BKSM-iNSC colonies transitioned through an Oct4+ state. For each replicate, 5x10⁵ cells were used (n=3 biological replicates; error bars, s.e.m. for 3 independent experiments, **p<0.005). (J) Representative images showing EYFP+ cells in a cluster of beating cardiomyocytes (red arrowheads). (K) Quantification of EYFP+, EYFP and EYFP+/EYFP contracting induced cardiomyocyte colonies derived from Oct4-CreER; R26-lsl-EYFP MEFs upon short OKSM expression in cardiac transdifferentiation conditions. For each replicate, 5x10⁵ cells were used (n=3 biological replicates; error bars, s.e.m. for 3 independent experiments, **p<0.005). (L) Summary.

Comment in

References

    1. Vierbuchen T, Wernig M. Molecular roadblocks for cellular reprogramming. Molecular cell. 2012;47:827–838. - PMC - PubMed
    1. Efe JA, et al. Conversion of mouse fibroblasts into cardiomyocytes using a direct reprogramming strategy. Nature cell biology. 2011;13:215–222. - PubMed
    1. Han DW, et al. Direct reprogramming of fibroblasts into neural stem cells by defined factors. Cell stem cell. 2012;10:465–472. - PubMed
    1. Kim J, et al. Direct reprogramming of mouse fibroblasts to neural progenitors. Proceedings of the National Academy of Sciences of the United States of America. 2011;108:7838–7843. - PMC - PubMed
    1. Li K, et al. Small molecules facilitate the reprogramming of mouse fibroblasts into pancreatic lineages. Cell stem cell. 2014;14:228–236. - PMC - PubMed

Publication types

Associated data