. 2015 Jul;17(7):943-52.
doi: 10.1038/ncb3194. Epub 2015 Jun 22.

Mechanosensitive pannexin-1 channels mediate microvascular metastatic cell survival

Affiliations

Mechanosensitive pannexin-1 channels mediate microvascular metastatic cell survival

Paul W Furlow et al. Nat Cell Biol. 2015 Jul.

Abstract

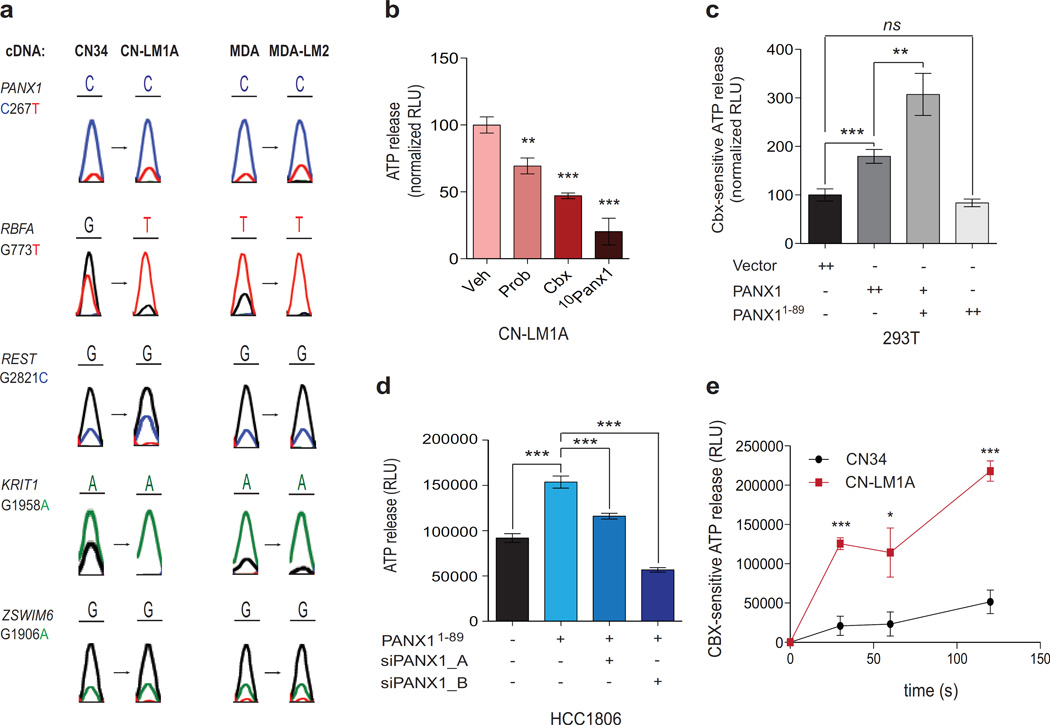
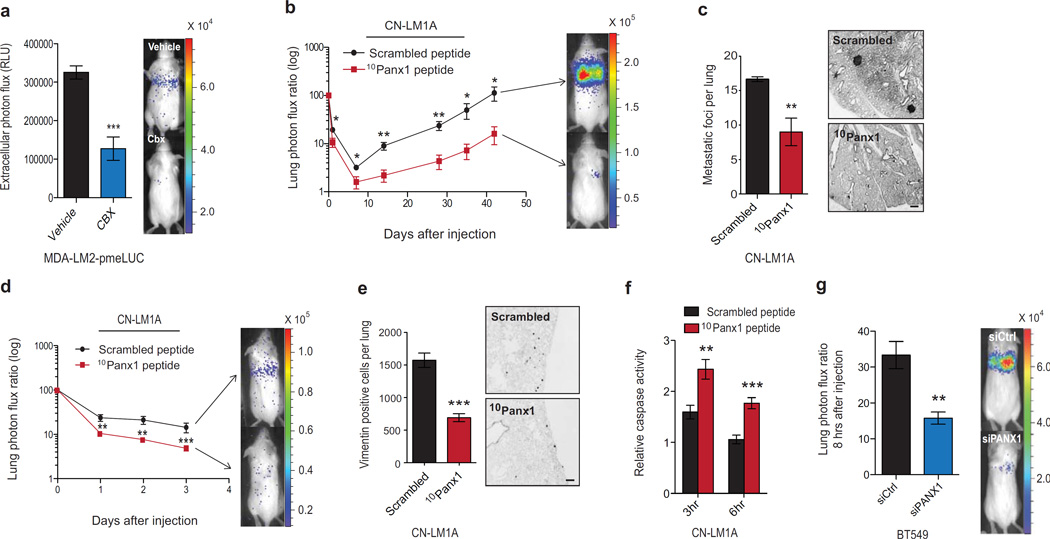
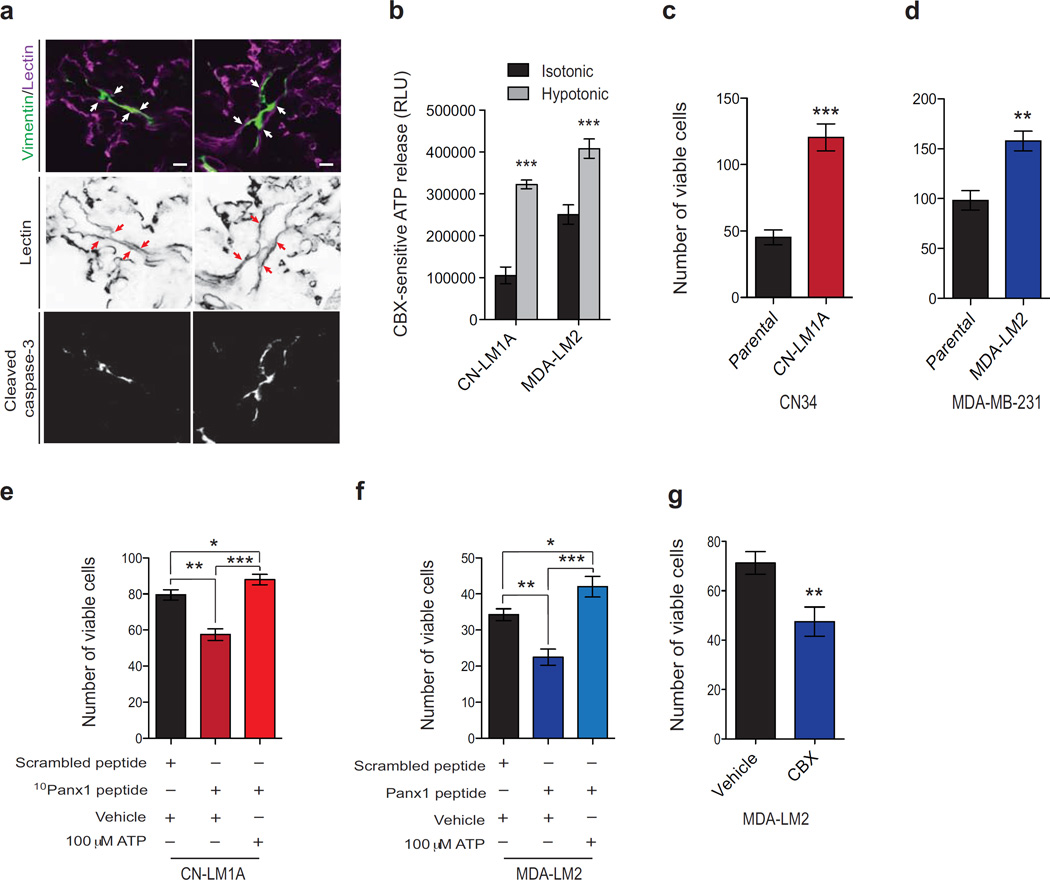
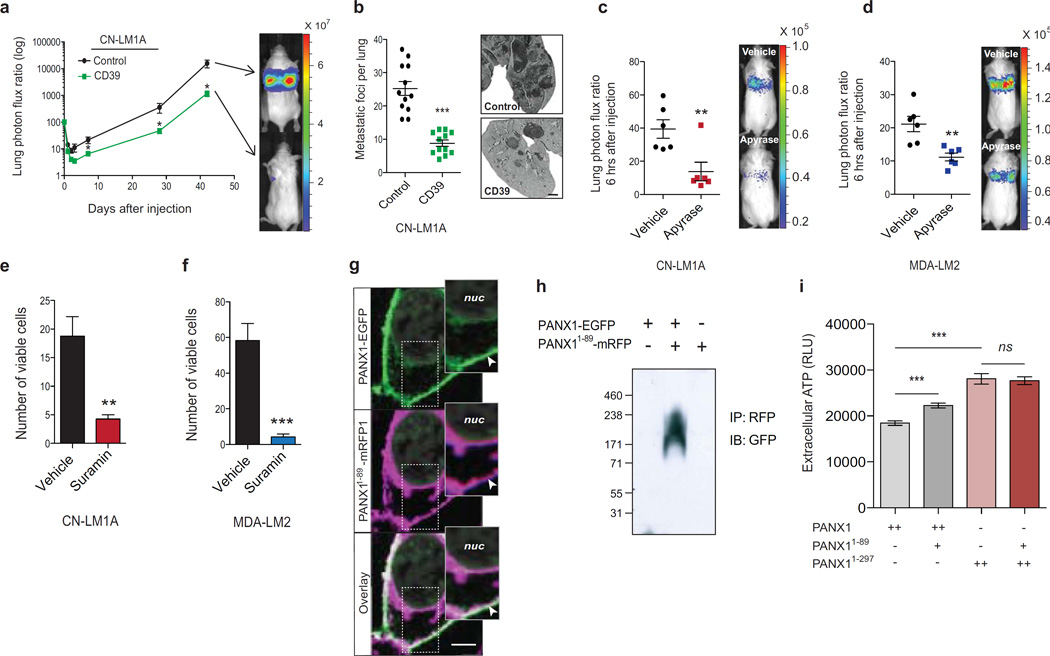
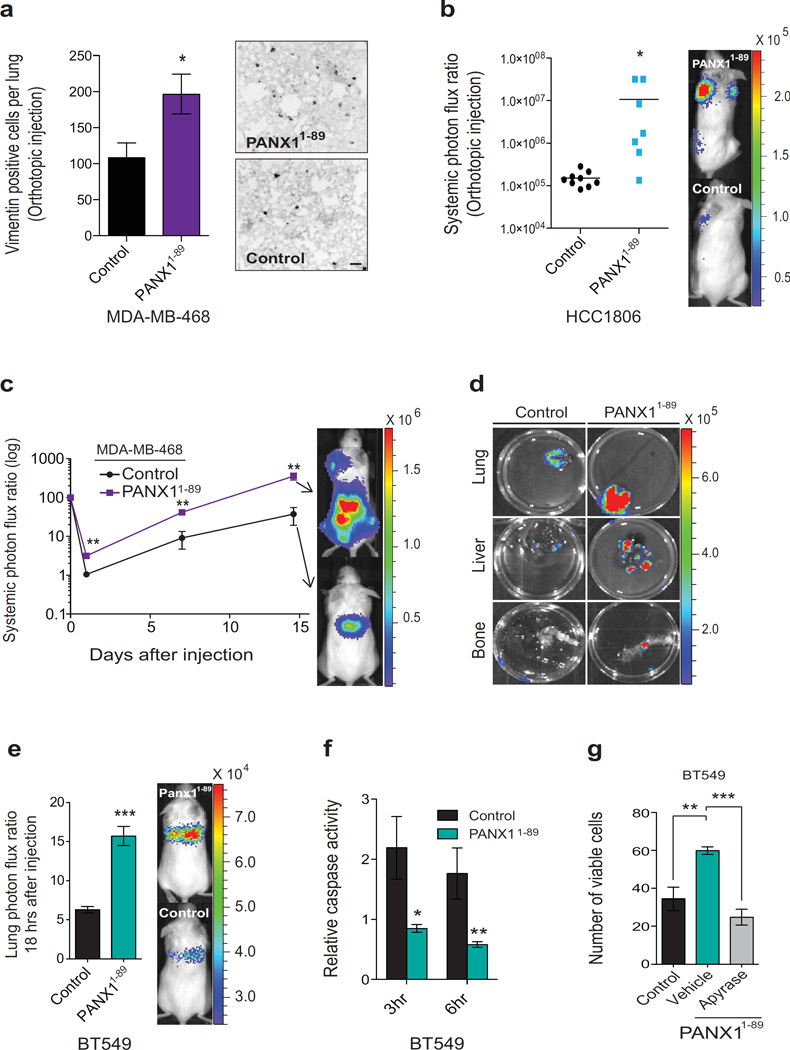
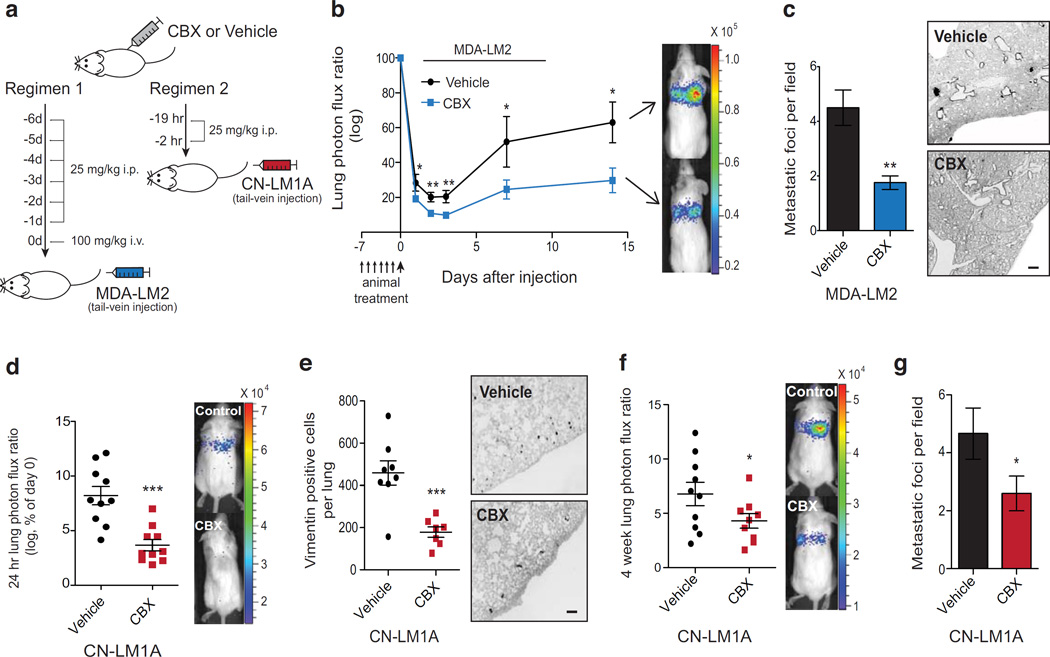
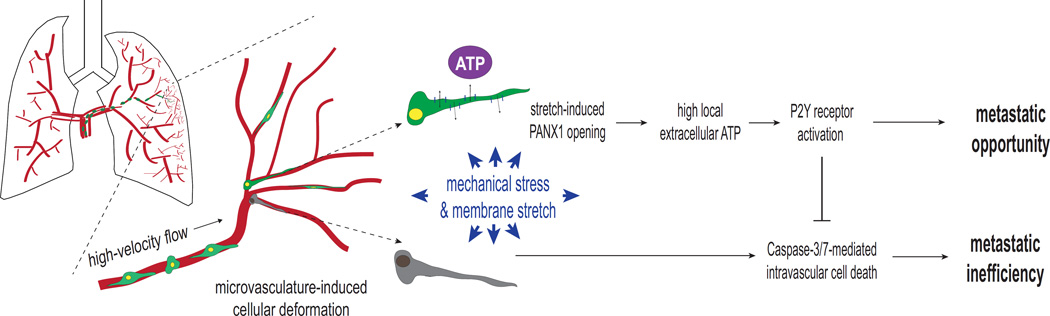
During metastatic progression, circulating cancer cells become lodged within the microvasculature of end organs, where most die from mechanical deformation. Although this phenomenon was first described over a half-century ago, the mechanisms enabling certain cells to survive this metastasis-suppressive barrier remain unknown. By applying whole-transcriptome RNA-sequencing technology to isogenic cancer cells of differing metastatic capacities, we identified a mutation encoding a truncated form of the pannexin-1 (PANX1) channel, PANX1(1-89), as recurrently enriched in highly metastatic breast cancer cells. PANX1(1-89) functions to permit metastatic cell survival during traumatic deformation in the microvasculature by augmenting ATP release from mechanosensitive PANX1 channels activated by membrane stretch. PANX1-mediated ATP release acts as an autocrine suppressor of deformation-induced apoptosis through P2Y-purinergic receptors. Finally, small-molecule therapeutic inhibition of PANX1 channels is found to reduce the efficiency of breast cancer metastasis. These data suggest a molecular basis for metastatic cell survival on microvasculature-induced biomechanical trauma.


Figures

Figure 1
Figure 1. PANX1 1–89 augments PANX1-mediated ATP release in metastatic breast cancer cells
a, Sanger sequencing traces from the cDNA of CN34, CN-LM1A, MDA-MB-231 and MDA-LM2 cells at the nSNV alleles predicted to result in non-neutral substitutions by PolyPhen-2. b, Quantification of PANX1-mediated ATP release from CN-LM1A cells pretreated for 10 min with PBS, 2mM PB, 500 µM CBX, or 100 µM 10Panx1 peptide; n = 4. c, Quantification of PANX1-mediated ATP release from HEK293T cells transfected with 8 µg control vector (n = 8), 8 µg wild-type PANX1 (n = 8), 5 µg wild-type PANX1 and 3 µg PANX1 1–89 (n = 7), or 8 µg PANX1 1–89 (n = 3), and pretreated for 10 min with 500 µM carbenoxolone (CBX) or an equivalent volume of PBS. d, Quantification of ATP release from PANX1 1–89-expressing HCC1806 breast cancer cells transfected with short interfering RNAs (siRNAs) against full-length endogenous PANX1 or control siRNA; n = 12. e, Time-course measurements of CBX-sensitive ATP release from CN34 parental cells and the CN-LM1A metastatic derivative sub-line pretreated with CBX (500 µM) or PBS for 10 min; n = 4. Error bars, s.e.m., ns, nonsignificant; *, P < 0.05; **, P < 0.01; ***, P < 0.001 by a one-tailed Student’s t-test. n represents biological replicates. Experimental results presented are representative and were independently replicated at least two times with two independent cell lines.
Figure 2
Figure 2. Breast cancer cell PANX1 activity within the pulmonary vasculature promotes lung metastasis
a, Quantitative bioluminescence imaging of extracellular ATP release by cancer cells in the lung vasculature 5 min after tail-vein injection of 1 × 10⁵ MDA-LM2 cells expressing plasma membrane-anchored extracellular luciferase (MDA-LM2-pmeLUC). MDA-LM2-pmeLUC cells were pretreated for 10 min with either CBX (500 µM; n = 5) or PBS (n = 7) prior to injection into FVB/NJ mice. b, Quantitative bioluminescence imaging of lung metastasis after the injection of 1 × 10⁵ highly metastatic CN-LM1A breast cancer cells pretreated with 100 µM 10Panx1 (n = 6) or scrambled peptide (n = 7), into NOD scid (NS) mice. c, Day 42 quantification of metastatic foci from H&E-stained lungs (left) and representative images from vimentin-stained lungs (right) of mice injected with CN-LM1A cells pretreated with 10Panx1 or scrambled peptide; n = 5. Scale bar, 0.5 mm. d, Daily quantitative imaging plot of lung bioluminescence subsequent to the injection of 1 × 10⁵ metastatic CN-LM1A breast cancer cells pretreated (30 min) with 100 µM 10Panx1 or scrambled peptides, into NS mice; n = 7. e, Lungs from mice were extracted at day 3, sectioned and stained for vimentin and the numbers of vimentin-positive cancer cells were quantified; n = 5. Scale bar, 0.25 mm. f, In vivo quantification of luciferase-based caspase-3/7 activity at 3 and 6 hrs after tail-vein injection of 1 × 10⁵ CN-LM1A breast cancer cells, pretreated with 100 µM 10Panx1 or scrambled peptide, into NS mice; n = 5. g, Quantitative bioluminescence imaging of cancer cells in the lungs 8-hours after the injection of 2 × 10⁵ BT549 cells transfected with short interfering RNAs (siRNAs) against PANX1 or control siRNA; n = 5. Error bars, s.e.m., *, P < 0.05; **, P < 0.01; ***, P < 0.001 by a one-tailed Student’s t-test. n represents biological replicates. Experiments b-f are representative and were replicated at least two times in independent cell lines. Bioluminescent and histological images are representative of the median.
Figure 3
Figure 3. Mechanosensitive PANX1 channels release ATP to increase cancer cell survival during intravascular membrane stretch
a, Representative images of mouse lungs stained for cancer cells and blood vessels (green and magenta, respectively, top panel), blood vessels (black, middle panel) or cleaved caspase-3 (white, bottom panel) 3 hrs after tail-vein injection of 1 × 10⁵ CN-LM1A cells. Arrows indicate endothelium. Scale bar, 10 µm. b, Quantification of PANX1-mediated CBX-sensitive ATP release from CN-LM1A and MDA-LM2 cells during 5 min exposure to isotonic (100% PBS) or hypotonic (70% PBS) solution; n = 4 (CN-LM1A isotonic), n = 3 (CN-LM1A hypotonic), n = 4 (MDA-LM2 isotonic), n = 4 (MDA-LM2). c, Quantification of viable, trypan blue-negative, CN34 and CN-LM1A cells after 1 hr extreme hypotonic (12.5% PBS) stretch; n = 4. d, Quantification of viable, trypan blue-negative CN34, CN-LM1A, MDA-MB-231 and MDA-LM2 cells after 1 hr extreme hypotonic (12.5% PBS) stretch; n = 4. e, Quantification of viable, trypan blue-negative, CN-LM1A cells after 1 hr incubation in extremely hypotonic (12.5% PBS) solution in the presence of scrambled peptide (100 µM), 10Panx1 peptide (100 µM) or 10Panx1 peptide (100 µM) and 100 µM ATP; n = 4. f, Quantification of viable, trypan blue-negative, MDA-LM2 cells after 1 hr incubation in extremely hypotonic (12.5% PBS) solution in the presence of scrambled peptide (100 µM), 10Panx1 peptide (100 µM) or 10Panx1 peptide (100 µM) and 100 µM ATP; n = 4. g, Quantification of viable, trypan blue-negative MDA-LM2 cells with 30 min Boyden chamber centrifugation (3,800 rpm) after cells were pre-treated for 10 min with 500 µM CBX or PBS; n = 4. Error bars, s.e.m., *, P < 0.05; **, P < 0.01; ***, P < 0.001 by a one-tailed Student’s t-test. n represents biological replicates. Experiments b–g are representative and were replicated at least two times with two independent cell lines.
Figure 4
Figure 4. Extracellular ATP enhances metastatic survival via breast cancer cell-autonomous purinergic signaling
a, Quantitative bioluminescence imaging of lung metastasis after tail-vein injection of 1 × 10⁶ metastatic CN-LM1A cells, expressing CD39 or control vector, into NS mice; n = 12. b, Lungs from day 42 were extracted, H&E stained, and the numbers of metastatic foci were quantified; n = 12. Scale bar, 1 mm. c, Quantitative imaging of lung bioluminescence at 6 hrs post tail-vein injection of 1 × 10⁵ CN-LM1A breast cancer cells pretreated (30 min) and co-injected with apyrase (2U/ml) into FVB/NJ mice; n = 6. d, Quantitative imaging of lung bioluminescence at 6 hrs post tail-vein injection of 4 × 10⁴ MDA-LM2 breast cancer cells pretreated (30 min) and co-injected with apyrase (2U/ml) into FVB/NJ mice; n = 6. e, Quantification of viable, trypan blue-negative, CN-LM1A cells after 15 min incubation in extremely hypotonic (12.5% PBS) solution in the presence of suramin (50 µM) or water vehicle; n = 4. f, Quantification of viable, trypan blue-negative MDA-LM2 cells after 15 min incubation in extremely hypotonic (12.5% PBS) solution in the presence of suramin (50 µM) or water vehicle; n = 4. g, Confocal microscopy images of HEK293T cells expressing PANX1-EGFP (green) and PANX1 1–89-mRFP (magenta). Co-localization at the plasma membrane is shown by channel overlay (white). Nuclear (nuc) DAPI stain is indicated. Arrowheads indicate PANX1-EGFP and PANX1 1–89-mRFP1 colocalization at the plasma membrane. Scale bar, 5 µm. h, Co-immunoprecipitation of PANX1 1–89-RFP from protein-crosslinked (2mM DSP) HEK293T cells expressing PANX1-EGFP, PANX1-EGFP and PANX1 1–89-mRFP, or PANX1 1–89-mRFP. Anti-GFP antibody was used to detect the wild-type PANX1 in complex with mutant PANX1 1–89. Molecular weights are indicated. i, Quantification of ATP release from HEK293T cells transfected with 5 µg wild-type PANX1 (n = 8), 5 µg wild-type PANX1 and 2.5 µg PANX1 1–89 (n = 9), 5 µg C-terminus-deleted PANX11–297 (n = 11) or 5 µg PANX11–297 and 2.5 µg PANX1 1–89 (n = 12). Error bars, s.e.m., ns, nonsignificant, *, P < 0.05; **, P < 0.01; ***, P < 0.001 by a one-tailed Student’s t-test. n represents biological replicates. Experiments c–f are representative and were replicated at least two times with independent cell lines. Bioluminescent and histological images are representative of the median.
Figure 5
Figure 5. Mutational augmentation of PANX1 channel activity enhances the metastatic efficiency of breast cancer cells
a, The numbers of vimentin positive breast cancer cells in the lung were counted one week after the extraction of size-matched mammary fat pad primary tumours generated by the orthotopic injection of 2.5× 10⁵ MDA-MB-468 cells expressing PANX1 1–89 or control vector into NOD scid gamma (NSG) mice; n = 4. Scale bar, 100 µm. b, Quantitative bioluminescence imaging of systemic metastasis one week after the extraction of size-matched mammary fat pad tumours generated by the orthotopic injection of 5 × 10⁵ HCC1806 breast cancer cells expressing PANX1 1–89 (n = 7) or control vector (n = 9) into NSG mice. c, Quantitative bioluminescence imaging of systemic metastasis after tail-vein injection of 1 × 10⁶ MDA-MB-468 breast cancer cells, expressing PANX1 1–89 or control vector, into NSG mice; n = 4. d, Ex vivo bioluminescence imaging of metastatic target organs (lung, liver and bone) 14 days after tain-vein injection of MDA-MB-468 cells. e, Quantitative imaging of lung bioluminescence 18 hrs post tail-vein injection of 1 × 10⁶ BT549 cells, expressing PANX1 1–89 or a control vector, into NSG mice; n = 6. f, In vivo quantification of luciferase-based caspase-3/7 activity at 3 and 6 hrs post tail-vein injection of 1 × 10⁶ BT549 cells, expressing either PANX1 1–89 or a control vector, into NS mice; n = 4 (3hr control), n = 5 (3hr PANX1 1–89), n = 4 (6hr control), n = 5 (6hr PANX1 1–89). g, Quantification of viable, trypan blue-negative BT549 cells expressing PANX1 1–89 or a control vector after 1 hr extreme hypotonic (12.5% PBS) stretch in the presence of succinate buffer or apyrase (2U/ml); n = 3. Error bars, s.e.m., *, P < 0.05; **, P < 0.01; ***, P < 0.001 by a one-tailed Student’s t-test. n represents biological replicates. Orthotopic experiments replicated in two independent triple-negative cell human breast cancer cell lines. Experiments e–g are representative and were replicated at least two times in at least two independent cell lines. Bioluminescent and histological images are representative of the median.
Figure 6
Figure 6. Pharmacological PANX1 channel blockade reduces breast cancer metastasis to the lungs
a, Schematic depicting the two in vivo CBX therapy regimens tested. b, Quantitative bioluminescence imaging of lung metastasis after tail-vein injection of 5 × 10⁴ MDA-LM2 breast cancer cells into NS mice pretreated daily with 25 mg/kg i.p. CBX or an equivalent volume of PBS for six days and with 100 mg/kg i.v. CBX or an equivalent volume of PBS 30 min prior to cancer cell injection; n = 8 (vehicle), n = 9 (CBX). c, Quantification of the number of metastatic foci at 2-weeks from H&E-stained lungs (left) and representative images from vimentin-stained lungs (right); n = 4. Scale bar, 0.5 mm. d, Quantitative bioluminescence imaging lungs 24 hrs after tail-vein injection of 1 × 10⁵ CN-LM1A breast cancer cells into NS mice pretreated with 25 mg/kg i.p. CBX or an equivalent volume of PBS at 19 and 2 hrs prior to cancer cell injection; n = 10. e, Lungs were extracted at 24 hrs, sectioned and stained for vimentin and the number of vimentin-positive cancer cells were quantified; n = 8 (vehicle), n = 7 (CBX). Scale bar, 0.25 mm. f, Quantitative bioluminescence imaging of breast cancer cells in the lungs at 4 weeks after tail-vein injection of 1 × 10⁵ CN-LM1A breast cancer cells into NS mice pretreated with 25 mg/kg i.p. CBX (n = 9) or an equivalent volume of PBS (n = 10) at 19 and 2 hrs prior to cancer cell injection. g, Quantification of the number of metastatic foci at 4-weeks from H&E-stained lungs; n = 10 (vehicle), n = 9 (CBX). Error bars, s.e.m., *, P < 0.05; **, P < 0.01; ***, P < 0.001 by a one-tailed Student’s t-test. n represents biological replicates. Therapeutic PANX1 inhibition experiments were performed using two independent triple negative breast cancer cell lines. Bioluminescent and histological images are representative of the median.
Figure 7
Figure 7. Proposed working-model of PANX1-mediated ATP release as a regulator of intravascular metastatic cell survival
Schematic showing stretch-induced ATP release through mechanosensitive PANX1 channels activating a cancer cell-autonomous purinergic signaling pathway that inhibits cell death during mechanical stress in the microvasculature of target organs. Those cancer cells enabled to secrete the levels of extracellular ATP necessary to permit intravascular survival via autocrine purinergic signaling pathways, or the adjacent cells lodged within the same tumor cell cluster, are afforded an opportunity to undergo the subsequent steps of the metastatic cascade—extravasation, colonization, re-initiation and proliferation.

Comment in

References

    1. ZEIDMAN, I. The fate of circulating tumors cells. I. Passage of cells through capillaries. Cancer Res. 1961;21:38–39. - PubMed
    1. Weiss L, Nannmark U, Johansson BR, Bagge U. Lethal deformation of cancer cells in the microcirculation: a potential rate regulator of hematogenous metastasis. Int J Cancer. 1992;50:103–107. - PubMed
    1. Wong CW, et al. Apoptosis: an early event in metastatic inefficiency. Cancer Res. 2001;61:333–338. - PubMed
    1. Kienast Y, et al. Real-time imaging reveals the single steps of brain metastasis formation. Nat Med. 2010;16:116–122. - PubMed
    1. Weiss L. Biomechanical interactions of cancer cells with the microvasculature during hematogenous metastasis. Cancer Metastasis Rev. 1992;11:227–235. - PubMed

Publication types

MeSH terms

Associated data