

Dietary calcium and zinc deficiency risks are decreasing but remain prevalent
- PMID: 26098577
- PMCID: PMC4476434
- DOI: 10.1038/srep10974
Dietary calcium and zinc deficiency risks are decreasing but remain prevalent
Abstract
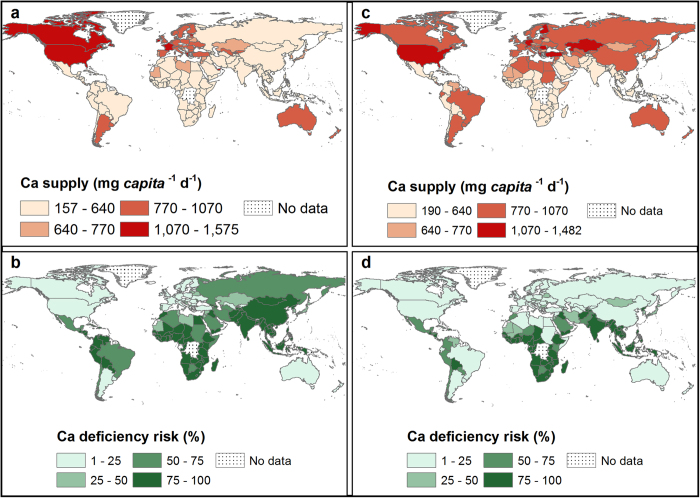
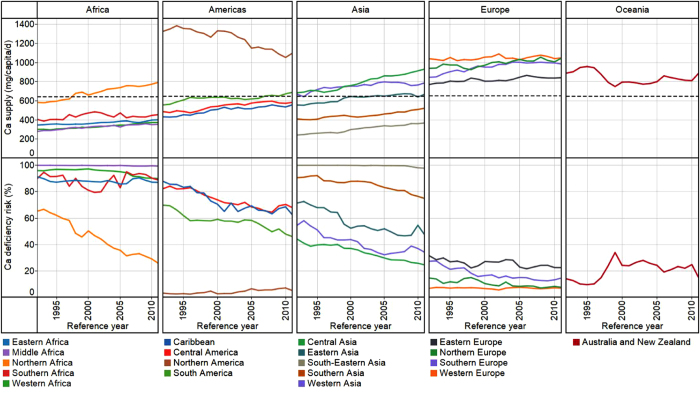
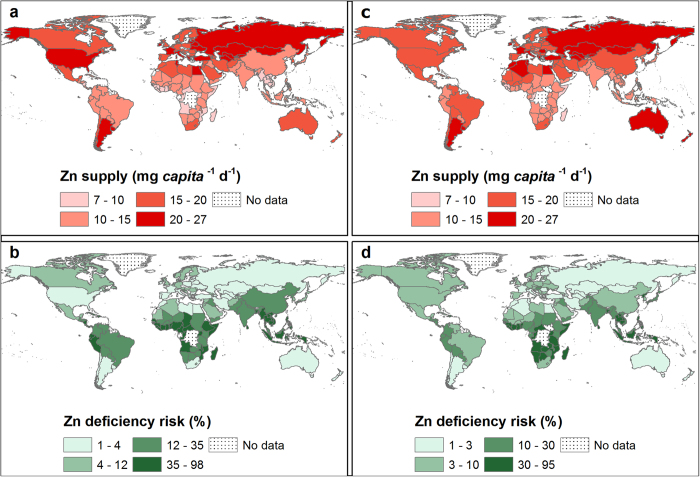
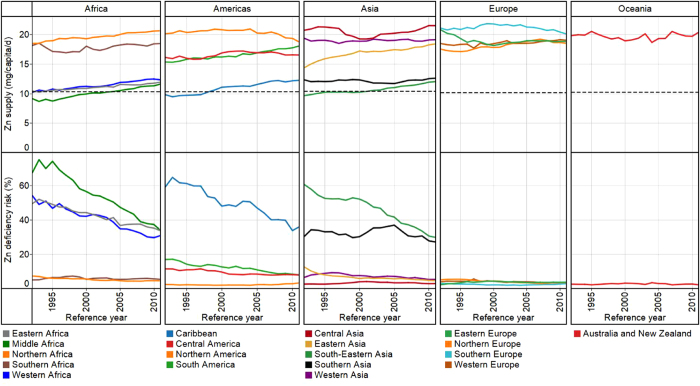
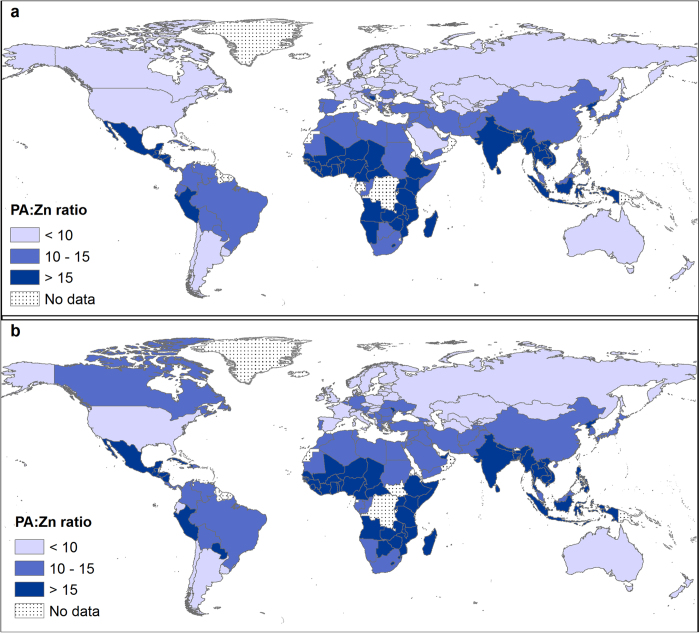
Globally, more than 800 million people are undernourished while >2 billion people have one or more chronic micronutrient deficiencies (MNDs). More than 6% of global mortality and morbidity burdens are associated with undernourishment and MNDs. Here we show that, in 2011, 3.5 and 1.1 billion people were at risk of calcium (Ca) and zinc (Zn) deficiency respectively due to inadequate dietary supply. The global mean dietary supply of Ca and Zn in 2011 was 684 ± 211 and 16 ± 3 mg capita(-1) d(-1) (± SD) respectively. Between 1992 and 2011, global risk of deficiency of Ca and Zn decreased from 76 to 51%, and 22 to 16%, respectively. Approximately 90% of those at risk of Ca and Zn deficiency in 2011 were in Africa and Asia. To our knowledge, these are the first global estimates of dietary Ca deficiency risks based on food supply. We conclude that continuing to reduce Ca and Zn deficiency risks through dietary diversification and food and agricultural interventions including fortification, crop breeding and use of micronutrient fertilisers will remain a significant challenge.
Figures
References
-
- Stein A. J. Rethinking the measurement of undernutrition in a broader health context: Should we look at possible causes or actual effects? Global Food Secur. 3, 193–199 (2014).
-
- FAO, IFAD & WFP. The state of food insecurity in the World: The multiple dimensions of food security. (Food and Agriculture Organization of the United Nations, International Fund for Agricultural Development, World Food Programme, Rome, 2013).
-
- FAO. Rome declaration on World food security. (1996). Available at: http://www.fao.org/wfs/index_en.htm. (Accessed: 27 October 2014).
-
- UN. The Millennium Development Goals report 2013 (New York, 2013).
Publication types
MeSH terms
Substances
LinkOut - more resources
Full Text Sources
Other Literature Sources
Medical
Molecular Biology Databases
