. 2015 Sep 8;6(26):22081-97.
doi: 10.18632/oncotarget.4203.

Activation of PI3K/Akt/mTOR signaling in the tumor stroma drives endocrine therapy-dependent breast tumor regression

Affiliations

Activation of PI3K/Akt/mTOR signaling in the tumor stroma drives endocrine therapy-dependent breast tumor regression

María Laura Polo et al. Oncotarget. .

Erratum in

Abstract

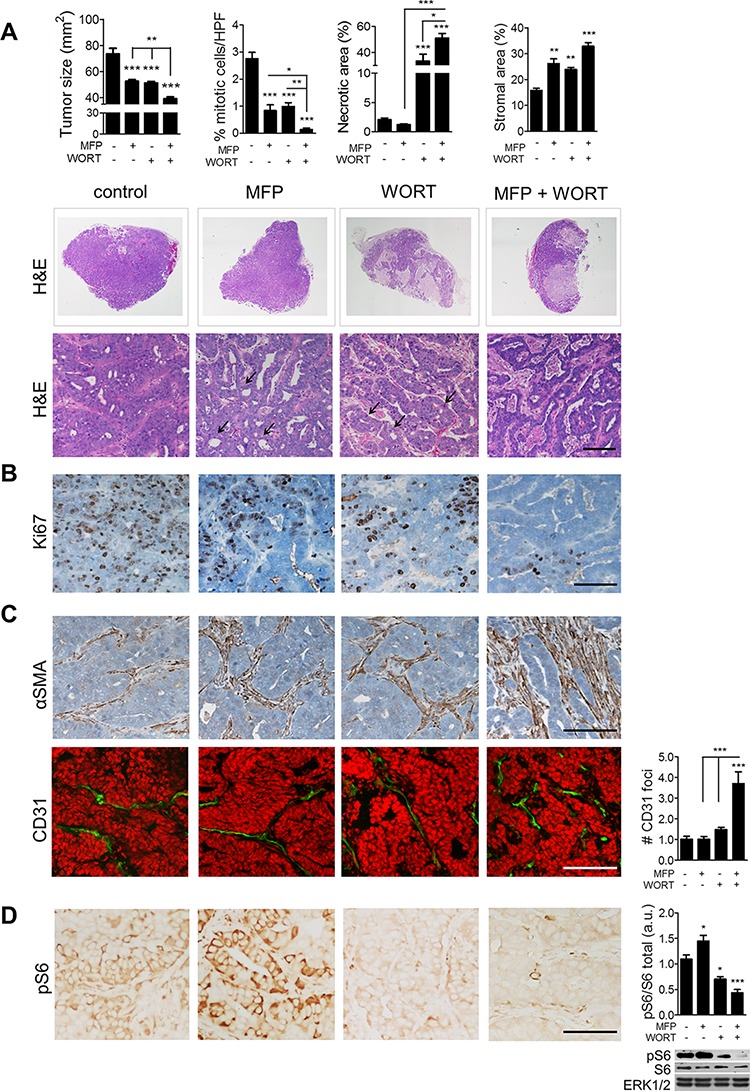
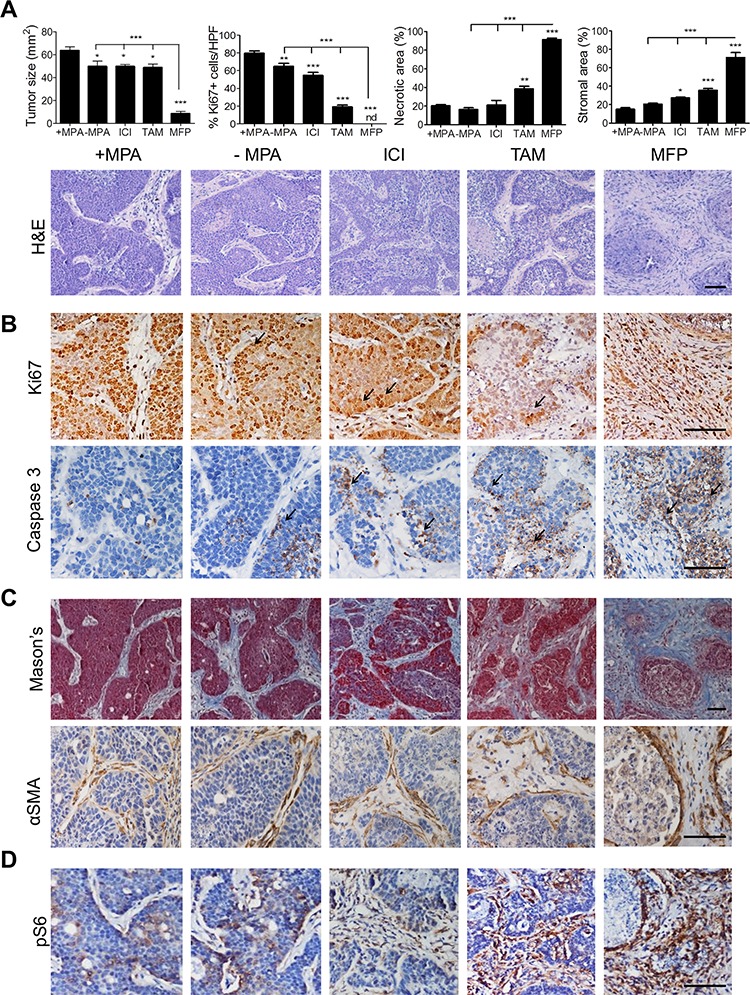
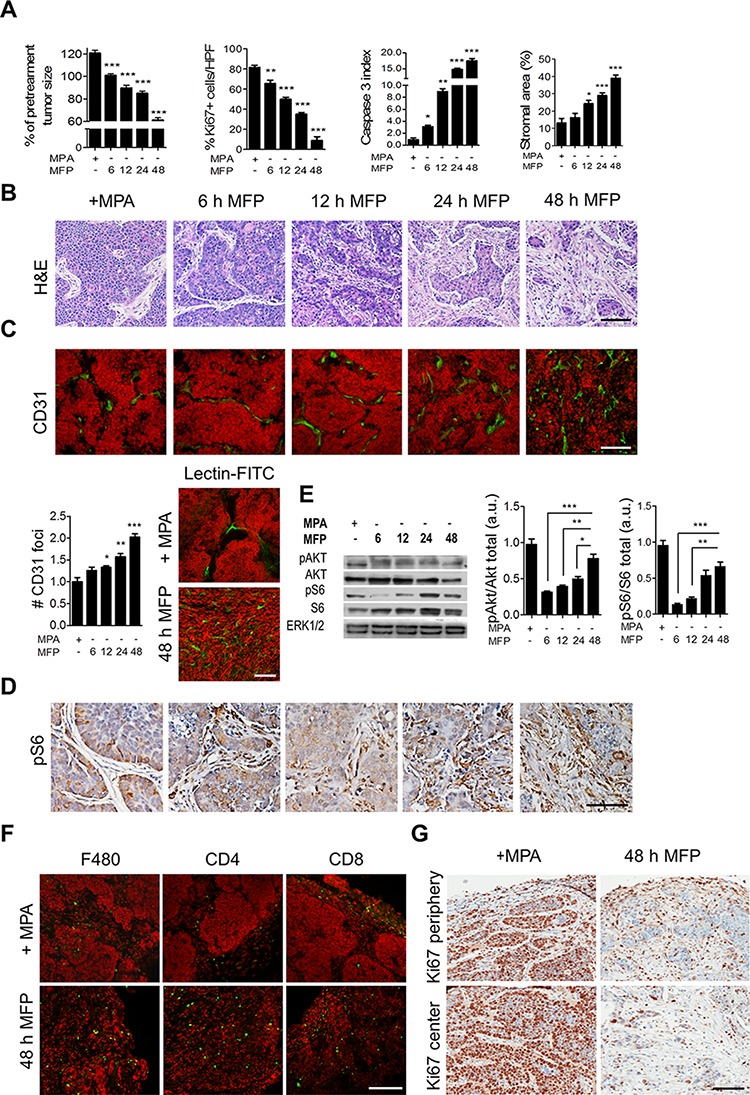
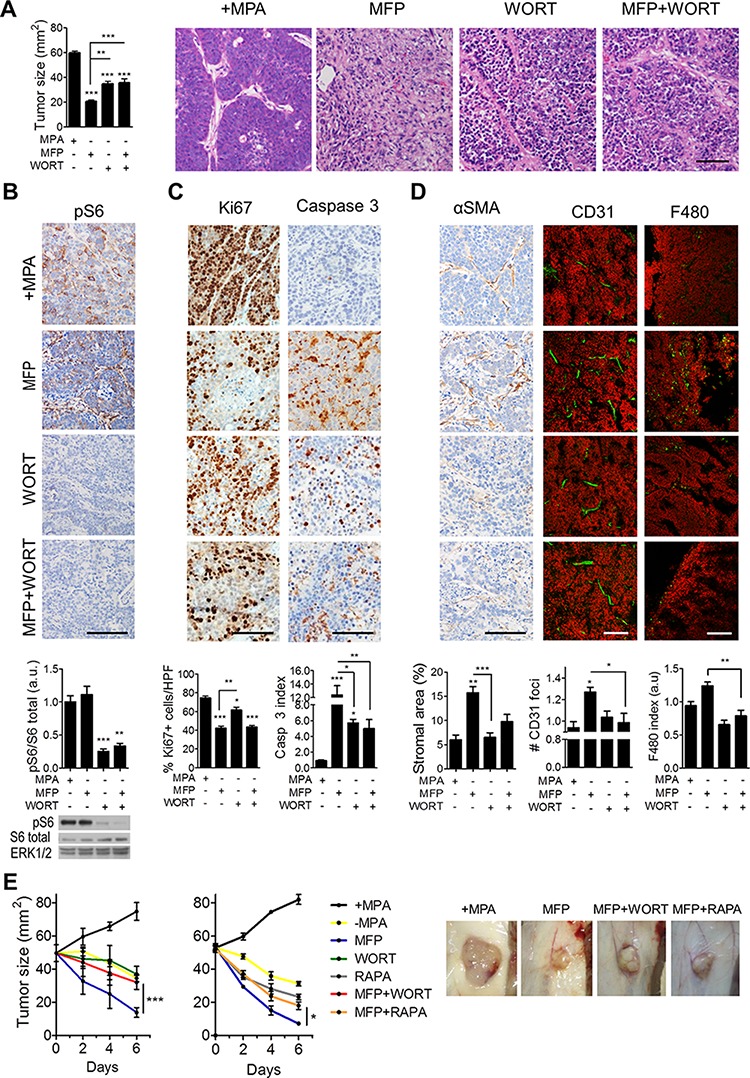
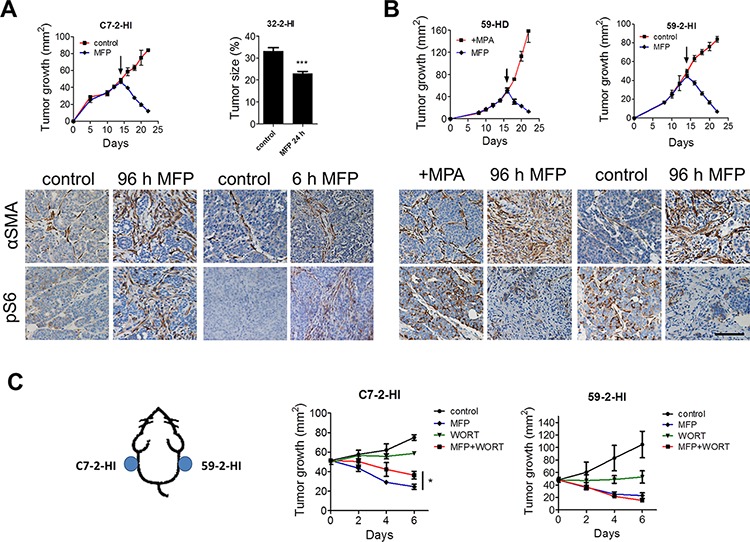
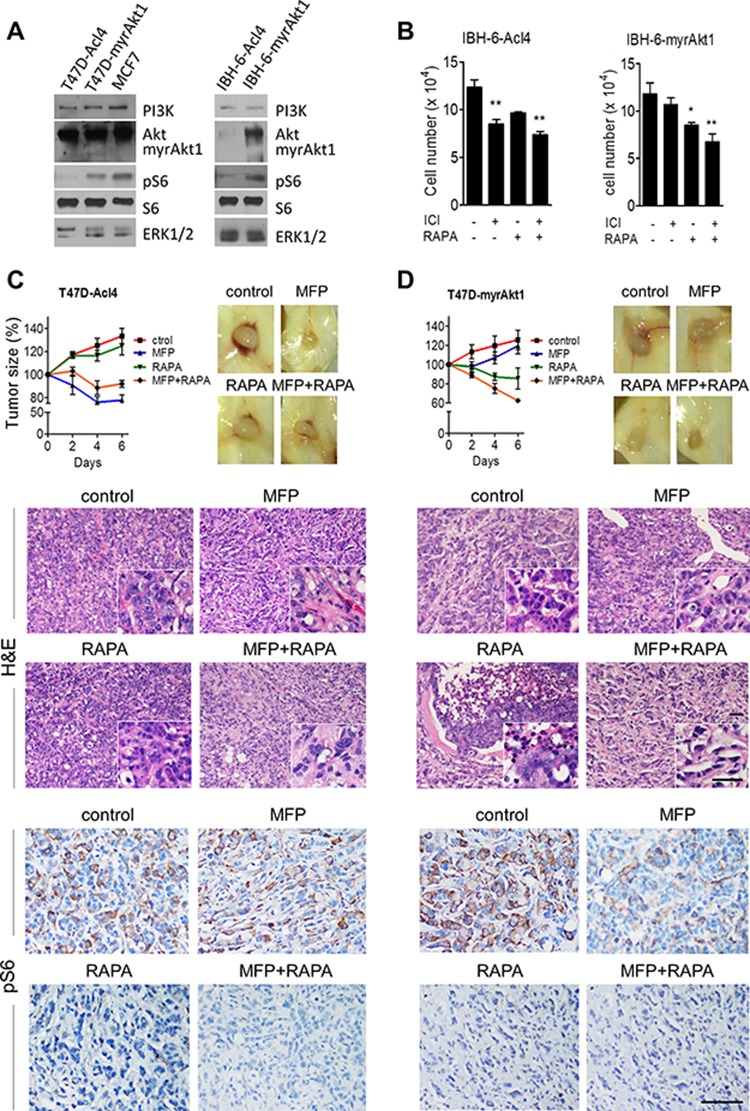
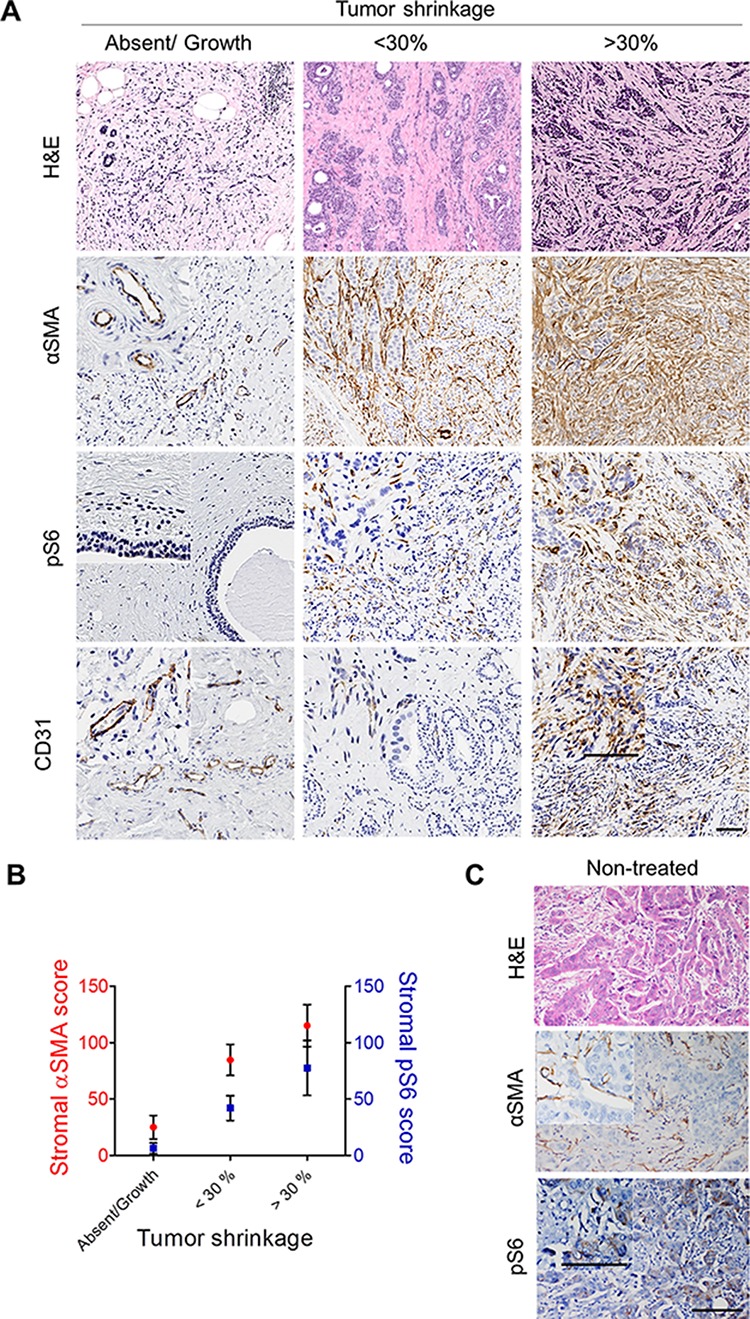
Improved efficacy of neoadjuvant endocrine-targeting therapies in luminal breast carcinomas could be achieved with optimal use of pathway targeting agents. In a mouse model of ductal breast carcinoma we identify a tumor regressive stromal reaction that is induced by neoadjuvant endocrine therapy. This reparative reaction is characterized by tumor neovascularization accompanied by infiltration of immune cells and carcinoma-associated fibroblasts that stain for phosphorylated ribosomal protein S6 (pS6), downstream the PI3K/Akt/mTOR pathway. While tumor variants with higher PI3K/Akt/mTOR activity respond well to a combination of endocrine and PI3K/Akt/mTOR inhibitors, tumor variants with lower PI3K/Akt/mTOR activity respond more poorly to the combination therapy than to the endocrine therapy alone, associated with inhibition of stromal pS6 and the reparative reaction. In human breast cancer xenografts we confirm that such differential sensitivity to therapy is primarily determined by the level of PI3K/Akt/mTOR in tumor cells. We further show that the clinical response of breast cancer patients undergoing neoadjuvant endocrine therapy is associated with the reparative stromal reaction. We conclude that tumor level and localization of pS6 are associated with therapeutic response in breast cancer and represent biomarkers to distinguish which tumors will benefit from the incorporation of PI3K/Akt/mTOR inhibitors with neoadjuvant endocrine therapy.

Keywords: PI3K/Akt pathway; breast cancer; neoadjuvant endocrine therapy; tumor stroma.


Conflict of interest statement

CONFLICTS OF INTEREST

The authors have no competing interests to declare.

Figures

Figure 1
Figure 1. Combination of MFP and WORT improves C4-HI tumor regression
C4-HI tumors of 50 mm2 were treated with MFP (12 mg/kg/day), WORT (1 mg/kg/day), MFP+WORT, or saline (control) for 48 h. A. Top: Tumor size diminished further by MFP+WORT than by MFP or WORT itself. Mitotic cells, necrotic and stromal areas were quantified in H&E. Middle: H&E staining in whole FFPE tumor sections reveals greater necrosis (pink areas) after combination therapy. Bottom: High magnification images show tissue remodeling with signs of differentiation (arrows show ductal-like structures). B. IHC for Ki67 confirms the quantification of mitotic cells. C. IHC for αSMA and IF for CD31. Nuclei were stained in red with PI. Quantification shows that the number of CD31-positive foci increased after combination therapy. D. Left: IHC for pS6 in Ser240/244 shows that both tumor and stromal levels diminished with WORT. Nuclei were not counterstained with hematoxilyn to evidence pS6 signal. Right: WB revealing total and pS6, and ERK1/2 as a loading control. Quantification shows that MFP increased whereas WORT reduced pS6 levels. Bar 100 μm.
Figure 2
Figure 2. MFP is the endocrine agent that induces the strongest stromal reaction and C4-HD tumor regression
When C4-HD tumors reached 50 mm2, MPA depot was removed and mice were treated with ICI (5 mg), TAM (5mg/kg/day), MFP or saline (−MPA) for 48 h. +MPA group was sham-operated and treated with saline. A. Top: Final tumor size, % Ki67-positive cells, necrotic and stromal areas were quantified in IHC or H&E. Bottom: H&E staining reveals that C4-HD endocrine-treated tumor displayed tissue remodeling with intense stromal invasion. B. IHC for Ki67 and caspase 3. Arrows indicate that in residual tumor tissue both proliferative (Ki67-positive) and apoptotic (caspase 3-positive) cells were localized to the epithelial edge in contact with the invading stroma. C. Top: Mason's Trichrome (blue: collagen-rich fibrillary stroma; red: parenchymal nuclei) confirmed the composition of regressive stroma. Bottom: IHC for αSMA shows intense signal in the regressive stromal edge facing residual tumor. D. pS6 staining after treatment decreased in C4-HD tumor parenchyma and increased in tumor stroma. Bar 100 μm.
Figure 3
Figure 3. Time course and cellular mechanisms involved in stromal reaction in C4-HD tumors
C4-HD tumors were treated with MFP for 6, 12, 24 or 48 h. A. Quantification of tumor size (% of pretreatment size), % Ki67-positive cells, caspase 3 and stromal indexes. Tumor's shrinkage, cytostasis, apoptosis and stromal area increased after MFP treatment in a time-dependent fashion. B. H&E staining shows tissue remodeling. C. Top: IF for CD31 with nuclei stained in red. Bottom, left: quantification of CD31 foci. Bottom, right: labeling with fluorescent lectins. D. IHC shows pS6-positive advancing CAFs after MFP treatment. E. WB reveals total and pAkt in Ser473, pS6, and ERK1/2. MFP induced time-dependent Akt and S6 activation. F. IF for F480, CD4 and CD8. G. IHC for Ki67 shows positive cells in tumor's periphery and center. Bar 100 μm.
Figure 4
Figure 4. Inhibition of PI3K/Akt/mTOR pathway interferes with the stromal reaction induced by endocrine therapy in C4-HD tumors
C4-HD tumors were treated for 48 h with MFP, WORT or the combination. A. Left: MFP-treated tumors showed smaller size compared to WORT or MFP+WORT-treated tumors. Right: H&E staining reveals greater tissue remodeling in MFP-treated tumors. B. Top: IHC for pS6 shows that WORT inhibited MFP-induced levels. Bottom: WB revealing total and pS6, and ERK1/2. C. IHC shows that after 12 h of treatment, WORT reduced Ki67 and induced caspase 3 to a lesser extent than MFP. D. IHC for αSMA and IF for CD31 and F480, show that MFP, but not WORT, affected stromal area, number of CD31 foci and macrophages infiltration. E. Left: C4-HD tumor sizes after 6 days of treatment with WORT or RAPA (5 mg/kg/day). Combination with WORT or RAPA significantly impaired MFP-induced regression. Right: Representative photographs of treated tumors. Bar: 100 μm.
Figure 5
Figure 5. Tumor level of PI3K/Akt pathway determines the extent of stromal reaction in response to therapy
A & B. When C7–2-HI, 32–2-HI, 59-HD or 59–2-HI tumor variants reached a size of 50 mm2 (arrows), mice were treated with MFP or saline solution (control). Tumors were treated for 6 days, except for 32–2-HI tumors that were treated for only 6 or 24 h since its response is extremely fast. Top: Growth curves show that MFP caused tumor regression. For 32–2-HI bar graph represents tumor size after 24 h of treatment. Bottom: IHC for αSMA and pS6 previous to MFP treatment shows that parenchymal pS6 levels were lower in C7–2-HI and 32–2-HI than in 59-HD and 59–2-HI tumors. After MFP treatment, pS6 increased in the stromal compartment in C7–2-HI and 32–2-HI tumors, and it reduced in the parenchymal compartment in 59-HD and 59–2-HI tumors. C. Left: C7–2-HI and 59–2-HI tumors were transplanted simultaneously in the same mouse in opposite flanks and when tumors reached a size of 50 mm2, treatments started (day 0) with MFP, WORT or the combination, and continued for 6 days. Right: Tumor sizes show that C7–2-HI tumors responded poorly to WORT whereas 59–2-HI tumors reduced tumor size after WORT treatment. Bar: 100 μm.
Figure 6
Figure 6. Tumor cell level of PI3K/Akt pathway determines response to therapy
A. WB from cellular extracts revealing PI3K, Akt, total and pS6, and ERK1/2. Akt antibody detected both the endogenous and the myristoylated deleted myrAkt1variant. MCF-7 cells were used as a control. B. IBH-6-Acl4 and IBH-6-myrAkt1 cells were treated with ICI 1 μM, RAPA 0.1 μM or the combination for 6 days, and final cell number was counted. C&D. T47D-Acl4 and T47D-myrAkt1 cells were injected into NOD/SCID mice. Tumors of 30 mm2 were treated with MFP, RAPA (5 mg/kg/day) or the combination, and continued for 6 days. Top, left: Tumor sizes expressed as % of pretreatment size. T47D-Acl4 tumors responded mainly to MFP whereas T47D-myrAkt1 tumors responded mainly to RAPA. Representative photographs (right) and H&E (center) of control and treated tumors. Inserts: T47D-Acl4 tumors show MFP-induced blood vessels. Bottom: IHC for pS6 shows that stromal levels were higher in T47D-Acl4 than in T47D-myrAkt1 tumors after MFP treatment. Bar: 50 μm.
Figure 7
Figure 7. αSMA correlates with tumor reduction and stromal pS6 after neoadjuvant endocrine therapy
Breast tumor samples were classified according to the percentage of tumor reduction, between no response (increase or no change in tumor mass) n = 4, intermediate response (less than 30% reduction) n = 12, or better response (more than 30% reduction) n = 8. A. H&E and IHC for αSMA, pS6 and CD31 in one representative tumor of each group. The amount and intensity of αSMA and stromal pS6 label increased according to % of tumor reduction. Inserts: αSMA, pS6 and CD31 were mainly localized in active areas of advancing stroma. B. The entire cohort of 24 patients was distributed for the graph in terms of tumor reduction with the arbitrary cut off of 30% and analyzed as a whole for correlation between the three parameters. Stromal αSMA correlated significantly with stromal pS6 score (p = 0.039, Spearman Rho) and with the % of tumor reduction (p = 0.036, Spearman Rho). C. H&E and IHC for αSMA and pS6 in tumor areas of one representative non-treated patient, showing the staining of pS6 in the parenchyma and its absence in the stroma. Bar: 100 μm.

References

    1. Abrial C, Durando X, Mouret-Reynier MA, Thivat E, Bayet-Robert M, Nayl B, et al. Role of neo-adjuvant hormonal therapy in the treatment of breast cancer: a review of clinical trials. Int.J.Gen.Med. 2009;2:129–40. - PMC - PubMed
    1. Charehbili A, Fontein DB, Kroep JR, Liefers GJ, Mieog JS, Nortier JW, et al. Neoadjuvant hormonal therapy for endocrine sensitive breast cancer: a systematic review. Cancer Treat.Rev. 2014;40:86–92. - PubMed
    1. Lange CA, Sartorius CA, Abdel-Hafiz H, Spillman MA, Horwitz KB, Jacobsen BM. Progesterone receptor action: translating studies in breast cancer models to clinical insights. Adv.Exp.Med.Biol. 2008;630:94–111. - PubMed
    1. Obr AE, Edwards DP. The biology of progesterone receptor in the normal mammary gland and in breast cancer. Mol.Cell Endocrinol. 2012;357:4–17. - PMC - PubMed
    1. Goyeneche AA, Telleria CM. Antiprogestins in gynecological diseases. Reproduction. 2015;149:R15–R33. - PMC - PubMed

Publication types

MeSH terms