. 2015 Jul;21(7):751-9.
doi: 10.1038/nm.3886. Epub 2015 Jun 22.

Subclonal diversification of primary breast cancer revealed by multiregion sequencing

Affiliations

Subclonal diversification of primary breast cancer revealed by multiregion sequencing

Lucy R Yates et al. Nat Med. 2015 Jul.

Abstract

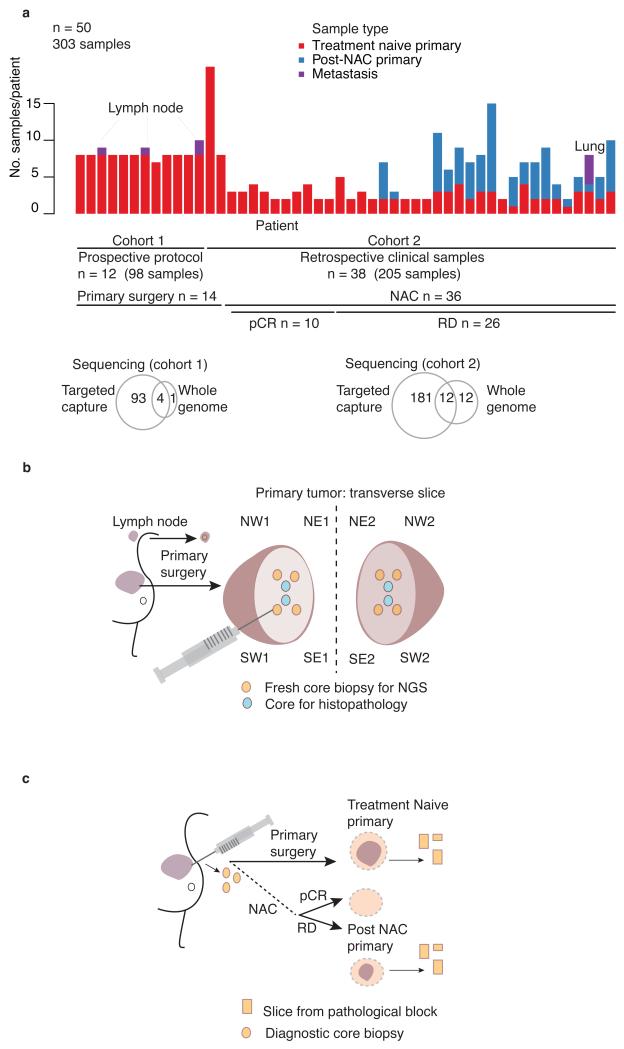
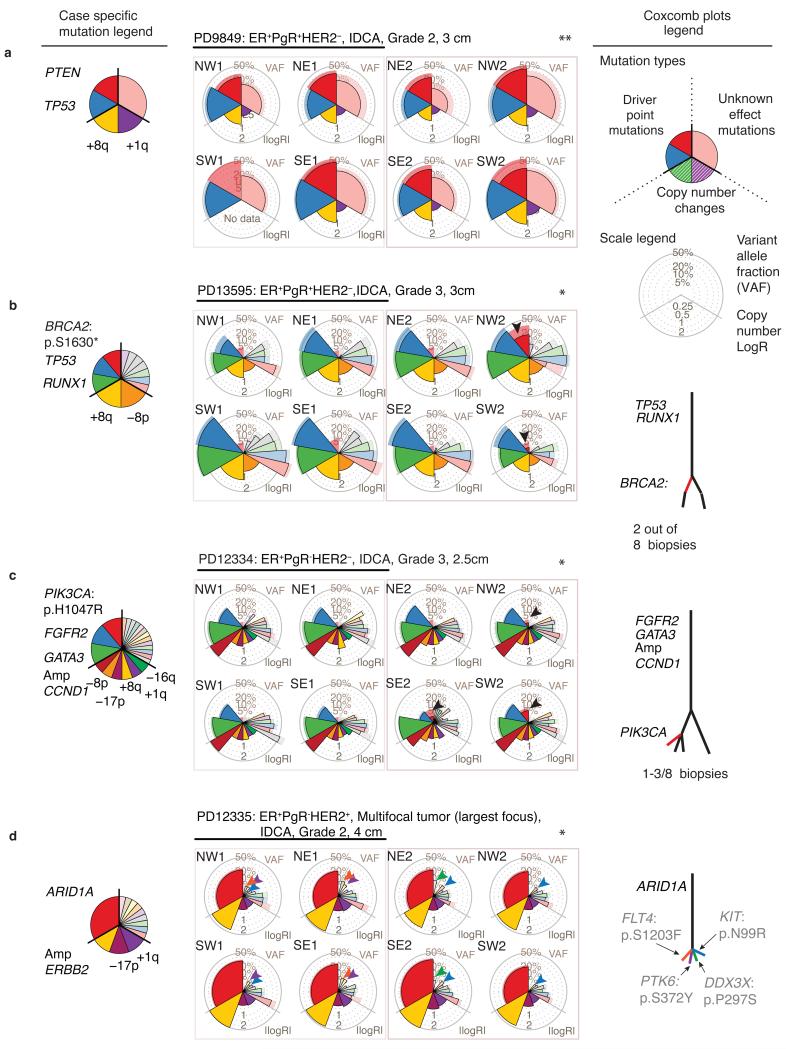
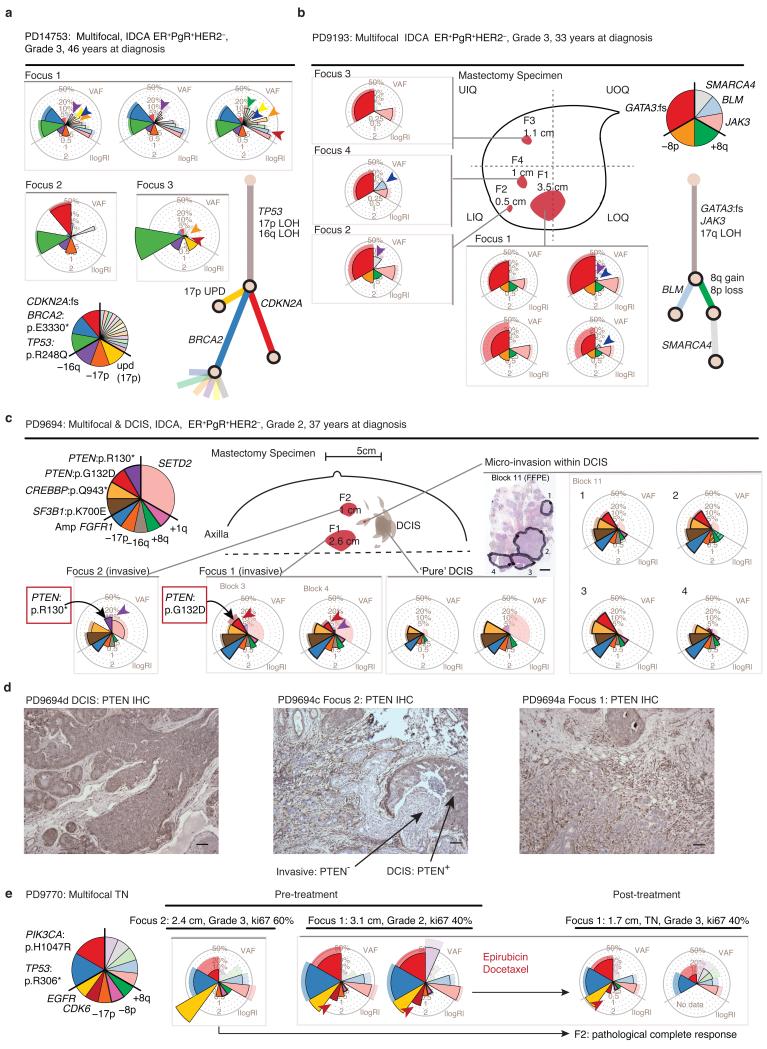
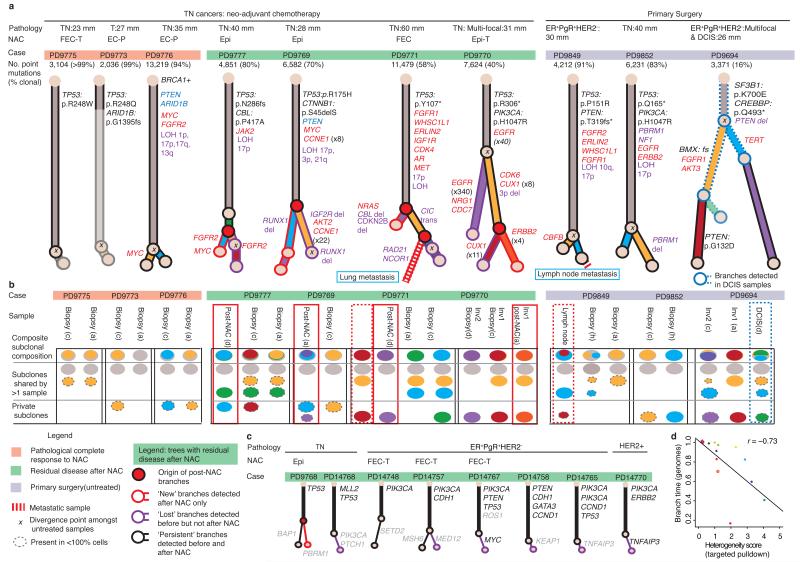
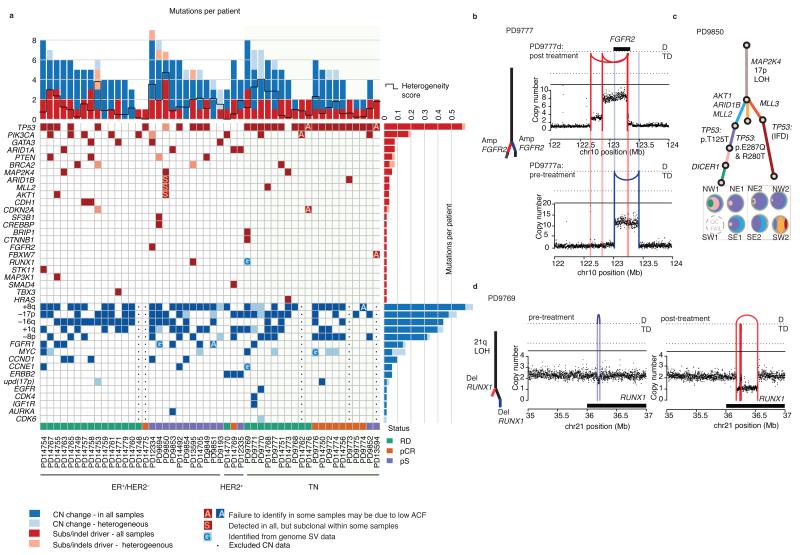
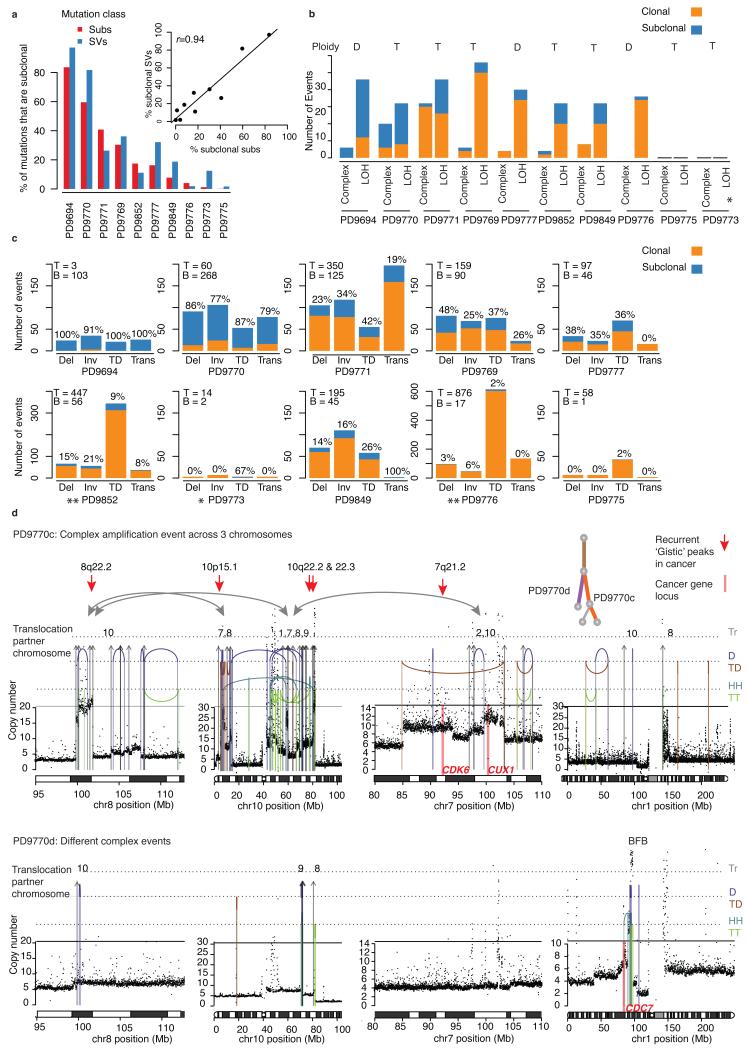
The sequencing of cancer genomes may enable tailoring of therapeutics to the underlying biological abnormalities driving a particular patient's tumor. However, sequencing-based strategies rely heavily on representative sampling of tumors. To understand the subclonal structure of primary breast cancer, we applied whole-genome and targeted sequencing to multiple samples from each of 50 patients' tumors (303 samples in total). The extent of subclonal diversification varied among cases and followed spatial patterns. No strict temporal order was evident, with point mutations and rearrangements affecting the most common breast cancer genes, including PIK3CA, TP53, PTEN, BRCA2 and MYC, occurring early in some tumors and late in others. In 13 out of 50 cancers, potentially targetable mutations were subclonal. Landmarks of disease progression, such as resistance to chemotherapy and the acquisition of invasive or metastatic potential, arose within detectable subclones of antecedent lesions. These findings highlight the importance of including analyses of subclonal structure and tumor evolution in clinical trials of primary breast cancer.


Figures

Figure 1
Figure 1. Study design
(a) Summary of samples within cohorts 1 and 2. n, number of subjects. (b) Geographical sampling approach: NW, northwest; NE, northeast; SW, southwest; SE, southeast within tumor hemisphere 1 and 2, plus 1 or 2 involved lymph nodes in 3 cases. For multifocal cancers all samples are taken from the single largest focus. (c) Source of retrospective clinical samples in relation to primary tumor management. RD, residual disease; NAC, Neo-adjuvant chemotherapy; pCR, pathological complete response.
Figure 2
Figure 2. Systematic sampling reveals spatial and temporal tumor evolution
(a–d) Somatic mutation genotypes, presented as coxcomb plots, overlaid on the sample schema described in Figure 1b. Point estimates of the variant allele fraction (VAF) or copy number (LogR) is represented by the lateral extension of the outlined wedge. Pale wedges lacking an outline represent the 95% confidence interval – if coverage is low the confidence of the VAF is reduced and the pale wedge appears beyond the point estimate. ER, Estrogen receptor; PgR, Progesterone receptor; IDCA, invasive ductal carcinoma. Driver mutations and arm level copy number gains (+) and losses (−) detected in each cancer are annotated in the case-specific mutation legend. Significant heterogeneity amongst point mutations in individual cancers is determined using generalized linear models (glm) and Benjamini-Hochberg correction: *, q < 0.05 indicates significant point mutational heterogeneity; **, non-significance. (a) No detected intra-tumoral heterogeneity (q=0.8). (b–c) Local expansion of subclones (red arrow heads). (d) Complex intermixing of subclones: Individual mutations (each highlighted with a different colored arrowhead) appear in different combinations of samples. Mock phylogenetic trees are also shown: The presence and absence of mutations across related samples indicate distinct subclones and dictate the branching structure, the number of mutations in each subclone determine branch lengths. See ftp://ftp.sanger.ac.uk/pub/cancer/YatesEtAl/ for coxcomb and heatmap plots for every cancer in the cohort.
Figure 3
Figure 3. Subclonal patterns in multifocal breast cancers
(a–c,e) Targeted capture genomic analysis of subclonal structure in four subjects’ multifocal cancers. Coxcomb plots and mock phylogenetic trees are generated as described in Figure 2. Plots from multiple samples from the same tumor focus are grouped together within grey outlined boxes. Colored arrow-heads identify subclones that are shared by fewer than all invasive foci. (a) Case PD14753: Genotypes of 5 samples from 3 disease foci indicate deep branching of the tree, driver heterogeneity and subclone intermingling across foci. (b) Case PD9193: Genotypes of 7 samples from 4 disease foci demonstrate subclone intermingling. Orientation within mastectomy specimen: UIQ = Upper Inner Quadrant, UOQ = Upper Outer quadrant, LIQ = Lower Inner Quadrant, LOQ = Lower Outer Quadrant. (c) Case PD9694: Parallel evolution with 2 unique PTEN driver mutations in different foci. Schematic representation of pathological features in the mastectomy specimen. Dashed line represents the deep (chest wall) margin. Scale represents 3mm in a formalin fixed paraffin embedded tissue section. (d) Case PD9694: PTEN immunohistochemistry shows PTEN protein to be present in DCIS but lost in invasive disease foci 1 and 2. Scale = 100 microns. (e) Genotypes of 3 samples from 2 disease foci in PD9770, prior to chemotherapy and 2 samples from Focus 1 after neoadjuvant chemotherapy. Focus 2 exhibited a pathological complete response to 3 cycles of each chemotherapy agent.
Figure 4
Figure 4. The genome-wide spectrum of branching evolution
(a) Phylogenetic trees generated by clustering genome-wide point mutation data from 10 multiregion sampled primary cancers. Relative branch lengths are determined from the proportion of mutations in each branch. An ‘x’ indicates the most recent common ancestor inferred from treatment-naive samples alone. (a and c) Cases where post-treatment samples are available (green highlighting bar above trees): Red node(s) indicate where subclones only detected after treatment (branches with red outlines) emerged within the tree. Branches only detected amongst pre-treatment samples are indicated by a purple outline, black branches indicate detection in both pre- and post-chemotherapy samples. Likely driver genes are colored according to mutation type: amplification (red text), homozygous deletion (blue text), point mutation (black text) and potentially relevant structural variants (purple text). Cancer type is specified: triple negative = TN, DCIS = ductal carcinoma in situ. Type of neo-adjuvant chemotherapy (NAC): Epi, Epirubicin; T, Docetaxel; P, Paclitaxel; (F)EC, (Fluorouracil), Epirubicin, Cyclophosphamide (b) The subclonal composition of individual samples where colors correspond to the tree branch in (a) and the area is proportional to the percentage of cells in that sample that contain the mutations in that branch. (c) Mock trees inferred from targeted capture data for samples with pre- and post-treatment samples. Six samples with no branching are not presented. Branches are colored as stated above for genome data. (d) Pearson’s correlation for heterogeneity estimates from whole genome and targeted capture data.
Figure 5
Figure 5. Subclonal driver mutations and parallel evolution
(a) Heatmap of somatic driver mutations and copy number changes identified from genomic sequencing of 50 tumors. Single base substitutions and small insertions and deletions are reported by red squares, intense red when detected in all associated samples from the tumor (omnipresent), pink when present in less than all samples, or clearly subclonal. Omnipresent and heterogeneous copy number changes are reported by dark-blue and light-blue squares respectively. (b–d) Three examples of parallel evolution, see fourth example in Figure 3c–d and 4a (PD9694). (c) One possible phylogenetic tree and sample subclonal compositions inferred from targeted capture data (as described in Fig. 2 and 4c legends) with TP53 mutations arising on 3 branches. See also Supplementary Figure 3 (PD9850). (b) Multiple independent episomal amplification events in FGFR2 and (d) two independent deletions in RUNX1 detected in 2 samples from the same cancer. In copy number graphs (b and d) the black dots reflect the number of copies of genomic DNA from that specific locus, with a level greater than 2 reflecting a net gain and a value less than 2 reflecting a loss. Reconstructed rearrangement breakpoints are represented by colored lines according to whether they are detectable in pre (purple) or post (red) chemotherapy samples only. The type of event is indicated by the position of the arc joining the breakpoints: D, deletion; TD, tandem duplication.
Figure 6
Figure 6. Structural variants shape cancer evolution
(a) Comparison of the proportion of substitutions (subs) and structural variants (SVs) that are subclonal in each cancer. Inset graph shows scatterplot and Pearson’s correlation coefficient (r). (b) Clonal and subclonal complex rearrangements (as described in the Supplementary Note section) and arm level loss of heterozygosity (LOH) events. The average genome-wide ploidy is indicated: T = tetraploid (4 copies), D = diploid (2 copies). (c) Breakdown of clonal and subclonal structural variants by category (inversion = Inv, deletion = Del, inter-chromosomal translocation = Trans, tandem duplication = TD). For each cancer the total number of mutations assigned to the trunk (T) or branches (B) is indicated in the top left corner, while the proportion of each mutation type that is subclonal (i.e. within the branches) is added as a percentage above each bar. (d) Case PD9770: Examples of two subclonal, complex structural rearrangements arising on separate branches of the phylogenetic tree. In PD9770c structural rearrangements link multiple regions of amplification across 3 chromosomes. Amplifications include multiple genomic regions that have been previously identified as recurrently amplified in cancers and are represented by red arrows while the locations of known oncogenes are marked by pink bars. In PD9770d these events are not seen but a breakage fusion-bridge event amplifies segments including the CDC7 gene. Rearrangement types include: Interchromosomal translocations (Tr), tail-to-tail inversions = TT (green), head-to-head inversions = HH (orange), tandem duplication = TD (orange), deletions = D (purple)

References

    1. Nik-Zainal S, et al. The life history of 21 breast cancers. Cell. 2012;149:994–1007. - PMC - PubMed
    1. Navin N, et al. Tumour evolution inferred by single-cell sequencing. Nature. 2011;472:90–94. - PMC - PubMed
    1. Shah SP, et al. The clonal and mutational evolution spectrum of primary triple-negative breast cancers. Nature. 2012;486:395–399. - PMC - PubMed
    1. Meric-Bernstam F, et al. Concordance of genomic alterations between primary and recurrent breast cancer. Molecular cancer therapeutics. 2014;13:1382–1389. - PMC - PubMed
    1. Ding L, et al. Genome remodelling in a basal-like breast cancer metastasis and xenograft. Nature. 2010;464:999–1005. - PMC - PubMed

Online methods references

    1. Denkert C, et al. Tumor-associated lymphocytes as an independent predictor of response to neoadjuvant chemotherapy in breast cancer. Journal of clinical oncology : official journal of the American Society of Clinical Oncology. 2010;28:105–113. - PubMed
    1. Bolli N, et al. Heterogeneity of genomic evolution and mutational profiles in multiple myeloma. Nature communications. 2014;5:2997. - PMC - PubMed
    1. Li H, Durbin R. Fast and accurate long-read alignment with Burrows-Wheeler transform. Bioinformatics. 2010;26:589–595. - PMC - PubMed
    1. Supek F, Minana B, Valcarcel J, Gabaldon T, Lehner B. Synonymous mutations frequently act as driver mutations in human cancers. Cell. 2014;156:1324–1335. - PubMed
    1. Gentleman RC, et al. Bioconductor: open software development for computational biology and bioinformatics. Genome biology. 2004;5:R80. - PMC - PubMed

Substances