. 2015 Jun 23:13:43.
doi: 10.1186/s12915-015-0157-x.

Shell neurons of the master circadian clock coordinate the phase of tissue clocks throughout the brain and body

Affiliations

Shell neurons of the master circadian clock coordinate the phase of tissue clocks throughout the brain and body

Jennifer A Evans et al. BMC Biol. .

Abstract

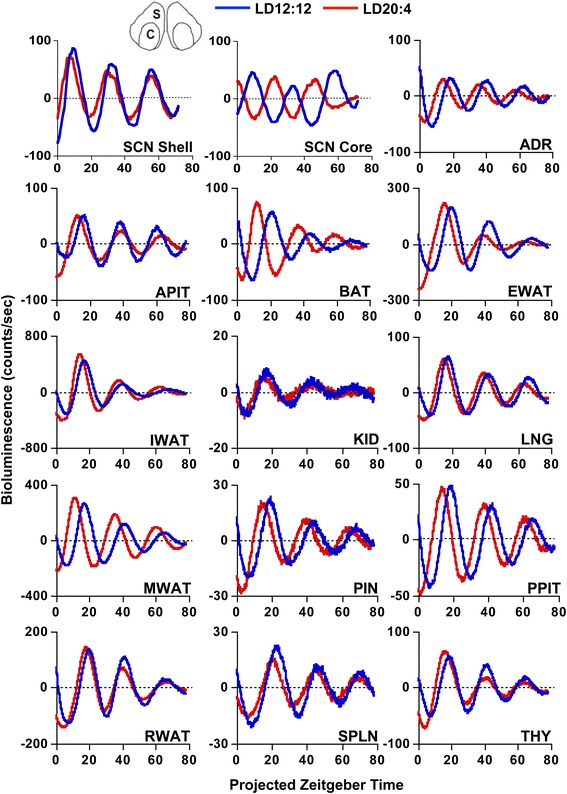
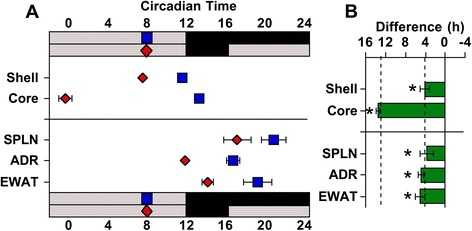
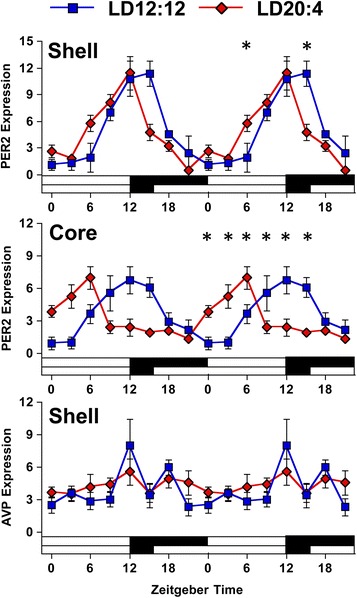
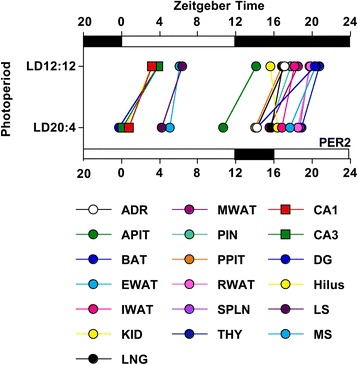
Background: Daily rhythms in mammals are programmed by a master clock in the suprachiasmatic nucleus (SCN). The SCN contains two main compartments (shell and core), but the role of each region in system-level coordination remains ill defined. Herein, we use a functional assay to investigate how downstream tissues interpret region-specific outputs by using in vivo exposure to long day photoperiods to temporally dissociate the SCN. We then analyze resulting changes in the rhythms of clocks located throughout the brain and body to examine whether they maintain phase synchrony with the SCN shell or core.

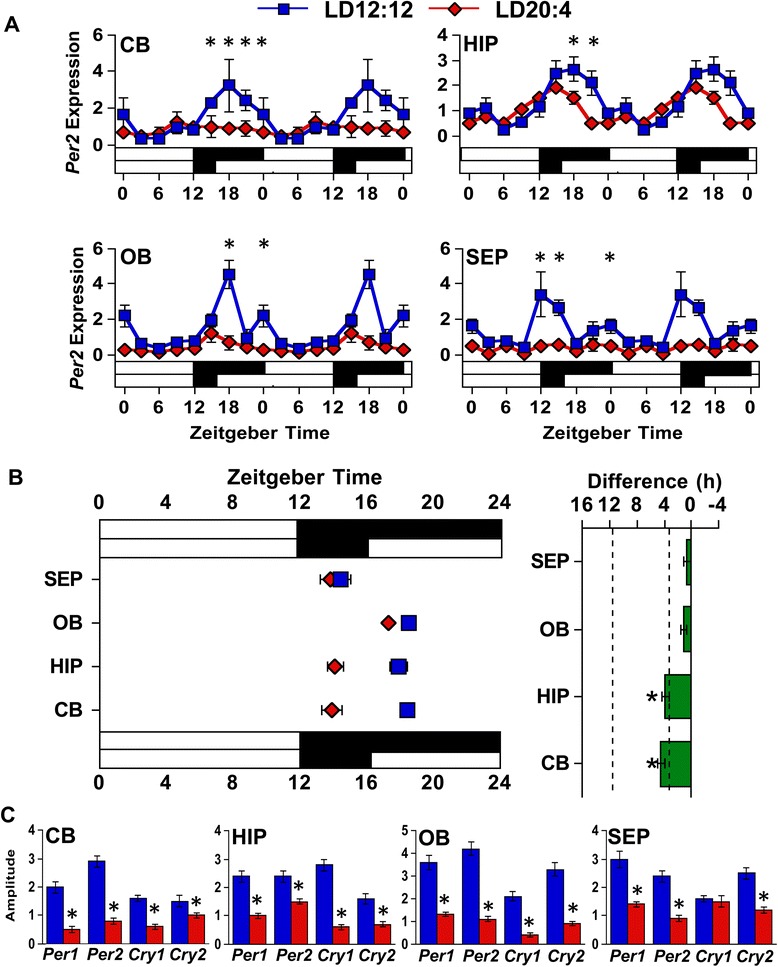
Results: Nearly all of the 17 tissues examined in the brain and body maintain phase synchrony with the SCN shell, but not the SCN core, which indicates that downstream oscillators are set by cues controlled specifically by the SCN shell. Interestingly, we also found that SCN dissociation diminished the amplitude of rhythms in core clock gene and protein expression in brain tissues by 50-75 %, which suggests that light-driven changes in the functional organization of the SCN markedly influence the strength of rhythms in downstream tissues.

Conclusions: Overall, our results reveal that body clocks receive time-of-day cues specifically from the SCN shell, which may be an adaptive design principle that serves to maintain system-level phase relationships in a changing environment. Further, we demonstrate that lighting conditions alter the amplitude of the molecular clock in downstream tissues, which uncovers a new form of plasticity that may contribute to seasonal changes in physiology and behavior.


Figures

Fig. 1
Fig. 1
Representative time series of bioluminescence rhythms measured in vitro from tissues collected from PER2::LUC mice housed under LD12:12 or LD20:4. Time series are de-trended and corrected for the Zeitgeber Time (ZT) of dissection. SCN shell and SCN core regions used for analyses are illustrated at the top of the figure (S and C, respectively). ADR, Adrenal gland; APIT, Anterior pituitary gland; BAT, Brown adipose tissue; EWAT, Epididymal white adipose tissue; IWAT, Inguinal white adipose tissue; KID, Kidney; LNG, Lung; MWAT, Mesenteric white adipose tissue; PIN, Pineal gland; PPIT, Posterior pituitary gland; RWAT, Retroperitoneal white adipose tissue; SPLN, Spleen; THY, Thymus
Fig. 2
Fig. 2
The phase of PER2::LUC rhythms in non-SCN tissues is shifted under long photoperiods by the SCN shell. a Time of peak bioluminescence (± SEM) on the first cycle in vitro displayed by SCN regions and peripheral tissues collected from PER2::LUC mice housed under LD12:12 (blue symbols) or LD20:4 (red symbols). The white and black bars on the abscissa represent lighting conditions for each photoperiod, with internal symbols indicating the time of dissection. n = 5–14/tissue/photoperiod. b Difference in the peak time of PER2::LUC expression (± SEM) between cultures collected under LD12:12 and LD20:4. Tissues are ordered by the magnitude of the difference in peak time. Dashed vertical lines indicate the magnitude of the shift displayed by the SCN shell and SCN core. *Significant phase shift different from 0 h, one sample t-test, P <0.05
Fig. 3
Fig. 3
Photoperiodic changes in the phase of peripheral tissues persist after release into constant darkness. a Time of peak bioluminescence (± SEM) on the first cycle in vitro displayed by SCN regions and peripheral tissues collected after release into constant darkness from LD12:12 (blue symbols) or LD20:4 (red symbols). n = 3/photoperiod for SCN, n = 6/photoperiod for peripheral tissues. b Summary plots of photoperiod-induced changes in the phase of peripheral tissues after release into constant darkness. Tissues are ordered by the magnitude of the difference in peak time. Dashed vertical lines indicate the magnitude of the shift displayed by the SCN shell and SCN core after release into constant darkness. *Significant phase shift different from 0 h, one sample t-test, P <0.05
Fig. 4
Fig. 4
The phase and amplitude of clock gene rhythms in central tissues is influenced by photoperiod. a Double-plotted rhythms in Per2 mRNA expression were measured with qRT-PCR for the cerebellum (CB), hippocampus (HIP), olfactory bulb (OB), and septum (SEP) under LD12:12 (blue symbols) and LD20:4 (red symbols). White and black bars on the abscissa represent lighting conditions. n = 3/time-point/photoperiod. *LD12:12 versus LD20:4, LS Means Contrasts, P <0.006. Cosinor analyses of Per2 rhythms are shown in Additional file 1: Table S3. b Summary plots of photoperiod-induced changes in the phase of Per2 rhythms in central tissues. Tissues are ordered by the magnitude of the difference in peak time. Dashed vertical lines indicate the magnitude of the shift displayed by the SCN shell and SCN core in vivo, as detected with PER2 immunohistochemistry (c.f., Additional file 1: Table S4). *Significant phase shift different from 0 h, one sample t-test, P <0.05. c Amplitude of core clock gene expression is reduced in all four tissues. *Student’s t-test, P <0.05. Clock gene rhythms for all four tissues are illustrated in Additional file 1: Figure S3
Fig. 5
Fig. 5
The phase and amplitude of PER2 rhythms in central tissues is influenced by photoperiod. a Double-plotted rhythms in PER2 expression were measured with immunohistochemistry for the subdivisions of the septum [medial septum (MS), lateral septum (LS)] and hippocampus (CA1, CA3, Dentate Gyrus, Hilus) under LD12:12 (blue symbols) and LD20:4 (red symbols). White and black bars on the abscissa represent lighting conditions. n = 4–6/time-point/photoperiod. * LD12:12 versus LD20:4, LS Means Contrasts, P <0.006. Cosinor analyses of PER2 rhythms are shown in Additional file 1: Table S4. b Summary plots of photoperiodic changes in the phase of central tissues. Tissues are ordered by the magnitude of the difference in peak time. Dashed vertical lines indicate the magnitude of the shift displayed by the SCN shell and SCN core in vivo, as detected with PER2 immunohistochemistry (c.f., Additional file 1: Table S4). * Significant phase difference, one sample t-test, P <0.05
Fig. 6
Fig. 6
The amplitude of AVP expression in the SCN is decreased by long day photoperiods. Double-plotted rhythms of PER2 and AVP expression measured in the SCN with immunohistochemistry. White and black bars on the abscissa represent lighting conditions. n = 4–8/time-point/photoperiod. *LD12:12 versus LD20:4, LS Means Contrasts, P <0.006. Cosinor analyses of PER2 and AVP rhythms are in Additional file 1: Table S4
Fig. 7
Fig. 7
Summary of photoperiodic modulation of phase relationships among tissues in the circadian system. Phase relationships among tissues indicated by the ZT peak time of PER2 expression. Lines connect the same tissue collected from mice entrained to LD12:12 (top) versus LD20:4 (bottom). ZT peak time was determined using PER2::LUC for the adrenal gland (ADR), anterior pituitary gland (APIT), brown adipose tissue (BAT), cornea (CORN), esophagus (ESO), epididymal white adipose tissue (EWAT), inguinal white adipose tissue (IWAT), kidney (KID), liver (LIV), lung (LNG), mesenteric white adipose tissue (MWAT), pineal gland (PIN), posterior pituitary gland (PPIT), retina (RET), retinal pigmented epithelium (RPE), retroperitoneal white adipose tissue (RWAT), spleen (SPLN), and thymus (THY). ZT peak time was determined using PER2 immunohistochemistry for regions of the hippocampus (CA1, CA3, DG, Hilus) and septum (LS, MS)

References

    1. Mohawk JA, Green CB, Takahashi JS. Central and peripheral circadian clocks in mammals. Annu Rev Neurosci. 2012;35:445–62. doi: 10.1146/annurev-neuro-060909-153128. - DOI - PMC - PubMed
    1. Ko CH, Takahashi JS. Molecular components of the mammalian circadian clock. Hum Mol Genet. 2006;15 Spec No 2:R271–7. doi: 10.1093/hmg/ddl207. - DOI - PubMed
    1. Dibner C, Schibler U, Albrecht U. The mammalian circadian timing system: Organization and coordination of central and peripheral clocks. Annu Rev Physiol. 2010;72:517–49. doi: 10.1146/annurev-physiol-021909-135821. - DOI - PubMed
    1. Evans JA, Davidson AJ. Health consequences of circadian disruption in humans and animal models. Prog Mol Biol Transl Sci. 2013;119:283–323. doi: 10.1016/B978-0-12-396971-2.00010-5. - DOI - PubMed
    1. Abrahamson EE, Moore RY. Suprachiasmatic nucleus in the mouse: retinal innervation, intrinsic organization and efferent projections. Brain Res. 2001;916:172–91. doi: 10.1016/S0006-8993(01)02890-6. - DOI - PubMed

Publication types

LinkOut - more resources