. 2015 Jun 23:6:7281.
doi: 10.1038/ncomms8281.

The bacterial tubulin FtsZ requires its intrinsically disordered linker to direct robust cell wall construction

Affiliations

The bacterial tubulin FtsZ requires its intrinsically disordered linker to direct robust cell wall construction

Kousik Sundararajan et al. Nat Commun. .

Abstract

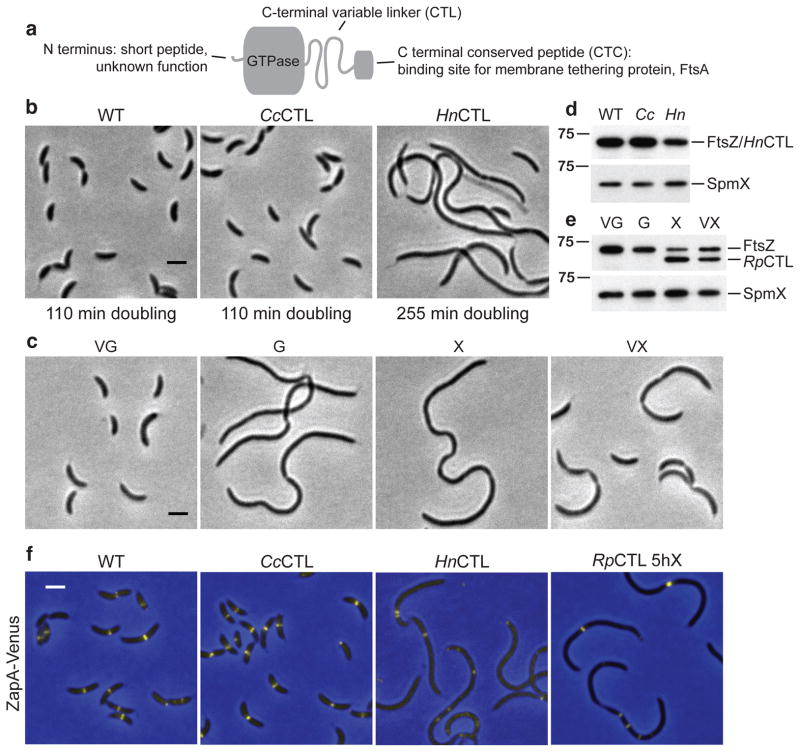
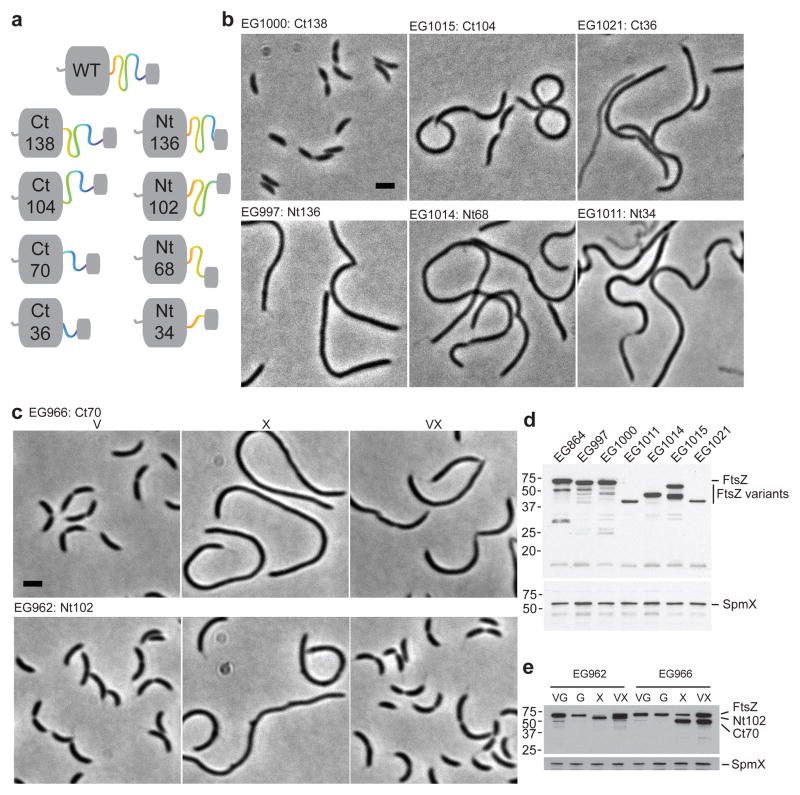
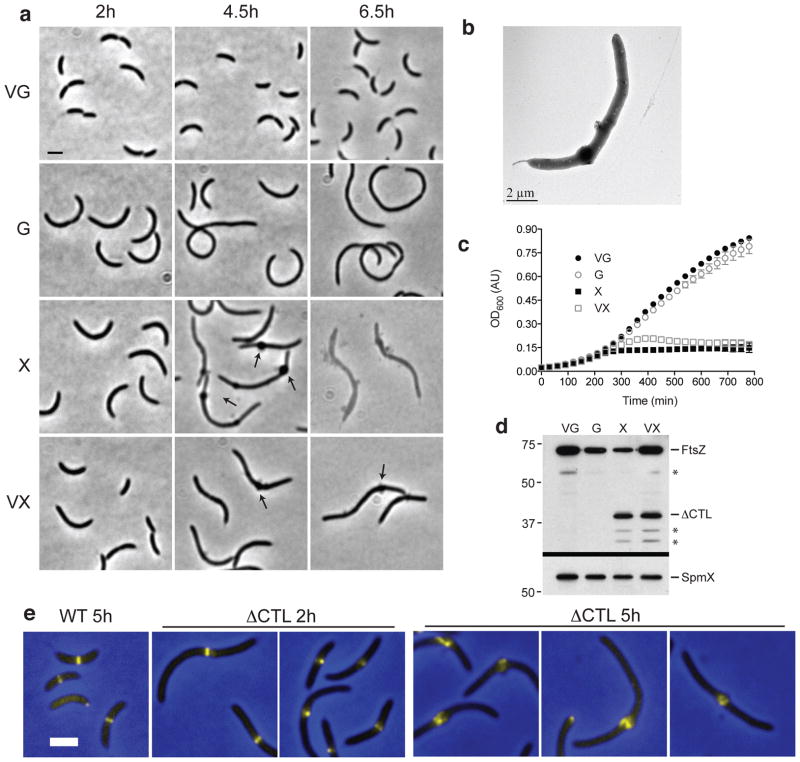
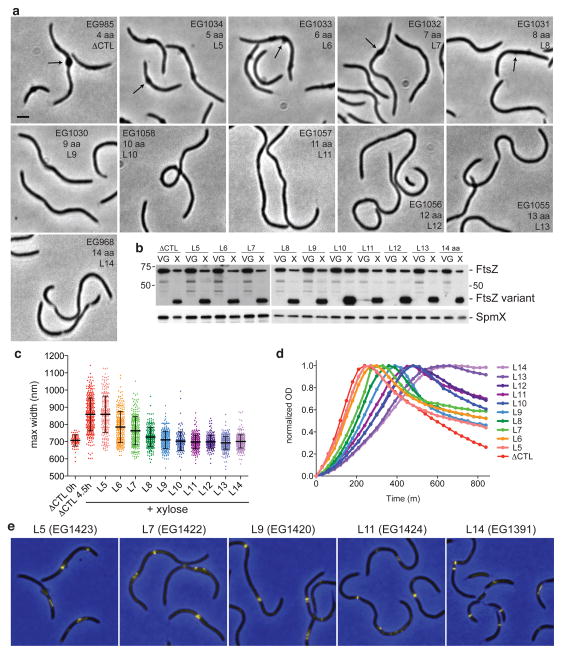
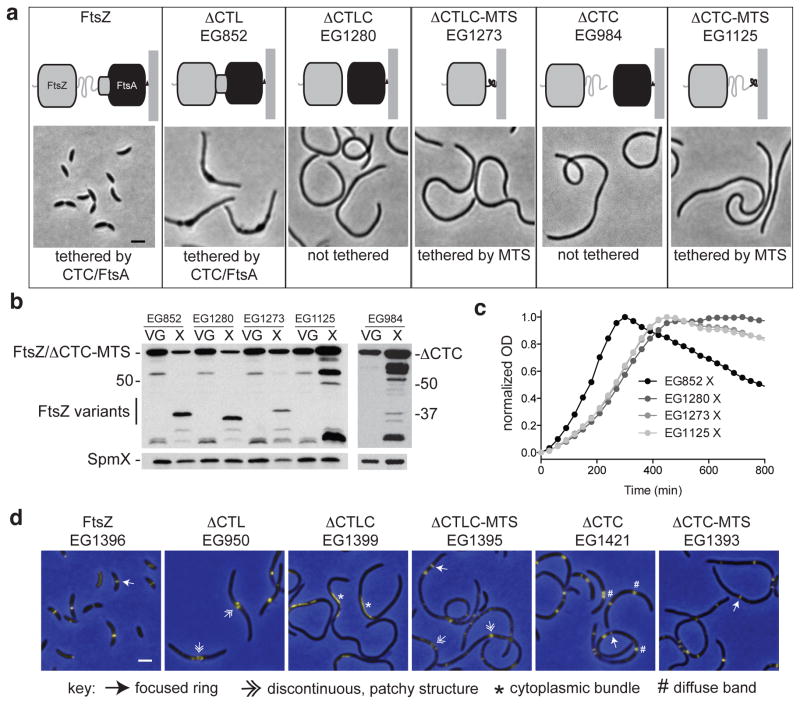
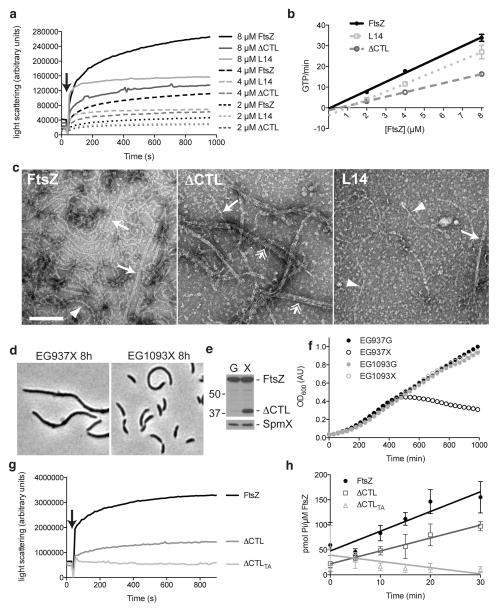
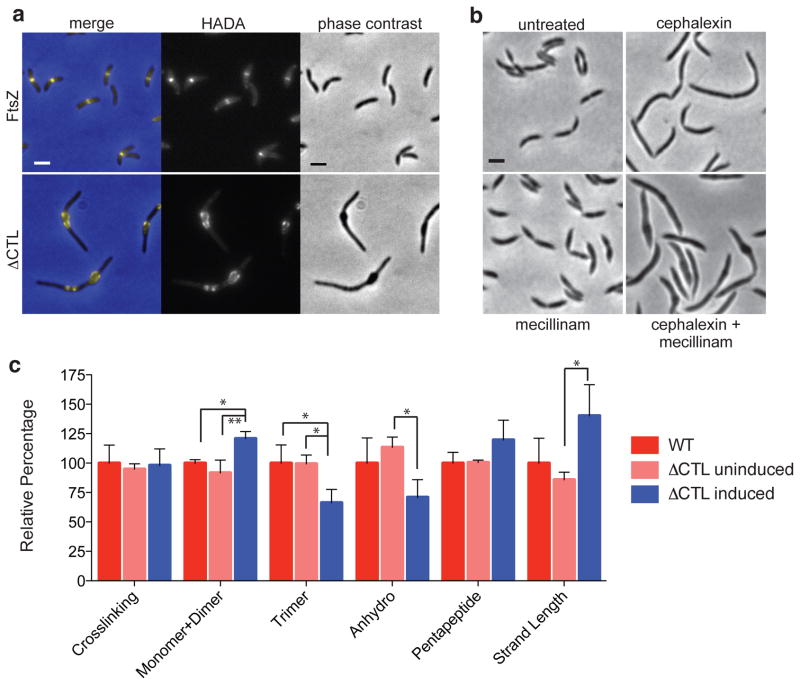
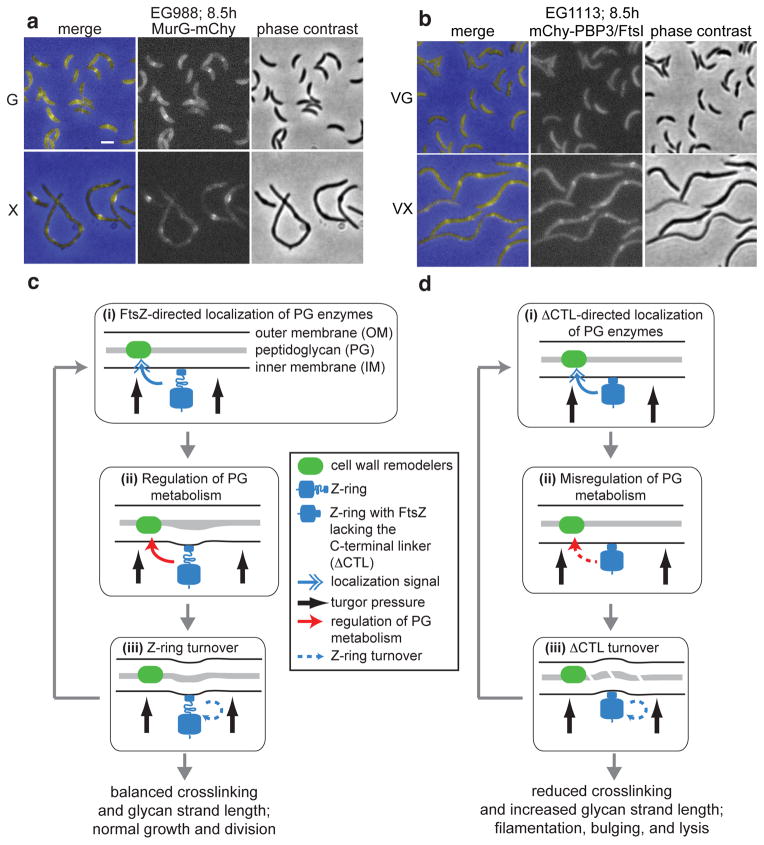
The bacterial GTPase FtsZ forms a cytokinetic ring at midcell, recruits the division machinery and orchestrates membrane and peptidoglycan cell wall invagination. However, the mechanism for FtsZ regulation of peptidoglycan metabolism is unknown. The FtsZ GTPase domain is separated from its membrane-anchoring C-terminal conserved (CTC) peptide by a disordered C-terminal linker (CTL). Here we investigate CTL function in Caulobacter crescentus. Strikingly, production of FtsZ lacking the CTL (ΔCTL) is lethal: cells become filamentous, form envelope bulges and lyse, resembling treatment with β-lactam antibiotics. This phenotype is produced by FtsZ polymers bearing the CTC and a CTL shorter than 14 residues. Peptidoglycan synthesis still occurs downstream of ΔCTL; however, cells expressing ΔCTL exhibit reduced peptidoglycan crosslinking and longer glycan strands than wild type. Importantly, midcell proteins are still recruited to sites of ΔCTL assembly. We propose that FtsZ regulates peptidoglycan metabolism through a CTL-dependent mechanism that extends beyond simple protein recruitment.


Conflict of interest statement

Competing Financial interests

The authors declare no competing financial interests.

Figures

Figure 1
Figure 1. TheCaulobacter crescentus CTL fulfills an essential, sequence-dependent function
(a) Domain organization of FtsZ. (b) Phase contrast images of strains expressing wildtype (WT, NA1000), CcCTL control (EG776), or HnCTL (EG769) ftsZ variants as the only copy of FtsZ in the cell and their corresponding doubling times in PYE medium. Bar = 2 μm. (c) Phase contrast images of strain EG1060, bearing vanillate (V)-induced expression of WT ftsZ and xylose (X)-induced expression of RpCTL ftsZ. Cells were grown in the presence of the indicated inducer or glucose (G) for 5 h prior to imaging. Bar = 2 μm. (d–e) Immunoblots against lysates from strains in (b–c) using FtsZ (top) or SpmX antisera (bottom). Owing to lack of a specific antibody raised against a loading control distinct enough in size from FtsZ and each of the variants used in this study, SpmX was probed against identical samples on a separate blot. Cc = CcCTL, Hn = HnCTL. FtsZ antiserum was raised against the entire WT FtsZ molecule. Some of the reduction in signal observed for HnCTL and RpCTL may be attributable to loss of CTL-derived epitopes. Positions of molecular weight markers (kDa) are indicated (left). (f) ZapA-Venus fluorescence (yellow) overlaid on phase contrast (blue) images of cells producing the indicated FtsZ CTL variants and ZapA-Venus. WT (EG941), CcCTL (EG1418), and HnCTL (EG1389) were produced from the ftsZ locus as the only FtsZ in the cell. RpCTL (EG1419) production was induced with xylose while depleting WT FtsZ for 5 h prior to imaging.
Figure 2
Figure 2. C. crescentus tolerates large changes to the length of the CTL
(a) Graphical representation of the CTL deletion variants analyzed. Ct138 = FtsZ with only the C-terminal 138 residues of the CTL, Nt136 = FtsZ with only the N-terminal 136 residues of the CTL, and so forth. (b) Phase contrast images of strains producing the indicated CTL variants as the only copy of FtsZ in the cell, expressed from the ftsZ locus. Bar = 2 μm. (c) Phase contrast images of the indicated strains, grown with vanillate (V), xylose (X), or both (VX) for 5 h prior to imaging. Bar = 2 μm. (d and e) Immunoblots against lysates from strains in (b–c) using FtsZ (top) or SpmX (bottom) antisera. Positions of molecular weight markers (kDa) are indicated (left).
Figure 3
Figure 3. ΔCTL production causes dominant lethal envelope bulging and cell lysis
(a) Phase contrast images of cells from strain EG852, with vanillate-induced expression of ftsZ and xylose-induced expression of ΔCTL. Cells were grown for the indicated amount of time in PYE medium with the indicated inducer (vanillate (V), xylose (X), and/or glucose (G)) prior to imaging. Arrows highlight envelope bulges. Bar = 2 μm. (b) Whole mount transmission electron micrograph of an EG852 cell grown in PYE xylose for 4 h. (c) Growth of strain EG852 in PYE with the indicated inducers added at time 0, as monitored by OD600. Average ± standard deviation (s.d.) from three technical replicates is plotted. (d) Immunoblot of lysates from cells in (a) after 7 h growth in PYE with the indicated inducers using FtsZ (top) or SpmX antisera (bottom). Asterisks indicate degradation products. Positions of molecular weight markers (kDa) are indicated (left). (e) Merged ZapA-Venus fluorescence (yellow) and phase contrast (blue) images of cells producing WT FtsZ (EG1396) for 5 h or ΔCTL (EG950) for 2 h or 5 h.
Figure 4
Figure 4. Bulging and lysis is CTL length-dependent
(a) Phase contrast images of strains producing FtsZ with the indicated CTL lengths grown with xylose for 4.5 h prior to imaging. The number of amino acids (aa) in the linker includes 4 residues added from restriction sites introduced for cloning purposes. Thus, ΔCTL contains a 4 aa linker. Each strain bears vanillate-induced ftsZ and xylose-induced CTL variant. Bar = 2 μm. Arrows highlight bulges. (b) Immunoblots of lysates from strains in (a) grown with vanillate and glucose or with xylose for 6.5 h using FtsZ (top) or SpmX antisera (bottom). Positions of molecular weight markers (kDa) are indicated (left). (c) Maximum widths of cells from strains from (a) grown with xylose for 4.5 h and for EG985 grown with vanillate and glucose (ΔCTL VG; expressing WT ftsZ). Data points represent the maximum width for each cell in that population. Data are combined from two independent imaging experiments for each strain. ΔCTL X data include two independent experiments with EG985 and one with EG852 (independent, isogenic strains for producing ΔCTL). n = 80, 354, 254, 274, 268, 242, 281, 151, 281, 212, 357, and 326 cells for samples as presented from left to right. Bar = average width, whiskers = s.d. (d) Growth and lysis of strains from (a). Cells were grown with xylose from time 0 and OD was monitored at 600 nm. Final plots were normalized for each data set and represent average data from three technical replicates. The time at which OD began to fall was interpreted as time of initiation of lysis. (e) ZapA-Venus fluorescence (yellow) overlaid on phase contrast (blue) images of cells producing the indicated FtsZ CTL variants and ZapA-Venus. Each variant was induced with xylose while depleting WT FtsZ for 5 h prior to imaging.
Figure 5
Figure 5. ΔCTL requires the membrane-anchoring CTC to invoke bulging and lysis
(a) Schematics and representative phase contrast images of WT cells (FtsZ) and cells producing the indicated FtsZ variants and depleted of WT FtsZ for 5 h. ΔCTLC - FtsZ lacking the CTL and FtsA-binding CTC. MTS - membrane targeting sequence from E. coli MinD. ΔCTC - FtsZ lacking the CTC. Bar = 2 μm. (b) Immunoblots of lysates from strains in (a) grown with vanillate and glucose or with xylose for 5 h probed with FtsZ (top) or SpmX antisera. Positions of molecular weight markers (kDa) are indicated. (c) Growth and lysis of strains from (a). Cells were grown with xylose from time 0 and OD was monitored at 600 nm. Final plots were normalized for each data set and represent average data from three technical replicates. (d) ZapA-Venus fluorescence (yellow) overlaid on phase contrast (blue) images of cells producing the indicated FtsZ CTL variants and ZapA-Venus. Each variant was induced with xylose while depleting WT FtsZ for 5 h prior to imaging. Bar = 2 μm.
Figure 6
Figure 6. ΔCTL must polymerize to cause bulging and lysis
(a) Right-angle light scattering over time by solutions containing purified 2,4, or 8 μM WT FtsZ, ΔCTL, or L14. Arrow indicates addition of GTP to induce polymerization. Curves are averages of three experiments. (b) GTPase activity of FtsZ variants from (a) as a function of protein concentration. Averages ± s.d. from three replicates are plotted with linear curve fits. Extrapolated x-intercepts represent estimated critical concentration. (c) Negative stain electron micrographs of the indicated FtsZ variant at 8 μM in the presence of 2 mM GTP and 2.5 mM MgCl2. Arrows: paired protofilaments; double arrows: thick bundles; arrowheads: single protofilaments. Bar = 100 nm. (d) Phase contrast micrographs of EG937, bearing xylose-inducible ΔCTL, and EG1093, a spontaneous suppressor mutant of EG937 grown in xylose for 8 h. (e) Immunoblot of lysates from strain EG1093 grown in glucose or xylose for 24 h probed with FtsZ (top) or SpmX (bottom) antisera. Positions of molecular weight markers (kDa) are indicated (left). (f) Growth of EG937 and EG1093, with glucose (G) or xylose (X) added at time 0. (g) Right angle light scattering over time by solutions containing purified 8 μM WT FtsZ, ΔCTL, or ΔCTL T112A/A282T (ΔCTLTA). Arrow indicates addition of GTP to induce polymerization. Curves are averages of two experiments. (h) Inorganic phosphate liberated over time by 8 μM FtsZ variants from (f). Averages ± s.d. from three replicates are plotted with linear curve fits.
Figure 7
Figure 7. Peptidoglycan crosslinking and glycan strand length are altered in cells producing ΔCTL
(a) Fluorescence (HADA) and phase contrast micrographs of strain EG852 grown with vanillate and glucose (top, FtsZ) or xylose (bottom, ΔCTL) for 5 h, then pulse-labeled with HADA for 5 min prior to imaging. Bar = 2 μm. (b) Phase contrast images of C. crescentus lacking β-lactamase (LS107) that were untreated, or treated with cephalexin, mecillinam, or both for 6 h. Bar = 2 μm. (c) Relative abundance of total muropeptide crosslinking, the indicated crosslinked species, anhydro glycan ends, pentapeptides, and glycan strand length of sacculi isolated from WT C. crescentus, or from EG852 grown in vanillate and glucose (ΔCTL uninduced) or in xylose (ΔCTL induced) for 5 h prior to sacculus preparation. Muropeptides were isolated and analyzed in triplicate for each sample. Values are expressed as a percentage of the average WT value for each feature. Average + s.d. are presented. n = 3 each. *: p<0.05, **: p<0.01 using 1-way ANOVA with Tukey’s Multiple Comparison post-test.
Figure 8
Figure 8. PG enzymes are recruited to sites of ΔCTL assembly
(a, b) Fluorescence, phase contrast, and merged images demonstrating localization of fluorescent fusions to divisome proteins in cells producing ΔCTL. MurG-mCherry and mCherry-FtsI were produced upon vanillate induction in the EG937 background. Cells were grown in the presence of glucose or xylose for 8.5 h prior to imaging. Vanillate was added 2 h prior to imaging to induce expression of the fluorescent fusion. (c) Graphical representation of the role of FtsZ in promoting PG remodeling in C. crescentus. (i) Once established at the incipient division site, the Z-ring promotes local assembly of the divisome, including PG enzymes and their regulators. (ii) We propose that, in addition to recruiting PG enzymes to midcell, the Z-ring initiates a signal that regulates their activity, allowing appropriate re-shaping and invagination of the cell envelope. (iii) The Z-ring turns over, making constriction an iterative process. (d) When ΔCTL is produced, midcell proteins are still recruited (i), but their activities are misregulated (ii), leading to reduced PG crosslinking, increased glycan strand length, envelope bulging, and cell lysis (iii).

References

    1. Typas A, Banzhaf M, Gross CA, Vollmer W. From the regulation of peptidoglycan synthesis to bacterial growth and morphology. Nat Rev Microbiol. 2012;10:123–136. - PMC - PubMed
    1. Wang S, Shaevitz JW. The mechanics of shape in prokaryotes. Front Biosci (Schol Ed) 2013;5:564–574. - PubMed
    1. Cabeen MT, et al. Bacterial cell curvature through mechanical control of cell growth. EMBO J. 2009;28:1208–1219. - PMC - PubMed
    1. Osawa M, Anderson DE, Erickson HP. Reconstitution of contractile FtsZ rings in liposomes. Science. 2008;320:792–794. - PMC - PubMed
    1. Wang S, Arellano-Santoyo H, Combs PA, Shaevitz JW. Actin-like cytoskeleton filaments contribute to cell mechanics in bacteria. Proc Natl Acad Sci USA. 2010;107:9182–9185. - PMC - PubMed

Publication types

MeSH terms

LinkOut - more resources