Multicenter Study
. 2015 Jun 22:350:h2863.
doi: 10.1136/bmj.h2863.

Usefulness of data from magnetic resonance imaging to improve prediction of dementia: population based cohort study

Affiliations
Multicenter Study

Usefulness of data from magnetic resonance imaging to improve prediction of dementia: population based cohort study

Blossom C M Stephan et al. BMJ. .

Abstract

Objective: To determine whether the addition of data derived from magnetic resonance imaging (MRI) of the brain to a model incorporating conventional risk variables improves prediction of dementia over 10 years of follow-up.

Design: Population based cohort study of individuals aged ≥ 65.

Setting: The Dijon magnetic resonance imaging study cohort from the Three-City Study, France.

Participants: 1721 people without dementia who underwent an MRI scan at baseline and with known dementia status over 10 years' follow-up.

Main outcome measure: Incident dementia (all cause and Alzheimer's disease).

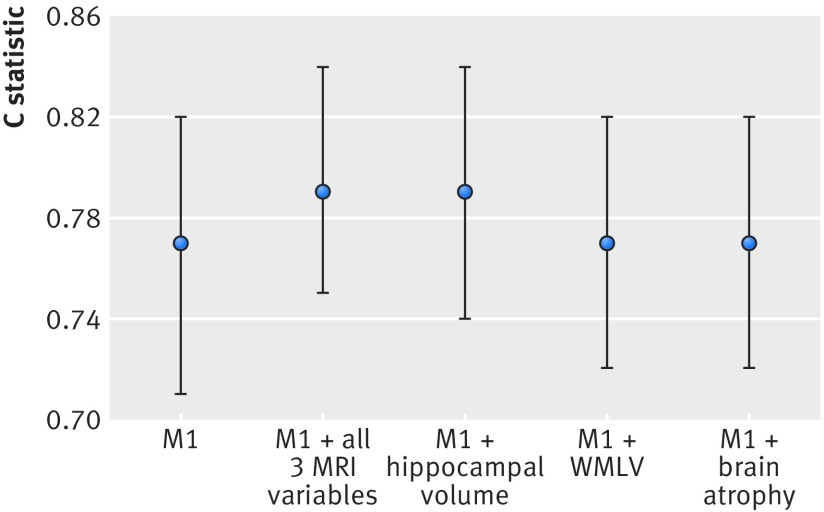
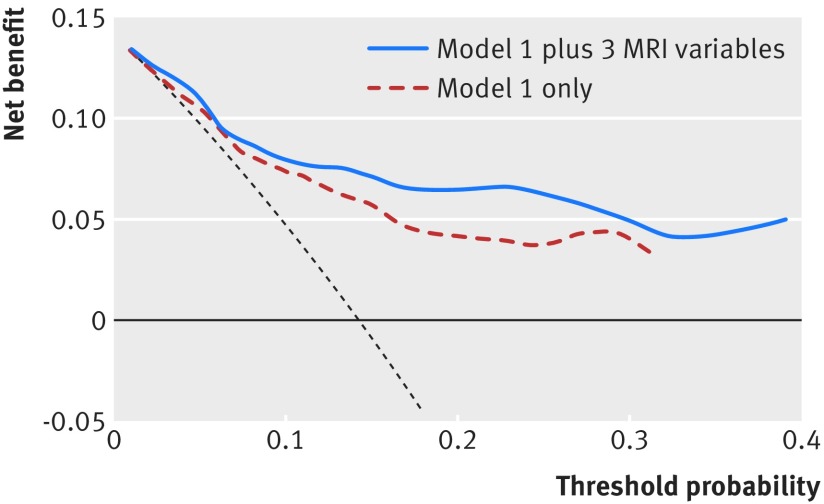
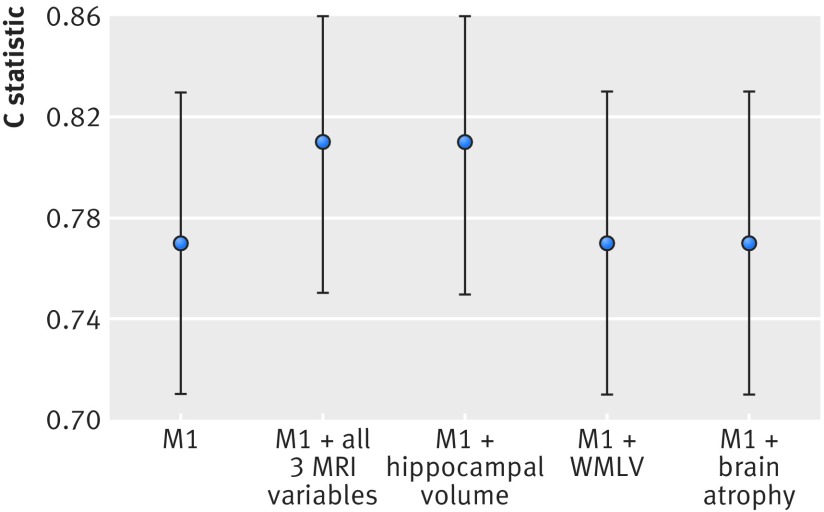
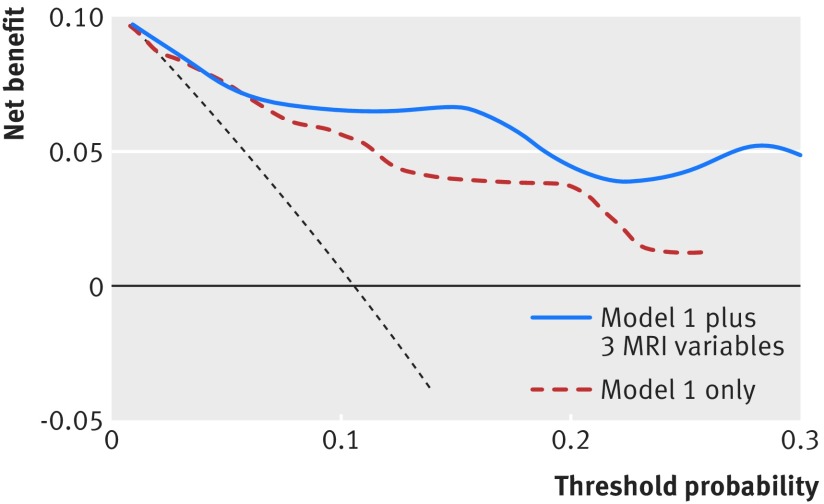
Results: During 10 years of follow-up, there were 119 confirmed cases of dementia, 84 of which were Alzheimer's disease. The conventional risk model incorporated age, sex, education, cognition, physical function, lifestyle (smoking, alcohol use), health (cardiovascular disease, diabetes, systolic blood pressure), and the apolipoprotein genotype (C statistic for discrimination performance was 0.77, 95% confidence interval 0.71 to 0.82). No significant differences were observed in the discrimination performance of the conventional risk model compared with models incorporating data from MRI including white matter lesion volume (C statistic 0.77, 95% confidence interval 0.72 to 0.82; P=0.48 for difference of C statistics), brain volume (0.77, 0.72 to 0.82; P=0.60), hippocampal volume (0.79, 0.74 to 0.84; P=0.07), or all three variables combined (0.79, 0.75 to 0.84; P=0.05). Inclusion of hippocampal volume or all three MRI variables combined in the conventional model did, however, lead to significant improvement in reclassification measured by using the integrated discrimination improvement index (P=0.03 and P=0.04) and showed increased net benefit in decision curve analysis. Similar results were observed when the outcome was restricted to Alzheimer's disease.

Conclusions: Data from MRI do not significantly improve discrimination performance in prediction of all cause dementia beyond a model incorporating demographic, cognitive, health, lifestyle, physical function, and genetic data. There were, however, statistical improvements in reclassification, prognostic separation, and some evidence of clinical utility.


Conflict of interest statement

Competing interests: All authors have completed the ICMJE uniform disclosure form at www.icmje.org/coi_disclosure.pdf and declare: SA serves on scientific advisory boards for Eisai and Pfizer and has received funding for travel and honorariums for educational activities from Eisai, Pfizer, Janssen, Novartis, and Ipsen. HA has received payments for lectures from Novartis Pharma, and GSK. CD is a consultant for Eisai.

Figures

None
Fig 1 C statistics (95% CI) (not adjusted for optimism bias) for different prediction models (outcome was all cause dementia). Model 1 (M1) includes age, sex, educational attainment, physical function (impairment in activities of daily living), cognition function (mini-mental state examination, Benton visual retention test, and digit span), health (cardiovascular disease, diabetes and systolic blood pressure), lifestyle (smoking and alcohol use), and apolipoprotein e4 status. MRI=magnetic resonance imaging, WMLV=white matter lesion volume
None
Fig 2 Decision curve analysis for 10 year risk of all cause dementia for conventional risk model with and without the addition of all three MRI variables (white matter lesions volume, whole brain volume, and hippocampal volume). Model 1 (M1) includes age, sex, educational attainment, physical function (impairment in activities of daily living), cognition function (mini-mental state examination, Benton visual retention test, and digit span), health (cardiovascular disease, diabetes and systolic blood pressure), lifestyle (smoking and alcohol use), and apolipoprotein e4 status. Net benefit (dotted line) assumes all will develop dementia and theoretical beneficial action taken (“treat all”); solid horizontal line assumes none will develop dementia and no action (“treat none”)
None
Fig 3 C statistics (95% confidence intervals) (not adjusted for optimism bias) for different prediction models (outcome Alzheimer’s disease). Model 1 (M1) included age, sex, educational attainment, physical function (impairment in activities of daily living), cognition function (mini-mental state examination, Benton visual retention test, and digit span), health (cardiovascular disease, diabetes and systolic blood pressure), lifestyle (smoking and alcohol use), and apolipoprotein e4 status. MRI=magnetic resonance imaging. WMLV=white matter lesion volume
None
Fig 4 Decision curve analysis for 10 year risk of Alzheimer’s disease for conventional risk model with and without addition of all three MRI variables (white matter lesions volume, whole brain volume, and hippocampal volume). Model 1 (M1) includes age, sex, educational attainment, physical function (impairment in activities of daily living), cognition function (mini-mental state examination, Benton visual retention test, and digit span), health (cardiovascular disease, diabetes and systolic blood pressure), lifestyle (smoking and alcohol use) and apolipoprotein e4 status. Net benefit (dotted line) assumes all will develop dementia and theoretical beneficial action taken (“treat all”); solid horizontal line assumes none will develop dementia and no action (“treat none”)

Comment in

  • Predicting dementia.
    van Gool WA, Richard E. van Gool WA, et al. BMJ. 2015 Jun 22;350:h2994. doi: 10.1136/bmj.h2994. BMJ. 2015. PMID: 26099820 No abstract available.
  • [MRI does not improve the prediction of dementia].
    Weih M. Weih M. MMW Fortschr Med. 2015 Nov 12;157 Spec No 2:46. doi: 10.1007/s15006-015-3787-6. MMW Fortschr Med. 2015. PMID: 26953474 German. No abstract available.

References

    1. Alzheimer’s Disease International. World Alzheimer Report. 2009. www.alz.co.uk/research/files/WorldAlzheimerReport.pdf.
    1. Brookmeyer R, Gray S, Kawas C. Projections of Alzheimer’s disease in the United States and the public health impact of delaying disease onset. Am J Public Health 1998;88:1337-42. - PMC - PubMed
    1. Barnes DE, Covinsky KE, Whitmer RA, et al. Commentary on “Developing a national strategy to prevent dementia: Leon Thal Symposium 2009.” Dementia risk indices: a framework for identifying individuals with a high dementia risk. Alzheimers Dement 2010;6:138-41. - PMC - PubMed
    1. Barnes DE, Covinsky KE, Whitmer RA, et al. Predicting risk of dementia in older adults: the late-life dementia risk index. Neurology 2009;73:173-9. - PMC - PubMed
    1. Reitz C, Tang M-X, Schupf N, et al. A summary risk score for the prediction of alzheimer disease in elderly persons. Arch Neurol 2010;67:835-41. - PMC - PubMed

Publication types