. 2015 Sep;197(17):2792-809.
doi: 10.1128/JB.00101-15. Epub 2015 Jun 22.

Interactions and Localization of Escherichia coli Error-Prone DNA Polymerase IV after DNA Damage

Affiliations

Interactions and Localization of Escherichia coli Error-Prone DNA Polymerase IV after DNA Damage

Sarita Mallik et al. J Bacteriol. 2015 Sep.

Abstract

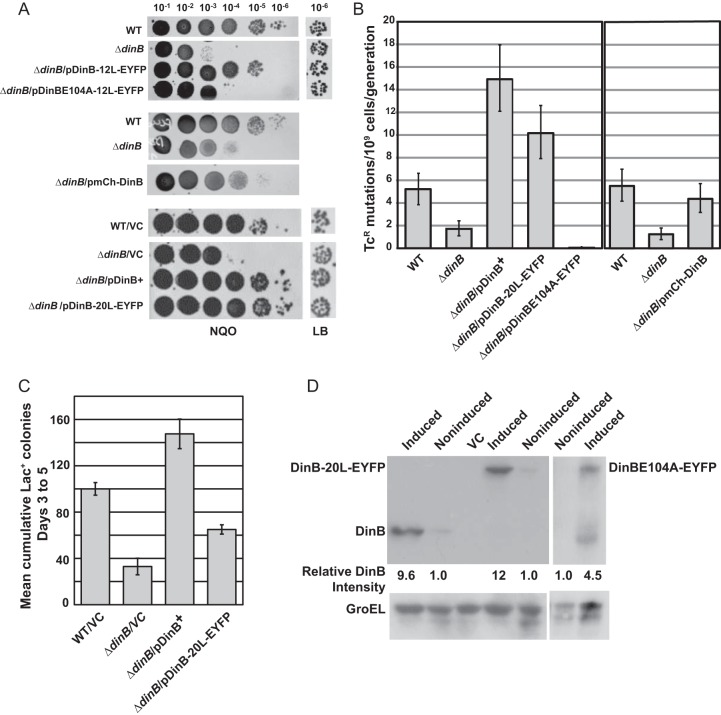
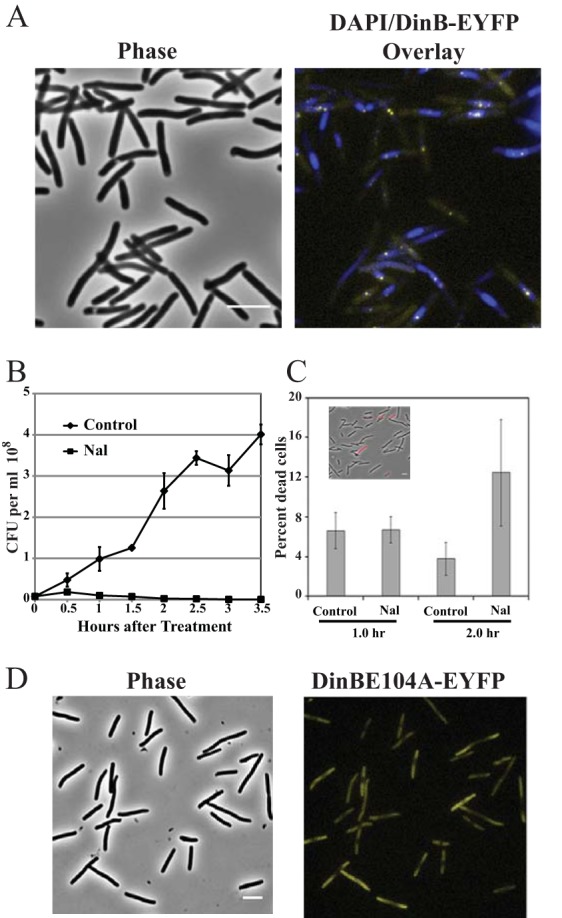
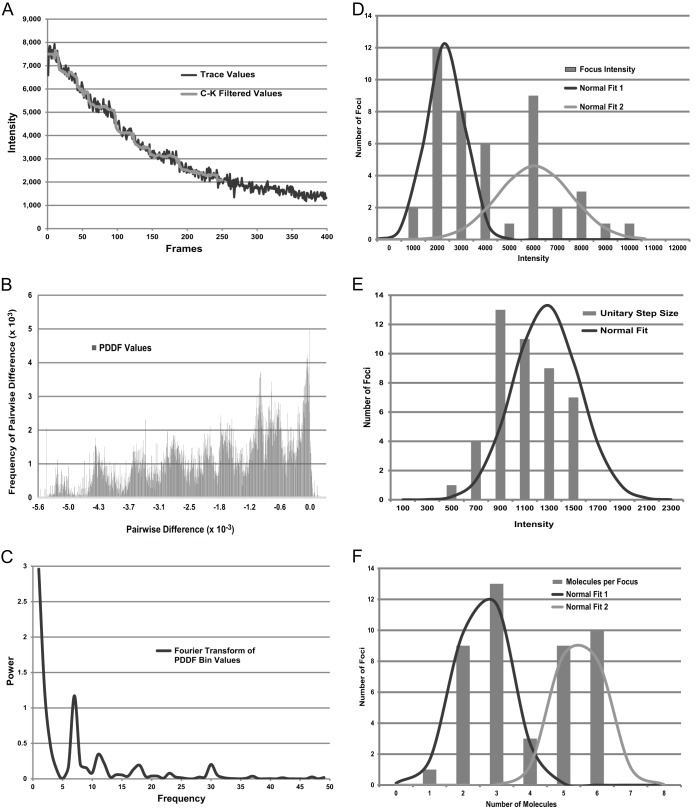
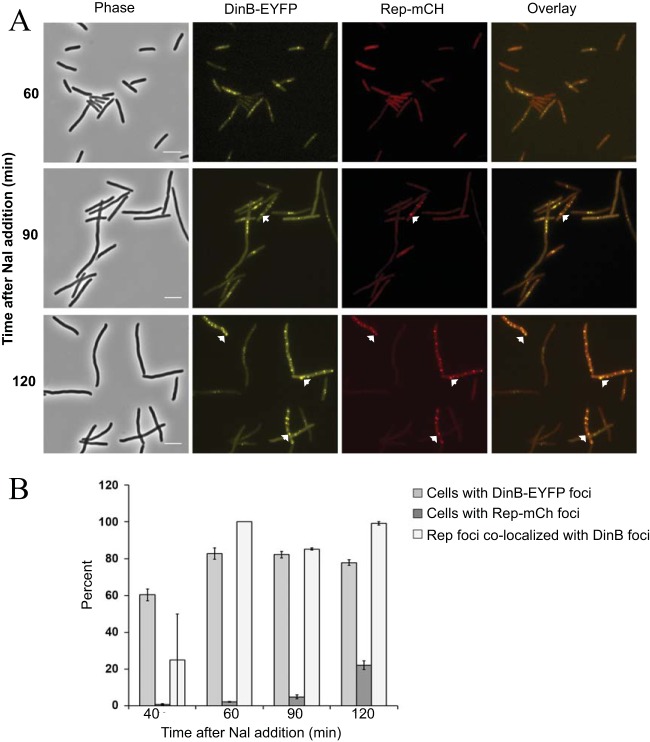
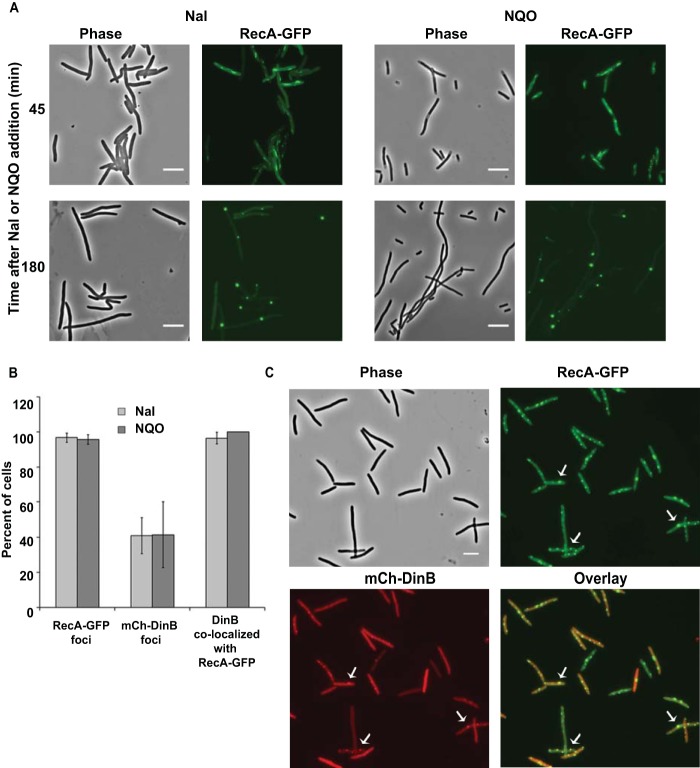
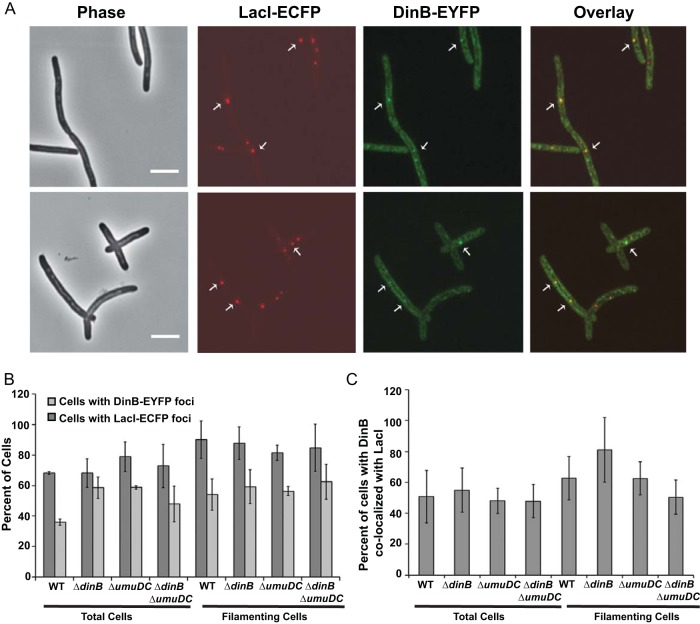
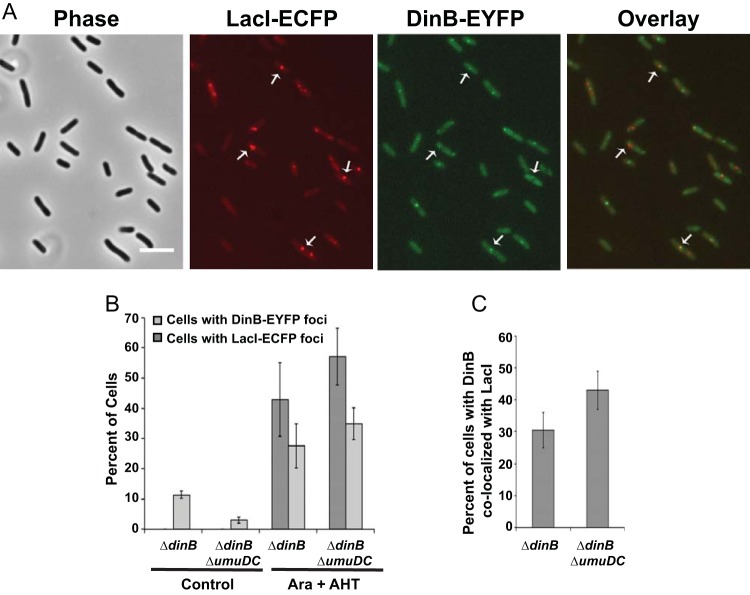
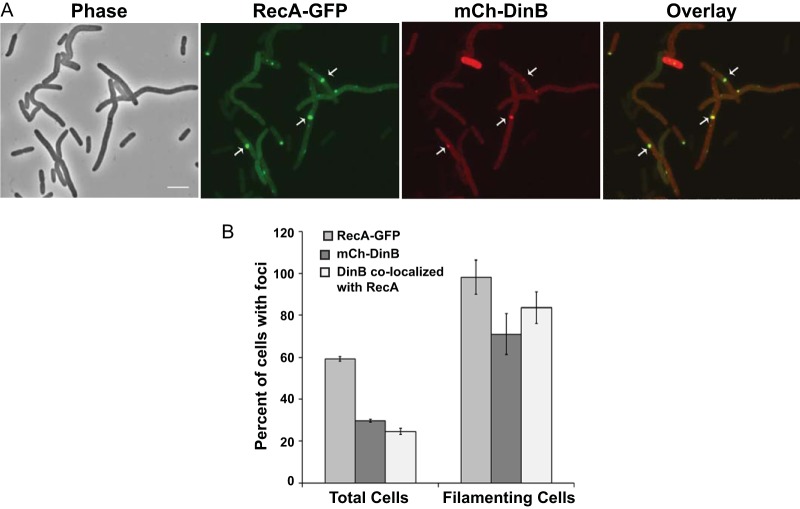
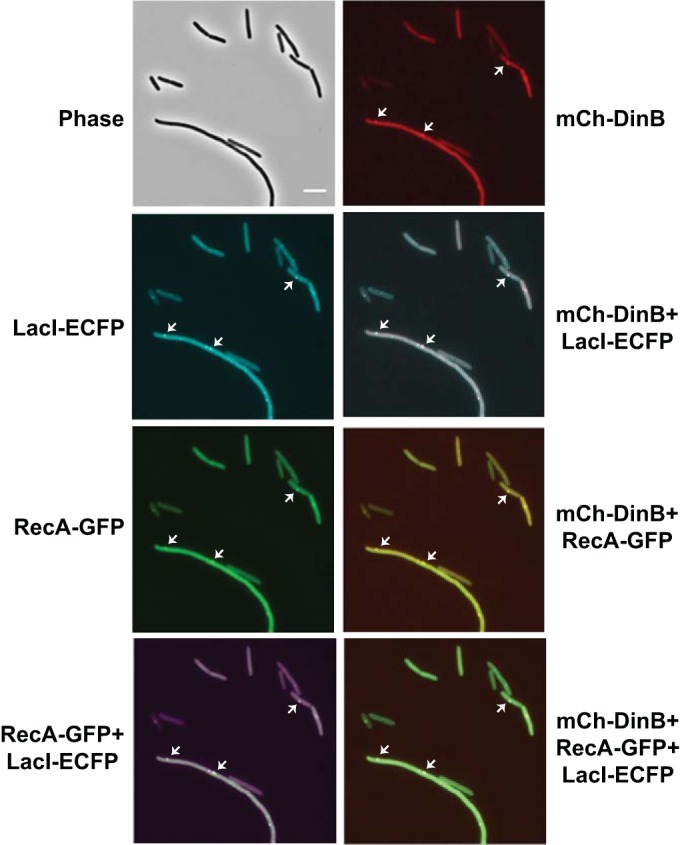
Escherichia coli's DNA polymerase IV (Pol IV/DinB), a member of the Y family of error-prone polymerases, is induced during the SOS response to DNA damage and is responsible for translesion bypass and adaptive (stress-induced) mutation. In this study, the localization of Pol IV after DNA damage was followed using fluorescent fusions. After exposure of E. coli to DNA-damaging agents, fluorescently tagged Pol IV localized to the nucleoid as foci. Stepwise photobleaching indicated ∼60% of the foci consisted of three Pol IV molecules, while ∼40% consisted of six Pol IV molecules. Fluorescently tagged Rep, a replication accessory DNA helicase, was recruited to the Pol IV foci after DNA damage, suggesting that the in vitro interaction between Rep and Pol IV reported previously also occurs in vivo. Fluorescently tagged RecA also formed foci after DNA damage, and Pol IV localized to them. To investigate if Pol IV localizes to double-strand breaks (DSBs), an I-SceI endonuclease-mediated DSB was introduced close to a fluorescently labeled LacO array on the chromosome. After DSB induction, Pol IV localized to the DSB site in ∼70% of SOS-induced cells. RecA also formed foci at the DSB sites, and Pol IV localized to the RecA foci. These results suggest that Pol IV interacts with RecA in vivo and is recruited to sites of DSBs to aid in the restoration of DNA replication.

Importance: DNA polymerase IV (Pol IV/DinB) is an error-prone DNA polymerase capable of bypassing DNA lesions and aiding in the restart of stalled replication forks. In this work, we demonstrate in vivo localization of fluorescently tagged Pol IV to the nucleoid after DNA damage and to DNA double-strand breaks. We show colocalization of Pol IV with two proteins: Rep DNA helicase, which participates in replication, and RecA, which catalyzes recombinational repair of stalled replication forks. Time course experiments suggest that Pol IV recruits Rep and that RecA recruits Pol IV. These findings provide in vivo evidence that Pol IV aids in maintaining genomic stability not only by bypassing DNA lesions but also by participating in the restoration of stalled replication forks.


Figures

FIG 1
FIG 1
In vivo activity and expression of fluorescence-tagged Pol IV. (A) NQO sensitivities of strains carrying fluorescence-tagged Pol IV. For each strain, 10-μl aliquots of 10−1 to 10−6 dilutions of saturated cultures were spotted on an LB agar plate containing NQO; the 10−6 dilutions spotted on a plate containing no NQO are shown at the right. WT (wild type), FC40; ΔdinB, PFB243; ΔdinB/pDinB-12L-EYFP, PFB243/pPFB913; ΔdinB/pDinBE104A-12L-EYFP, PFB243/pPFB1173; ΔdinB/pmCh-DinB, PFB243/pPFV407; WT/VC (vector control), FC40/pPFB1179; ΔdinB/VC, PFB243/pPFB1179; ΔdinB/pDinB+, PFB243/pPYG768; ΔdinB/pDinB-20L-EYFP, PFB243/pPFB1188. (B) Growth-dependent mutation rates of strains carrying fluorescence-tagged Pol IV. Shown are mutation rates to Tcr ± 95% confidence intervals as determined by fluctuation tests in two experiments with 40 cultures per strain (see Materials and Methods). WT, FC1373; ΔdinB, PFB1284; ΔdinB/pDinB+, PFB1284/pPYG768; ΔdinB/pDinB-20L-EYFP, PFB1284/pPFB1188; ΔdinB/pDinBE104A-12L-EYFP, PFB1284/pPFB1173; ΔdinB/pmCh-10L-DinB, PFB1284/pPFV407. (C) Adaptive-mutation activity of DinB-20L-EYFP+. Shown are the mean cumulative numbers of Lac+ colonies appearing on days 3 to 5 on lactose minimal medium during a small-scale adaptive-mutation assay (see Materials and Methods). Each bar is the mean of four cultures; the error bars are SEM. WT/VC, FC40/pPFB1179; ΔdinB/VC, B243/pPFB1179; ΔdinB/pDinB+, PFB243/pPYG768; ΔdinB/pDinB-20L-EYFP, PFB243/pPFB1188. (D) Expression of fluorescence-tagged Pol IV proteins compared to wild-type Pol IV. Shown are immunoblots of DinB+, DinB-20L-EYFP, and DinBE104A-12L-EYFP before and after induction with Nal. The blots were probed with anti-Pol IV antibody, stripped, and then reprobed with anti-GroEL antibody to show GroEL as a loading control. The band intensities were quantified and normalized to the GroEL bands. The numbers below the lanes give the induced levels of DinB+ and DinB fusion proteins relative to the uninduced levels. The strains used were as follows: DinB+, PFB243/pPYG768; VC, pFB243/pPFB1172; DinB-20L-EYFP, PFB243/pPFB1188; DinBE104A-12L-EYFP, PFB243/pPFB1173.
FIG 2
FIG 2
Localization of Pol IV and cell survival after Nal exposure. (A) Phase-contrast and phase plus fluorescence overlay images of DinB-12L-EYFP localization. Strain PFB243/pPFB913 was grown in LB broth plus antibiotics at 37°C to mid-exponential phase (OD600 = 0.5), treated with 40 μg/ml Nal, and incubated for a further 1 h. The cells were then stained with DAPI and visualized for DinB-EYFP foci. The DinB-EYFP (yellow) foci were associated with DAPI-stained nucleoids (blue). (B) Colony-forming ability of Nal-treated cells. Strain PFB243/pPFB913 was grown as described for panel A, and half the culture was treated with Nal. Samples were withdrawn from the cultures at the indicated time points and plated for CFU. Shown are the means ± SEM of 3 cultures (some error bars are smaller than the symbols). (C) Propidium iodide staining of Nal-treated cells to estimate cell viability based on membrane integrity. After exposure to Nal as for panel A, samples were washed and suspended at 10× in saline, stained with propidium iodide, and imaged. Shown are the mean percentages ± SEM of the cells stained with propidium iodide based on 2 or 3 fields examined with 125 to 710 cells counted per field; the inset shows a phase-contrast image overlaid with a fluorescence image (red). (D) Failure of an active-site mutant Pol IV (DinBE104A-EYFP) to form fluorescent foci. Strain PFB243/pPFB1173 was treated with Nal as for panel A. Shown are the phase-contrast and fluorescence images of DinBE104A-EYFP localization. Scale bars = 5 μm.
FIG 3
FIG 3
Analysis of the numbers of DinB-EYFP molecules per fluorescent focus by photobleaching. Strain PFB243/pPFB1188 (ΔdinB/pDinB-20L-EYFP) was grown and exposed to Nal as for Fig. 2. The cells were then photobleached by exposure to 460- to 500-nm epifluorescent light. (A) Photobleaching trace for a 7- by 7-pixel area containing a DinB-EYFP focus. The x axis shows the number of frames of image capture, with each frame image taken after 300 ms of exposure. The y axis shows the arbitrary intensity values. The gray line shows the values after applying the Chung-Kennedy (C-K) filter (see Materials and Methods). (B) Histogram showing the distribution of PDDF values [ΔI(t) = I(ta) − I(tb) for all data pairs for which the time ta is greater than tb] for the trace shown in panel A. (C) Fourier transform of the PDDF bin values shown in panel B. The dominant peak indicates that the number of steps in the original trace was seven. (D) Histogram showing the distribution of initial focus intensities (the initial value of ROI-focus minus the initial value of ROI-cyto [see Materials and Methods and Table S1 in the supplemental material]) for the 45 photobleaching traces analyzed. Two normal curves were fitted to the data; normal fit 1 encompassed the lower 26 values with a mean of 2,562 and a standard deviation of 791 arbitrary intensity values, and normal fit 2 encompassed the higher 19 values with a mean of 6,556 and a standard deviation of 1,619 arbitrary intensity values. (E) Histogram showing the distribution of intensity drops corresponding to the unitary step size (photobleaching of one DinB-EYFP molecule) for the 45 traces analyzed (see Table S1 in the supplemental material). The normal-fit curve has a mean of 1,076 and a standard deviation of 263 arbitrary intensity values. (F) Histogram showing the distribution of the numbers of DinB-EYFP molecules per focus for the 45 foci analyzed (see Table S1 in the supplemental material). Two normal curves were fitted to the data; normal fit 1 encompassed the lower 26 values with a mean of 2.7 and a standard deviation of 0.8 DinB-EYFP molecules per focus, and normal fit 2 encompassed the higher 19 values with a mean of 5.5 and a standard deviation of 0.7 DinB-EYFP molecules per focus.
FIG 4
FIG 4
Colocalization of Rep with Pol IV after Nal-induced DNA damage. (A) Phase-contrast, fluorescence, and overlay images of DinB-12L-EYFP (yellow) and Rep-mCh (red) focus formation and colocalization with time after Nal exposure. Scale bar = 5 μm. Arrows indicate representative colocalized foci. (B) Percentages of cells containing DinB-EYFP or Rep-mCh foci and percentages of Rep-mCh foci colocalizing with DinB-EYFP foci with time after Nal exposure. Shown are means ± SEM based on ∼200 cells (range = 186 to 274) counted at each time point in two independent experiments. Strain FC40 carrying plasmids pPFB913 and pPFB914 was grown in LB broth plus antibiotics at 37°C until mid-exponential phase (OD600 = 0.5), treated with 40 μg/ml Nal, and incubated for a further 2 h. Samples were withdrawn at 30-min intervals and visualized.
FIG 5
FIG 5
Colocalization of Pol IV with RecA foci after Nal and NQO exposure. (A) Merged phase-contrast and fluorescence images showing RecA-GFP (green) expression after exposure to Nal and NQO. Cells of strain PFB1137 (recA4155-gfp901) were grown in LB broth at 30°C until mid-exponential phase (OD600 = 0.50), treated with 40 μg Nal or 20 μM NQO, and incubated for a further 3 h. Samples were withdrawn every 30 min and visualized. (B) Percentages of cells containing RecA-GFP and mCh-10L-DinB foci and percentages of cells with mCh-10L-DinB foci colocalizing with RecA-GFP foci after 120 min exposure to Nal or NQO. Shown are means ± SEM. The Nal results are from four independent experiments with three different strains carrying recA4115-gfp901 and pPFV407: PFB1137 (ygaD1::Kn), PFB1220 (ygaD+), and PFB1224 (I-SceI lacZo::Kn) (two experiments); the total numbers of cells examined were 65, 130, 66, and 87, respectively. The NQO results are from two independent experiments, one with PFB1137/pPFV407 and one with PFB1224/pPFV407; the total numbers of cells examined were 141 and 60, respectively. The error bars on the last bar are 0. (C) Phase-contrast, fluorescence, and overlay images of RecA-GFP (green) and mCh-10L-DinB (red) foci and colocalization after Nal exposure for 2 h. Scale bars = 5 μm. Arrows indicate representative colocalized foci.
FIG 6
FIG 6
Pol IV localization after double-strand break induction in exponentially growing cells. (A) Phase-contrast, fluorescence, and overlay images of LacI-ECFP and DinB-EYFP foci in cells carrying an I-SceI recognition site 161 kb from the lacO array. The cells were grown in LB broth at 37°C to early exponential phase (OD600, ∼0.1), induced for LacI-ECFP and I-SceI endonuclease, incubated for an additional 1.5 h, and then visualized (see Materials and Methods). Scale bar = 5 μm. Arrows indicate representative colocalized foci. (B) Percentages of cells with LacI-ECFP and DinB-EYFP foci. Shown are means ± SEM. (C) Percentages of cells with DinB-EYFP foci colocalizing with LacI-ECFP. Shown are means ± SEM. WT, PFB1081 carrying plasmids pPFB1035 and pPFB913 (DinB-12L-EYFP); the data are from three independent experiments with 108, 160, and 101 cells observed. ΔdinB, PFB1103 carrying plasmids pPFB1035 and pPFB913 (DinB-12l-EYFP); the data are from three independent experiments with 101, 85, and 69 cells observed. ΔumuDC, PFB1195 carrying plasmids pPFB1035 and pPFB1188 (DinB-20L-EYFP); the data are from two independent experiments with 198 and 207 cells observed. ΔdinB ΔumuDC, PFB1201 carrying plasmids pPFB1035 and pPFB1188 (DinB-20L-EYFP); the data are from three independent experiments with 146, 230, and 189 cells observed.
FIG 7
FIG 7
Pol IV focus localization after double-strand break induction in stationary-phase cells. (A) Phase-contrast, fluorescence, and overlay images of LacI-ECFP and DinB-EYFP foci following DSB induction in stationary-phase cells. The cells were grown in LB broth at 30°C until early stationary phase (OD600, ∼1.0), induced for LacI-ECFP and I-SceI endonuclease, incubated for another 2.5 h, and then visualized (see Materials and Methods). Scale bar = 5 μm. Arrows indicate representative colocalized foci. (B) Percentages of cells with LacI and DinB foci in stationary-phase cells with and without induction of LacI-ECFP and I-SceI endonuclease from the experiment described in the legend to panel A. Shown are means ± SEM. (C) Percentages of cells with DinB foci colocalizing with LacI. Shown are means ± SEM. ΔdinB, PFB1271 carrying plasmids pPFB1035 and pPFB1188 (DinB-20L-EYFP); the control data are from two independent experiments with 226 and 320 cells observed; the Ara plus AHT data are from three independent experiments with 405, 430, and 394 cells observed. ΔdinB ΔumuDC, PFB1279 carrying plasmids pPFB1035 and pPFB1188 (DinB-20L-EYFP); the control data are from two independent experiments with 178 and 244 cells observed; the Ara plus AHT data are from three independent experiments with 272, 318, and 499 cells observed.
FIG 8
FIG 8
RecA-GFP and mCh-DinB colocalization after double-strand break induction. (A) Phase-contrast, fluorescence, and overlay images of RecA-GFP and mCh-DinB focus localization after I-SceI endonuclease induction. Strain PFB1137 carrying plasmids pPFB1035 and pPFV407 was grown at 30°C until mid-exponential phase (OD600 = 0.2), induced for I-SceI endonuclease, incubated another 1.5 h, and visualized (see Materials and Methods). Scale bar = 5 μm. Arrows indicate representative colocalized foci. (B) Distribution of RecA-GFP, mCh-DinB, and colocalizing foci in cells after DSB induction in the experiment described in the legend to panel A. Shown are means ± SEM from three independent experiments with 144, 161, and 156 cells observed.
FIG 9
FIG 9
LacI-ECFP, RecA-GFP, and mCh-DinB localization after double-strand break induction. The phase-contrast and fluorescence images show mCh-DinB (red), LacI-ECFP (cyan), and RecA-GFP (green) focus localizations after induction of LacI-DCFP and I-SceI endonuclease. The overlay images show false-colored focus colocalizations; mCh-DinB (red) and LacI-ECFP (cyan); mCh-DinB (red) and RecA-GFP (green); RecA-GFP (green) and LacI-ECFP (magenta); and mCh-DinB (red), RecA-GFP (green), and LacI-ECFP (cyan). Strain PFB1224 carrying plasmids pPFB1035 and pPFV407 was grown in LB broth at 30°C to an OD600 of 0.2, induced for LacI-ECFP and I-SceI endonuclease, incubated for an additional 1.5 h, and visualized. Scale bar = 5 μm. Arrows indicate representative colocalized foci.

References

    1. Janion C. 2008. Inducible SOS response system of DNA repair and mutagenesis in Escherichia coli. Int J Biol Sci 4:338–344. - PMC - PubMed
    1. Al Mamun AA, Humayun MZ. 2006. Escherichia coli DNA polymerase II can efficiently bypass 3,N(4)-ethenocytosine lesions in vitro and in vivo. Mutat Res 593:164–176. doi:10.1016/j.mrfmmm.2005.07.016. - DOI - PubMed
    1. Napolitano R, Janel-Bintz R, Wagner J, Fuchs RP. 2000. All three SOS-inducible DNA polymerases (Pol II, Pol IV and Pol V) are involved in induced mutagenesis. EMBO J 19:6259–6265. doi:10.1093/emboj/19.22.6259. - DOI - PMC - PubMed
    1. Rangarajan S, Woodgate R, Goodman MF. 1999. A phenotype for enigmatic DNA polymerase II: a pivotal role for pol II in replication restart in UV-irradiated Escherichia coli. Proc Natl Acad Sci U S A 96:9224–9229. doi:10.1073/pnas.96.16.9224. - DOI - PMC - PubMed
    1. Goodman MF, Woodgate R. 2013. Translesion DNA polymerases. Cold Spring Harb Perspect Biol 5:a010363. doi:10.1101/cshperspect.a010363. - DOI - PMC - PubMed

Publication types

MeSH terms

LinkOut - more resources