

Using Data Independent Acquisition (DIA) to Model High-responding Peptides for Targeted Proteomics Experiments
- PMID: 26100116
- PMCID: PMC4563719
- DOI: 10.1074/mcp.M115.051300
Using Data Independent Acquisition (DIA) to Model High-responding Peptides for Targeted Proteomics Experiments
Abstract
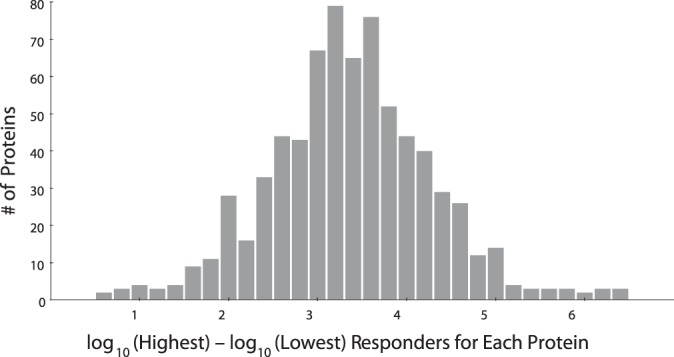
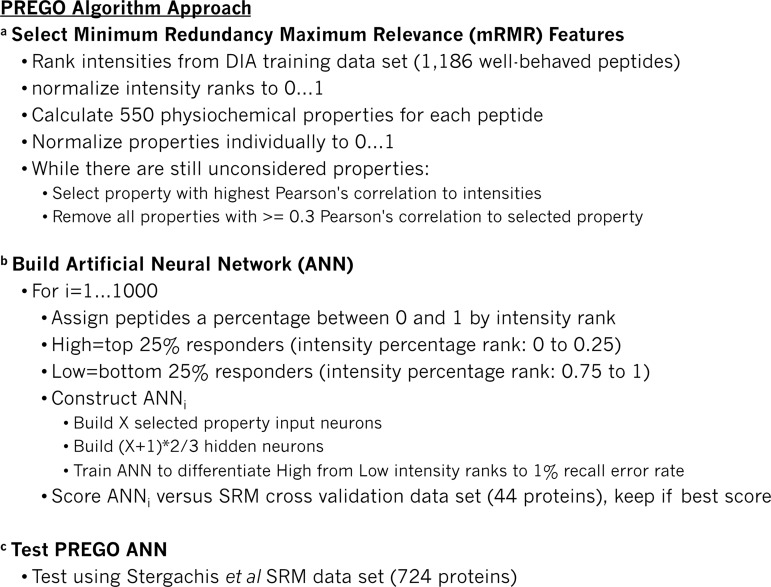
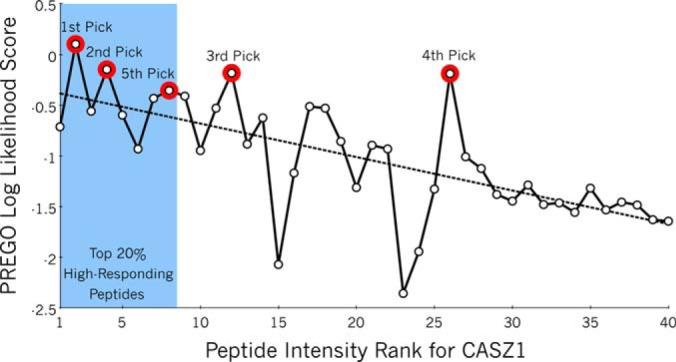
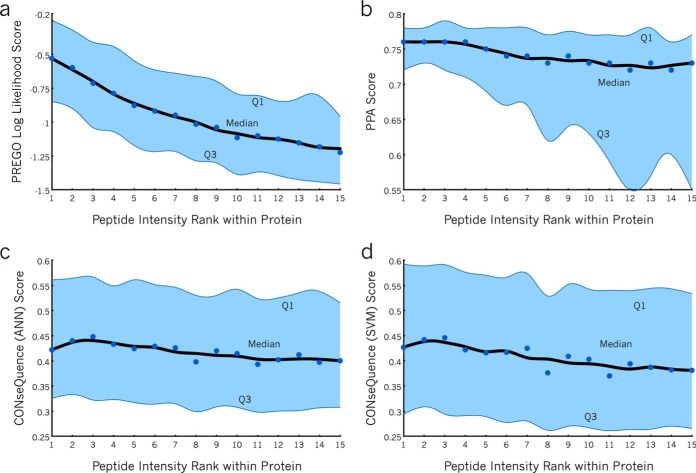
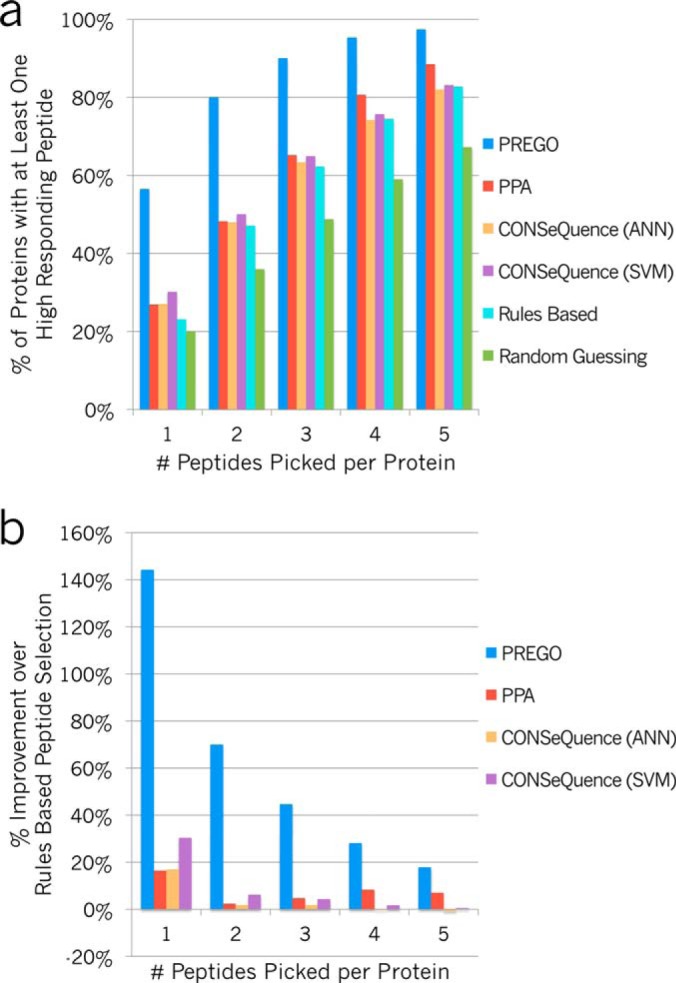
Targeted mass spectrometry is an essential tool for detecting quantitative changes in low abundant proteins throughout the proteome. Although selected reaction monitoring (SRM) is the preferred method for quantifying peptides in complex samples, the process of designing SRM assays is laborious. Peptides have widely varying signal responses dictated by sequence-specific physiochemical properties; one major challenge is in selecting representative peptides to target as a proxy for protein abundance. Here we present PREGO, a software tool that predicts high-responding peptides for SRM experiments. PREGO predicts peptide responses with an artificial neural network trained using 11 minimally redundant, maximally relevant properties. Crucial to its success, PREGO is trained using fragment ion intensities of equimolar synthetic peptides extracted from data independent acquisition experiments. Because of similarities in instrumentation and the nature of data collection, relative peptide responses from data independent acquisition experiments are a suitable substitute for SRM experiments because they both make quantitative measurements from integrated fragment ion chromatograms. Using an SRM experiment containing 12,973 peptides from 724 synthetic proteins, PREGO exhibits a 40-85% improvement over previously published approaches at selecting high-responding peptides. These results also represent a dramatic improvement over the rules-based peptide selection approaches commonly used in the literature.
© 2015 by The American Society for Biochemistry and Molecular Biology, Inc.
Figures
Similar articles
-
A computational tool to detect and avoid redundancy in selected reaction monitoring.Mol Cell Proteomics. 2012 Aug;11(8):540-9. doi: 10.1074/mcp.M111.013045. Epub 2012 Apr 24. Mol Cell Proteomics. 2012. PMID: 22535207 Free PMC article.
-
SeFilter-DIA: Squeeze-and-Excitation Network for Filtering High-Confidence Peptides of Data-Independent Acquisition Proteomics.Interdiscip Sci. 2024 Sep;16(3):579-592. doi: 10.1007/s12539-024-00611-4. Epub 2024 Mar 12. Interdiscip Sci. 2024. PMID: 38472692
-
PeptidePicker: a scientific workflow with web interface for selecting appropriate peptides for targeted proteomics experiments.J Proteomics. 2014 Jun 25;106:151-61. doi: 10.1016/j.jprot.2014.04.018. Epub 2014 Apr 22. J Proteomics. 2014. PMID: 24769191
-
Multiplexed and data-independent tandem mass spectrometry for global proteome profiling.Mass Spectrom Rev. 2014 Nov-Dec;33(6):452-70. doi: 10.1002/mas.21400. Epub 2013 Nov 26. Mass Spectrom Rev. 2014. PMID: 24281846 Review.
-
A review on mass spectrometry-based quantitative proteomics: Targeted and data independent acquisition.Anal Chim Acta. 2017 Apr 29;964:7-23. doi: 10.1016/j.aca.2017.01.059. Epub 2017 Feb 2. Anal Chim Acta. 2017. PMID: 28351641 Review.
Cited by
-
SWATH-MS and MRM: Quantification of Ras-related proteins in HIV-1 infected and methamphetamine-exposed human monocyte-derived macrophages (hMDM).Proteomics. 2021 Aug;21(15):e2100005. doi: 10.1002/pmic.202100005. Epub 2021 Jun 17. Proteomics. 2021. PMID: 34051048 Free PMC article.
-
A TRUSTED targeted mass spectrometry assay for pan-herpesvirus protein detection.Cell Rep. 2022 May 10;39(6):110810. doi: 10.1016/j.celrep.2022.110810. Cell Rep. 2022. PMID: 35545036 Free PMC article.
-
Insight on physicochemical properties governing peptide MS1 response in HPLC-ESI-MS/MS: A deep learning approach.Comput Struct Biotechnol J. 2023 Jul 22;21:3715-3727. doi: 10.1016/j.csbj.2023.07.027. eCollection 2023. Comput Struct Biotechnol J. 2023. PMID: 37560124 Free PMC article.
-
A Skyline Plugin for Pathway-Centric Data Browsing.J Am Soc Mass Spectrom. 2016 Nov;27(11):1752-1757. doi: 10.1007/s13361-016-1448-3. Epub 2016 Aug 16. J Am Soc Mass Spectrom. 2016. PMID: 27530777
-
CIDer: A Statistical Framework for Interpreting Differences in CID and HCD Fragmentation.J Proteome Res. 2021 Apr 2;20(4):1951-1965. doi: 10.1021/acs.jproteome.0c00964. Epub 2021 Mar 17. J Proteome Res. 2021. PMID: 33729787 Free PMC article.
References
Publication types
MeSH terms
Substances
Grants and funding
LinkOut - more resources
Full Text Sources
Other Literature Sources
