Randomized Controlled Trial
. 2015 Jun 23:11:140.
doi: 10.1186/s12917-015-0452-3.

Immune response of healthy horses to DNA constructs formulated with a cationic lipid transfection reagent

Affiliations
Randomized Controlled Trial

Immune response of healthy horses to DNA constructs formulated with a cationic lipid transfection reagent

Christiane L Schnabel et al. BMC Vet Res. .

Abstract

Background: Deoxyribonucleic acid (DNA) vaccines are used for experimental immunotherapy of equine melanoma. The injection of complexed linear DNA encoding interleukin (IL)-12/IL-18 induced partial tumour remission in a clinical study including 27 grey horses. To date, the detailed mechanism of the anti-tumour effect of this treatment is unknown.

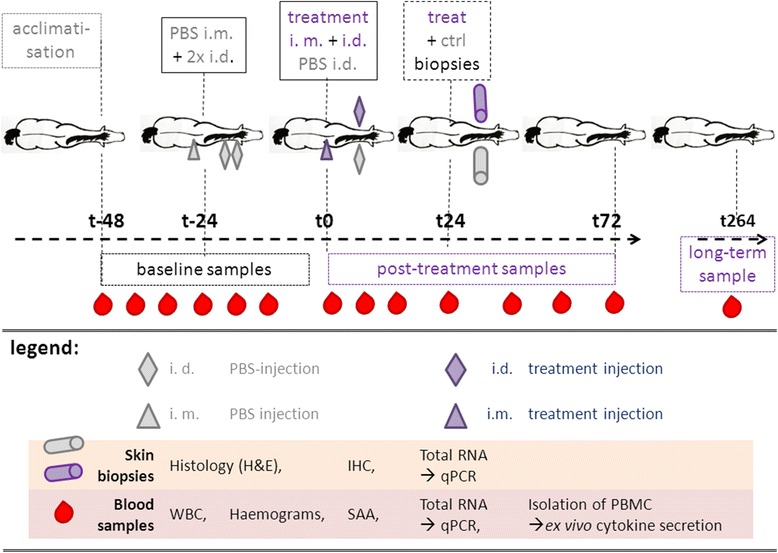
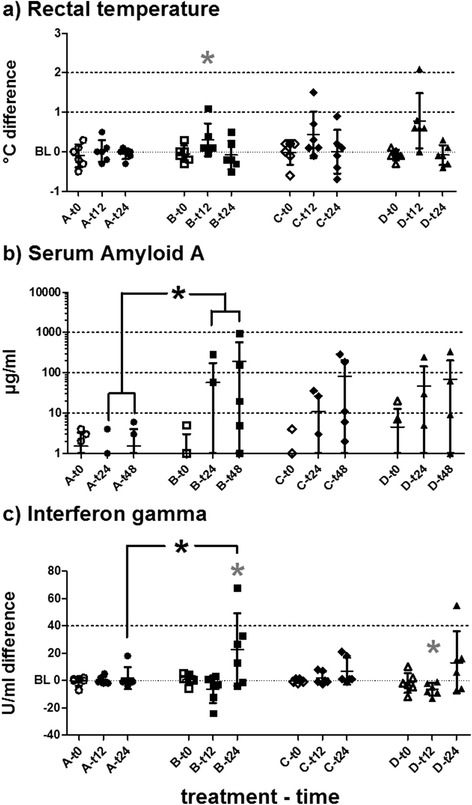
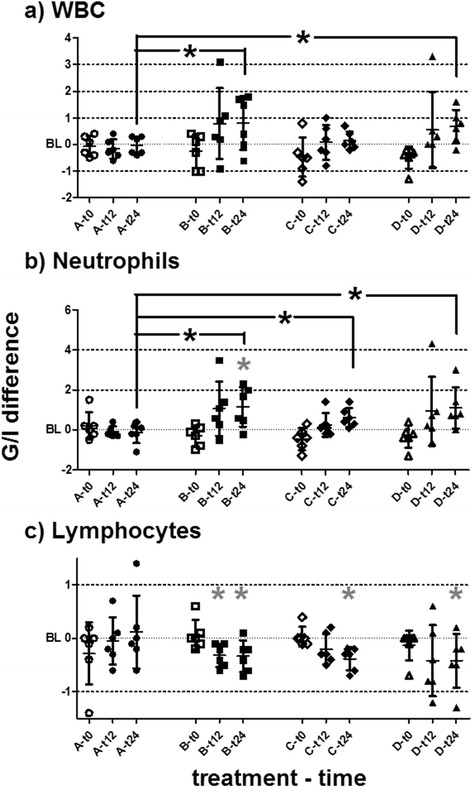
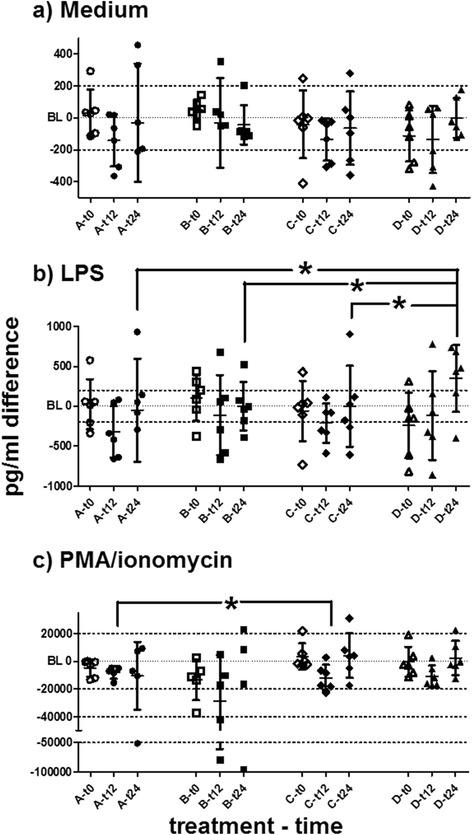
Results: In the present study, the clinical and cellular responses of 24 healthy horses were monitored over 72 h after simultaneous intradermal and intramuscular application of equine IL-12/IL-18 DNA (complexed with a transfection reagent) or comparative substances (transfection reagent only, nonsense DNA, nonsense DNA depleted of CG). Although the strongest effect was observed in horses treated with expressing DNA, horses in all groups treated with DNA showed systemic responses. In these horses treated with DNA, rectal temperatures were elevated after treatment and serum amyloid A increased. Total leukocyte and neutrophil counts increased, while lymphocyte numbers decreased. The secretion of tumour necrosis factor alpha (TNFα) and interferon gamma (IFNγ) from peripheral mononuclear blood cells ex vivo increased after treatments with DNA, while IL-10 secretion decreased. Horses treated with DNA had significantly higher myeloid cell numbers and chemokine (C-X-C motif) ligand (CXCL)-10 expression in skin samples at the intradermal injection sites compared to horses treated with transfection reagent only, suggesting an inflammatory response to DNA treatment. In horses treated with expressing DNA, however, local CXCL-10 expression was highest and immunohistochemistry revealed more intradermal IL-12-positive cells when compared to the other treatment groups. In contrast to non-grey horses, grey horses showed fewer effects of DNA treatments on blood lymphocyte counts, TNFα secretion and myeloid cell infiltration in the dermis.

Conclusion: Treatment with complexed linear DNA constructs induced an inflammatory response independent of the coding sequence and of CG motif content. Expressing IL-12/IL-18 DNA locally induces expression of the downstream mediator CXCL-10. The grey horses included appeared to display an attenuated immune response to DNA treatment, although grey horses bearing melanoma responded to this treatment with moderate tumour remission in a preceding study. Whether the different immunological reactivity compared to other horses may contributes to the melanoma susceptibility of grey horses remains to be elucidated.


Figures

Fig. 1
Fig. 1
Procedure Test procedure illustrated in course of time. The horses were left to acclimatise for at least three days. At t-24, the horses were injected with PBS (grey symbols) i.m. (0.5 ml) and i.d. (2 × 0.5 ml). Baseline samples (blood) as internal controls for systemic parameters were acquired from t-48 – t0. At t0, horses were injected with treatments A – D (purple symbols) i.m. (0.5 ml) and i.d. (0.5 ml) and contralaterally with PBS (grey symbol, 0.5 ml). From t6 – t72, post-treatment samples (blood) of systemic parameters were acquired. At t24, skin biopsies were acquired of treatment (purple) and PBS control (grey) sites. Eleven days post-treatment (t264), one long-term sample was acquired at the home stable of each horse. General examinations were performed at all sampling times. Blood samples were used to determine WBC, haemograms, SAA, cytokine mRNA and ex vivo cytokine secretion by PBMC. Skin samples were used to perform histological examinations, IHC of IL-12, IL-18 and calprotectin, and qPCR of cytokine and chemokine mRNA
Fig. 2
Fig. 2
Responses to treatments. a Rectal temperature differences to individual time-of-day matched baselines (BL), (b) Serum Amyloid A (SAA, absolute concentrations) and (c) Interferon gamma (IFNγ) differences to individual baselines in PBMC supernatants (medium only) are plotted in histograms for t0 and two measurements post-treatment. Datasets are marked as (group)-(hours post-treatment) at the X-axis. Horizontal bars represent mean and SD. Grey asterisks (*) represent significant differences from baseline in the respective dataset. Asterisks (*) with brackets (┌ ┌) represent significantly different comparisons. Group B showed values significantly different from baseline in rectal temperatures at t12 and in IFNγ at t24. Horses of this group, furthermore, differed significantly from group A in SAA measurements and IFNγ post-treatment
Fig. 3
Fig. 3
Leucocyte counts. Leucocyte quantities in peripheral blood measured by automated haematology systems are plotted as differences to individual time-of-day matched baselines (BL) for t0, t12 and t24. Datasets are marked as (group)-(hours post-treatment) at the X-axes. Horizontal bars represent mean and SD. Grey asterisks (*) represent significant differences from baseline in the respective dataset. Asterisks (*) with brackets (┌ ┌) represent significantly different comparisons. a Increases of WBC induced by B and D at t24 were significantly higher than in A. b The increase in neutrophils was significantly different from baseline in B at t24. Group A showed significantly less treatment effects than B, C and D at t24. c In comparison to individual baselines, lymphocyte numbers decreased significantly after treatment B at t12 and t24, and at t24 in C and D
Fig. 4
Fig. 4
Tumour necrosis factor alpha. Tumour necrosis factor alpha differences to individual baselines in PBMC supernatants measured by ELISA are plotted for releases (a) in medium only, (b) after LPS stimulation and (c) after PMA/ionomycin stimulation for t0, t12 and t24. Datasets are marked as (group)-(hours post-treatment) at the X-axes. Horizontal bars represent mean and SD. Grey asterisks (*) represent significant differences from baseline in the respective dataset. Asterisks (*) with brackets (┌ ┌) represent significantly different comparisons. The increase of TNFα could be statistically noticed in B (t12, medium and LPS), in C (t12, LPS) and in D (t24, medium and LPS). Treatment effects after LPS stimulation at t12 in C or D were higher than in A. Treatments containing DNA (B – D) induced higher TNFα secretion than transfection reagent alone (A)
Fig. 5
Fig. 5
Interleukin 10. Interleukin 10 differences to individual baselines in PBMC supernatants measured by a bead-based assay are plotted for releases (a) in medium only, (b) after LPS stimulation and (c) after PMA/ionomycin stimulation. Data presented at t0, t12 and t24. Datasets are marked as (group)-(hours post-treatment) at the X-axes. Horizontal bars represent mean and SD. Asterisks (*) with brackets (┌ ┌) represent significantly different comparisons. Interleukin 10 decreased after all treatments. Treatment effects after LPS stimulation (b) in group D at t24 (increase) differed significantly from those in A, B and C. After PMA and ionomycin stimulation, treatment effects in C (decrease) differed significantly from those in a (near baseline) at t12. The greatest interindividual variances were seen in group b
Fig. 6
Fig. 6
Immunohistochemistry results. Mean positive cells per FOV are plotted for the papillary dermis (Dpap, top) and the reticular dermis (Dret, bottom) for each treatment (A – D) and site (Ctrl: control; treat: local treatment) for calprotectin (a, b), Interleukin (IL)12 (c, d) and IL-18 (e, f) determined by immunohistochemistry. Median, quartiles, minimum and maximum plotted for each dataset. Asterisks (*) with brackets (┌ ┌) and same letters (Aa, Bb) represent significantly different comparisons. Treat samples overall contained significantly more calprotectin-positive cells and IL-12 positive cells than ctrls in the Dpap (a), and Dret (b). For single comparisons, this was significant in Dret (b) in treatment groups A (Aa) and B (Bb). Control samples of A had significantly fewer calprotectin-, IL-18- and IL-12-positive cells than those of other treatment groups. Treat samples of B contained significantly more calprotectin-positive cells in Dret than those of A (*)
Fig. 7
Fig. 7
Treatment effects on messenger ribonucleic acid expression in the skin. The treat-ctrl differences of copy numbers of IL-18 (a) and CXCL-10 (b) measured by qPCR in skin samples are shown in histograms. Horizontal bars represent medians and ranges. Asterisks (*) with brackets (┌ ┌) represent significantly different comparisons. The expressions of IL-18 increased by local treatment in comparison to ctrls in groups B – D. The expression of CXCL-10 in skin biopsies of the treat site was significantly higher overall than in the ctrl samples in all treatment groups. The treat-ctrl difference (b) of copy numbers examined was significantly lower in A than in the other treatment groups. Group B, furthermore, displayed significantly higher treat-ctrl differences of CXCL-10 copy numbers than C or D
Fig. 8
Fig. 8
Influence of colour. The results of horses treated with DNA (groups B – D) are summarized. Differences of (a) lymphocytes and (b) TNFα release after LPS stimulation to individual baselines calculated at t12 and t24 are plotted in histograms for grey horses (grey) and horses of other colours (other). Calprotectin-positive cells in five fields of view (FOV) are plotted (c) for the papillary dermis (Dpap), and (d) the reticular dermis (Dret) in histograms for PBS ctrl and treat sites. Horizontal bars represent mean and SD. Asterisks (*) with brackets (┐ ┐) represent significantly different comparisons. Lymphocyte decreases (a) to individual time-of-day matched baselines were significantly less in grey than in other horses. The TNFα increases to individual baselines in PBMC supernatants were significantly lower in grey than in other horses. Significantly fewer calprotectin-positive cells were found in the Dret (b) of treat sites of grey horses than in samples of non-grey (other) horses

Similar articles

Cited by

References

    1. Cavalleri JMV, Mählmann K, Steinig P, Feige K. Aetiology, clinical presentation and current treatment options of equine malignant melanoma - a review of the literature. Pferdeheilkunde. 2014;30(4):455–60.
    1. Cotchin E. A general survey of tumours in the horse. Equine Vet J. 1977;9(1):16–21. doi: 10.1111/j.2042-3306.1977.tb03964.x. - DOI - PubMed
    1. Valentine BA. Survey of equine cutaneous neoplasia in the Pacific Northwest. J Vet Diagn Invest. 2006;18(1):123–6. doi: 10.1177/104063870601800121. - DOI - PubMed
    1. Phillips JC, Lembcke LM. Equine melanocytic tumors. Vet Clin North Am Equine Pract. 2013;29(3):673–87. doi: 10.1016/j.cveq.2013.08.008. - DOI - PubMed
    1. Mcfadyean J. Equine melanomatosis. J Comp Path Ther. 1933;46:186–204. doi: 10.1016/S0368-1742(33)80025-7. - DOI

Publication types

MeSH terms