

Multiple signatures of a disease in potential biomarker space: Getting the signatures consensus and identification of novel biomarkers
- PMID: 26100469
- PMCID: PMC4474413
- DOI: 10.1186/1471-2164-16-S7-S2
Multiple signatures of a disease in potential biomarker space: Getting the signatures consensus and identification of novel biomarkers
Abstract
Background: The lack of consensus among reported gene signature subsets (GSSs) in multi-gene biomarker discovery studies is often a concern for researchers and clinicians. Subsequently, it discourages larger scale prospective studies, prevents the translation of such knowledge into a practical clinical setting and ultimately hinders the progress of the field of biomarker-based disease classification, prognosis and prediction.
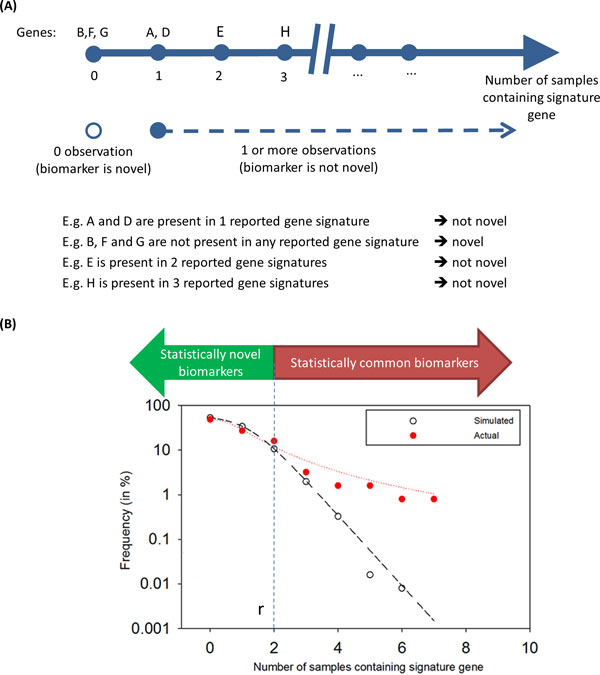
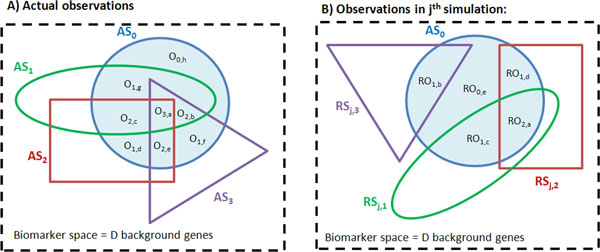
Methods: We define all "gene identificators" (gIDs) as constituents of the entire potential disease biomarker space. For each gID in a GSS of interest ("tested GSS"/tGSS), our method counts the empirical frequency of gID co-occurrences/overlaps in other reference GSSs (rGSSs) and compares it with the expected frequency generated via implementation of a randomized sampling procedure. Comparison of the empirical frequency distribution (EFD) with the expected background frequency distribution (BFD) allows dichotomization of statistically novel (SN) and common (SC) gIDs within the tGSS.
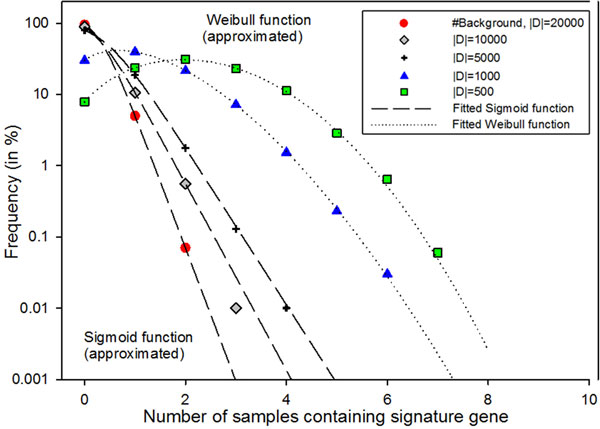
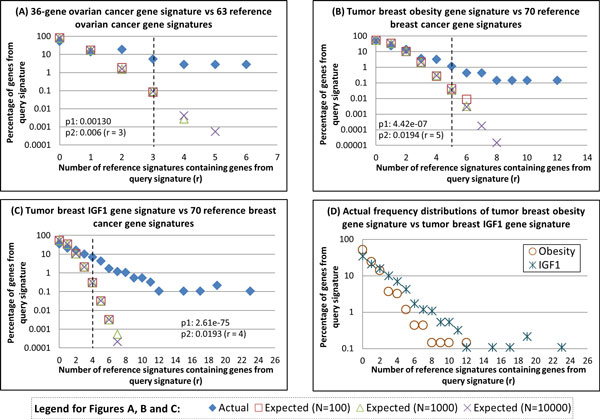
Results: We identify SN or SC biomarkers for tGSSs obtained from previous studies of high-grade serous ovarian cancer (HG-SOC) and breast cancer (BC). For each tGSS, the EFD of gID co-occurrences/overlaps with other rGSSs is characterized by scale and context-dependent Pareto-like frequency distribution function. Our results indicate that while independently there is little overlap between our tGSS with individual rGSSs, comparison of the EFD with BFD suggests that beyond a confidence threshold, tested gIDs become more common in rGSSs than expected. This validates the use of our tGSS as individual or combined prognostic factors. Our method identifies SN and SC genes of a 36-gene prognostic signature that stratify HG-SOC patients into subgroups with low, intermediate or high-risk of the disease outcome. Using 70 BC rGSSs, the method also predicted SN and SC BC prognostic genes from the tested obesity and IGF1 pathway GSSs.
Conclusions: Our method provides a strategy that identify/predict within a tGSS of interest, gID subsets that are either SN or SC when compared to other rGSSs. Practically, our results suggest that there is a stronger association of the IGF1 signature genes with the 70 BC rGSSs, than for the obesity-associated signature. Furthermore, both SC and SN genes, in both signatures could be considered as perspective prognostic biomarkers of BCs that stratify the patients onto low or high risks of cancer development.
Figures
Similar articles
-
Identification of common oncogenic and early developmental pathways in the ovarian carcinomas controlling by distinct prognostically significant microRNA subsets.BMC Genomics. 2017 Oct 3;18(Suppl 6):692. doi: 10.1186/s12864-017-4027-5. BMC Genomics. 2017. PMID: 28984201 Free PMC article.
-
Meta-analysis of transcriptome reveals let-7b as an unfavorable prognostic biomarker and predicts molecular and clinical subclasses in high-grade serous ovarian carcinoma.Int J Cancer. 2014 Jan 15;134(2):306-18. doi: 10.1002/ijc.28371. Epub 2013 Aug 7. Int J Cancer. 2014. PMID: 23825028
-
Genes and functions from breast cancer signatures.BMC Cancer. 2018 Apr 27;18(1):473. doi: 10.1186/s12885-018-4388-4. BMC Cancer. 2018. PMID: 29699511 Free PMC article.
-
"Stemness" genomics law governs clinical behavior of human cancer: implications for decision making in disease management.J Clin Oncol. 2008 Jun 10;26(17):2846-53. doi: 10.1200/JCO.2008.17.0266. J Clin Oncol. 2008. PMID: 18539963 Review.
-
[Clinical and molecular diagnosis of inherited breast-ovarian cancer].J Gynecol Obstet Biol Reprod (Paris). 2003 Apr;32(2):101-19. J Gynecol Obstet Biol Reprod (Paris). 2003. PMID: 12717301 Review. French.
Cited by
-
Recommendations for the Application of Sex and Gender Medicine in Preclinical, Epidemiological and Clinical Research.J Pers Med. 2024 Aug 27;14(9):908. doi: 10.3390/jpm14090908. J Pers Med. 2024. PMID: 39338162 Free PMC article. Review.
-
Genome and transcriptome delineation of two major oncogenic pathways governing invasive ductal breast cancer development.Oncotarget. 2015 Nov 3;6(34):36652-74. doi: 10.18632/oncotarget.5543. Oncotarget. 2015. PMID: 26474389 Free PMC article.
-
Education, collaboration, and innovation: intelligent biology and medicine in the era of big data.BMC Genomics. 2015;16 Suppl 7(Suppl 7):S1. doi: 10.1186/1471-2164-16-S7-S1. Epub 2015 Jun 11. BMC Genomics. 2015. PMID: 26099197 Free PMC article.
-
Identification of disease modules using higher-order network structure.Bioinform Adv. 2023 Oct 4;3(1):vbad140. doi: 10.1093/bioadv/vbad140. eCollection 2023. Bioinform Adv. 2023. PMID: 37860106 Free PMC article.
-
Circulating miR-16-5p, miR-92a-3p, and miR-451a in Plasma from Lung Cancer Patients: Potential Application in Early Detection and a Regulatory Role in Tumorigenesis Pathways.Cancers (Basel). 2020 Jul 27;12(8):2071. doi: 10.3390/cancers12082071. Cancers (Basel). 2020. PMID: 32726984 Free PMC article.
References
Publication types
MeSH terms
Substances
LinkOut - more resources
Full Text Sources
Medical
Miscellaneous
