. 2015 Jun 23:6:7454.
doi: 10.1038/ncomms8454.

Aquaporin-3-mediated hydrogen peroxide transport is required for NF-κB signalling in keratinocytes and development of psoriasis

Affiliations

Aquaporin-3-mediated hydrogen peroxide transport is required for NF-κB signalling in keratinocytes and development of psoriasis

Mariko Hara-Chikuma et al. Nat Commun. .

Abstract

Aquaporin 3 (AQP3), a water/glycerol channel protein, has been found to transport hydrogen peroxide (H2O2). Here, we show that H2O2, imported via AQP3, is involved in nuclear factor-κB (NF-κB) signalling in keratinocytes and in the pathogenesis of psoriasis. IL-23-mediated induction of psoriasis is reduced in AQP3 knockout mice (AQP3(-/-)), and is accompanied by impaired NF-κB activation and intracellular H2O2 accumulation. In primary keratinocyte cultures, cellular import of H2O2 produced by membrane NADPH oxidase 2 (Nox2) in response to TNF-α is facilitated by AQP3 and required for NF-κB activation by regulation of protein phosphatase 2A. As AQP3 associates with Nox2, we propose that this interplay constitutes H2O2-mediated signalling in response to TNF-α stimulation. Collectively, these data indicate that AQP3-facilitated H2O2 transport is required for NF-κB activation in keratinocytes in the development of psoriasis.


Conflict of interest statement

Competing financial interests: The authors declare no competing financial interests.

Figures

Figure 1
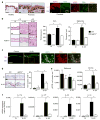
Figure 1. Impaired IL-23-induced psoriasis-like skin in AQP3 −/− mice
(a) Left: representative immunohistochemical staining for AQP3 in the skin from five healthy volunteers and 18 psoriatic patients. Right: immunostaining with anti-AQP3 (cy3, red) and anti-CD3 (FITC, green) in psoriatic skin. Scale bar, 100 μm. Epi, epidermis; der, dermis. (bf) IL-23 (500 ng) or vehicle control (PBS) was intradermally injected daily into the ear skin of WT and AQP3 −/− mice for 4 days. Skin samples were excised at 24 h after the final IL-23 injection. (b) Left: haematoxylin and eosin staining of ears from WT and AQP3 −/− mice. Scale bar, 100 μm. Arrow head, infiltrating lymphocytes. Right: whole skin and epidermal thickness determined from haematoxylin and eosin staining (s.e., n =5, *P<0.01 by t-test).(c) Immunostaining with anti-AQP3 (FITC, green) and anti-CD3 (cy3, red) in WT mouse skin. Scale bar, 100 μm (left), 20 μm (right). (d) Left: representative immunohistochemical staining for Ki67. Right: the ratio of Ki67 positive cells in the epidermis (s.e., n =3, *P<0.01 by t-test). (e) CD3 + γδTCR + cell numbers in epidermis and dermis from WT and AQP3 −/− mice analysed by flow cytometry (s.e., n =4–5, *P<0.01 by t-test). (f) mRNA expression of IL-17A, IL-17F, IL-22 and IL-19 in skin tissues determined by real-time RT–PCR (s.e., n =4–5,*P<0.01 by t-test). Data are expressed as the ratio to GAPDH.
Figure 2
Figure 2. Impaired IL-23-induced psoriasis is dependent on AQP3 expression in both keratinocytes and T cells
(a,b) IL-23-induced psoriatic model using bone marrow (BM) cell-transferred mice. Recipient WT and AQP3 −/− mice (Rec) received transplants of BM cells from donor WT and AQP3 −/− mice (Don). (a) Ear thickness at 24 h after final injections (s.e., n =5, *P<0.01 by t-test). (b) Representative haematoxylin and eosin staining. Scale bar, 100 μm. (c) Chemotaxis assay. The migration efficiency of CD3 + T cells toward the ligands CCL20 (100 ng ml−1) or CXCL9 (100 ng ml −1) was determined using a transwell chamber with 5 μm pores. Data are expressed as the percentage of applied cells (s.e., n =5, *P<0.01 by t-test). (d) mRNA expression levels of CCR6 in epidermis (left) and CXCR3 in dermis (right) by real-time RT–PCR (s.e., n =5, *P<0.01 by t-test). (e) mRNA expression levels of IL-17A and IL-17F by real-time RT–PCR in sorted T cells incubated with IL-23 in the presence of CD3/28 for 3 days (s.e., n =5, *P<0.01 by t-test). Data are expressed as the IL-17/GAPDH ratio. (f) IL-22 level by ELISA in the culture medium with IL-23 in the presence of anti-IL-4 and anti-IFNγ for 3 days (s.e., n =5, *P<0.01 by t-test).
Figure 3
Figure 3. AQP3 deficiency impairs H2O2 elevation and NF-κB activation in IL-23-treated skin
(a,b) Mice were injected with IL-23 into the ear as described in Fig. 1. (a) Immunostaining of phospho-p65 in PBS (control) or IL-23 injected WT and AQP3 −/− skin. Scale bar, 100 μm. (b) Representative immunoblot analysis using antibodies against phospho-Iκβα, Iκβα and β-actin. Experiments were performed in two other independent experiments with similar results. (ce) Haematoxylin and eosin staining (c), ear thickness (d) and phospho-p65 immunostaining (e) of ears from WT mice treated daily with IL-23 or PBS (control) in the presence of anti-TNF-α blocking monoclonal antibody or isotype control. (f) H2DCFDA fluorescence in the skin treated with IL-23 (three continuous applications) with or without anti-TNF-α antibody. Anti-TNF-α antibody was injected 1 h before sampling. (g) H2DCFDA fluorescence in WT and AQP3 −/− skin treated daily with PBS (control) or IL-23 by fluorescence microscopy. (h) The mean fluorescence intensity (MFI) of H2DCFDA by FACS analysis in epidermal cells (s.e., n = 5, *P<0.05, **P<0.01 by t-test).
Figure 4
Figure 4. Impaired TNF-α-induced NF-κB activation in AQP3-deficient keratinocytes
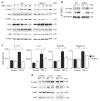
(a,b) Primary keratinocytes from WT and AQP3 −/− mice were incubated with TNF-α (100 ng ml −1) for 5 min to 1 h. (a) Representative immunoblot using antibodies against phospho-IKKβ, IKKβ, phospho-Iκβα, Iκβα, phospho-p65, p65 and β-actin at indicated times. (b) Cell lysate (TNF-α, 100 ng ml −1, 5 min) was immunoprecipitated with anti-TNFR1. Immunoblot was performed with anti-Traf2, anti-RIP1 and anti-TNFR1. Ct, control; T, TNF-α. Experiments in a and b were performed in two other independent experiments with similar results. (c) mRNA expression in primary keratinocytes by real-time RT–PCR. Cells from WT and AQP3−/− mice were incubated with TNF-α (100 ng ml −1) for 24 h. Data are expressed as the ratio to GAPDH (s.e., n =5, *P<0.05, **P<0.01 by t-test). (d) Primary keratinocytes from WT and AQP3 −/− mice were incubated with IL-22 (100 ng ml −1, 10 min) or IFNγ (100 ng ml −1, 10 min). Representative immunoblot analysis with anti-phospho-Stat3, -Jak2, Stat3 or Jak2. A second set of experiments gave similar results.
Figure 5
Figure 5. AQP3-dependent H2O2 permeability in keratinocytes
(a, b) H2O2 uptake into primary cultured keratinocytes. Keratinocytes were incubated with H2O2 (10 to 300 μM), and cellular H2O2 was detected using CM-H2DCFDA fluorescence using a plate reader. (a) Representative fluorescence intensity of CM-H2DCFDA. (b) Increased fluorescence intensity at 15 s after addition of H2O2 (s.e., n = 5, *P<0.01, H2O2 added versus control cells by t-test). (cd) Intracellular H2O2 was monitored by CM-H2DCFDA fluorescence with TNF-α stimulation (100 ng ml− 1). (c) Representative fluorescence intensity in WT and AQP3 −/− cells. (d) Cells were incubated with DPI (5 μM), catalase (2,000 U ml −1) or vehicle (PBS) for 30 min, and followed by TNF-α (100 ng ml −1) for 30 s (s.e., n =5, *P<0.01 by t-test). (e) WT and AQP3 −/− cells transfected with HyPer were incubated with TNF-α (100 ng ml −1) or H2O2 (100 μM) for 3 min. Representative immunofluorescence. Scale bar, 20 μm. (f) Cellular H2O2 after stimulation by TNF-α (100 ng ml −1) or H2O2 (100 μM) in primary keratinocytes from WT, AQP3−/−, or Nox2−/− mice using CM-H2DCFDA fluorescence (1 min, s.e., n = 7, *P<0.01 by t-test). (g) Left: immunoblot of AQP3 and Nox2 in membrane-rich fraction from WT, AQP3 −/− and Nox2 −/− keratinocytes. Right: cell lysates by RIPA were immunoprecipitated with anti-AQP3 or anti-Nox2 showing the interaction between endogenous AQP3 and Nox2.
Figure 6
Figure 6. AQP3-dependent H2O2 accumulation in keratinocytes regulates NF-κB activation
(a) Left: representative immunofluorescence of p65 in keratinocytes from WT and AQP3 −/− mice. Cells were stimulated with TNF-α (100 ng ml −1) for 1 h. Some cells were incubated with catalase (2,000 U ml−1) or DPI (5 μM) for 30 min before TNF-α stimulation. Scale bar, 20 μm. Right: numbers of p65 positive cells in the nucleus (s.e., over 100 cells from four different fields, *P<0.01 by t-test). (b,c) AQP3 −/− primary keratinocytes were incubated with TNF-α (100 ng ml −1) and/or H2O2 (300 μM). (b) Cellular H2O2 level (1 min, s.e., n = 7, *P<0.01 by t-test). (c) Representative immunoblot with phospho-IKKα/β, IKKβ, phospho-p65, p65 and β-actin stimulated for indicated times. (df) AQP3 −/− primary keratinocytes were transfected with mouse AQP3 cDNA or empty vector (pCMV6). (d) Left: mRNA analysed by quantitative RT–PCR. Right: immunoblotting with AQP3 antibody. (e) Cellular H2O2 after stimulation with TNF-α (100 ng ml−1) or H2O2 (100 μM; 1 min, s.e., n = 6, *P<0.05, **P<0.01 by t-test). (f) Immunoblot with phospho-IKKα/β or IKKβ stimulated with TNF-α (100 ng ml−1) for indicated times. Experiments in c and f were performed in two independent sets of experiments with similar results.
Figure 7
Figure 7. TNF-α-mediated H2O2 inactivates PP2A and regulates NF-κB activation
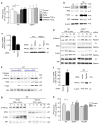
(a) PP2A activity in WT and AQP3−/− keratinocytes stimulated with TNF-α (100 ng ml −1) or H2O2 (300 μM) for 10 min. Some cells were incubated with catalase (2,000 U ml−1) for 30 min before stimulation. PP2A activity was calculated from the rate of dephosphorylation of a radioactive substrate per minute per microgram protein in the presence and absence of okadaic acid (OA, 10 μM), an inhibitor of PP2A (s.e., n =5, *P<0.01 by t-test). (b) WT keratinocytes were incubated with OA (10 μM, 30 min) and stimulated with TNF-α (100 ng ml−1, 15 min). Immunoblot with anti-phospho-IKKα/β, IKKβ, phospho-p65, p65 and β-actin. (ce) Ppp2ca knockdown in WT and AQP3 −/− keratinocytes by siRNA transfection. (c) PP2A expression by quantitative RT–PCR and immunoblotting (s.e., n =4, *P<0.01 by t-test). (d) Cells were stimulated with TNF-α (100 ng ml −1). Representative immunoblot with phospho-IKKα/β, IKKβ, phospho-p65 and p65. (e) WT cells with control- or Ppp2ca-siRNA transfection were incubated with catalase (2,000 U ml −1, 30 min) before TNF-α stimulation. (f,g) WT keratinocytes were transfected with empty vector (pCMV6) or plasmid-expressing mouse Ppp2ca. (f) PP2A overexpression was analysed by quantitative RT–PCR and immunoblotting (s.e., n =4, *P<0.01 by t-test). (g) Representative immunoblot of phospho-IKKα/β, IKKβ, phospho-p65 and p65 with TNF-α (100 ng ml −1) stimulation. (h) Mice were injected IL-23 into the ear as described in Fig. 1 and PP2A activity was measured in epidermal homogenates. Some WT mice were injected DPI (2 μg g −1 weight) intravenously 1 h before IL-23 injection (s.e., n =3–5, *P<0.01 by t-test). Experiments in d, e and g were performed in two additional sets of independent experiments with similar results.
Figure 8
Figure 8. TNF-α induced NF-κB activation depends on AQP3 in human primary keratinocytes
NHEK were transfected with AQP3 or non-targeting (Ct) siRNA. (a) Left: relative mRNA expression of AQP3/GAPDH (s.e., n =4, *P<0.01 by t-test). Right: immunoblot of membrane fraction with anti-AQP3 and anti-Na+/K +-ATPase. (b) Cellular H2O2 levels determined by CM-H2DCFDA after TNF-α (100 ng ml−1) or H2O2 (10 μM) stimulation (30 s, s.e., n = 5, *P<0.01 by t-test). (c) Immunoblot with phospho-IKKβ, IKKβ, phospho-p65 and p65 after TNF-α stimulation. (d) mRNA expression of IL-17C and IL-6 by real-time RT–PCR. Cells were incubated with TNF-α (50 ng ml −1) for 24 h. Data are expressed as the ratio to GAPDH (s.e., n =5, *P<0.05, **P<0.01 by t-test). (e) Ppp2ca knockdown in NHEK by siRNA transfection (s.e., n =4, *P<0.01 by t-test). (f) Immunoblot with phospho-p65 and p65 after TNF-α stimulation in AQP3 and/or Ppp2ca knockdown cells. Experiments in c and f were performed in two additional sets of independent experiments with similar results. (g) NHEK cell lysates were immunoprecipitated with anti-AQP3 or anti-Nox2 antibodies, showing interaction between AQP3 and Nox2.
Figure 9
Figure 9. Model of AQP3-mediated NF-κB activation
TNF-α binds to TNFR1 in keratinocytes and induces the production of H2O2 by Nox2. Extracellular H2O2 is rapidly transported intracellularly through AQP3. H2O2 modifies PP2A, regulating IKKβ and/or NF-κB/p65 activation.

Similar articles

Cited by

References

    1. Perera GK, Di Meglio P, Nestle FO. Psoriasis. Annu Rev Pathol. 2012;7:385–422. - PubMed
    1. Elder JT, et al. Molecular dissection of psoriasis: integrating genetics and biology. J Invest Dermatol. 2010;130:1213–1226. - PubMed
    1. Martin DA, et al. The emerging role of IL-17 in the pathogenesis of psoriasis: preclinical and clinical findings. J Invest Dermatol. 2013;133:17–26. - PMC - PubMed
    1. Capon F, Burden AD, Trembath RC, Barker JN. Psoriasis and other complex trait dermatoses: from Loci to functional pathways. J Invest Dermatol. 2012;132:915–922. - PMC - PubMed
    1. Oka A, Mabuchi T, Ozawa A, Inoko H. Current understanding of human genetics and genetic analysis of psoriasis. J Dermatol. 2012;39:231–241. - PubMed

Publication types

MeSH terms