. 2015 Jul;7(7):545-53.
doi: 10.1038/nchem.2266. Epub 2015 May 25.

Simulation-guided DNA probe design for consistently ultraspecific hybridization

Affiliations

Simulation-guided DNA probe design for consistently ultraspecific hybridization

Juexiao Sherry Wang et al. Nat Chem. 2015 Jul.

Abstract

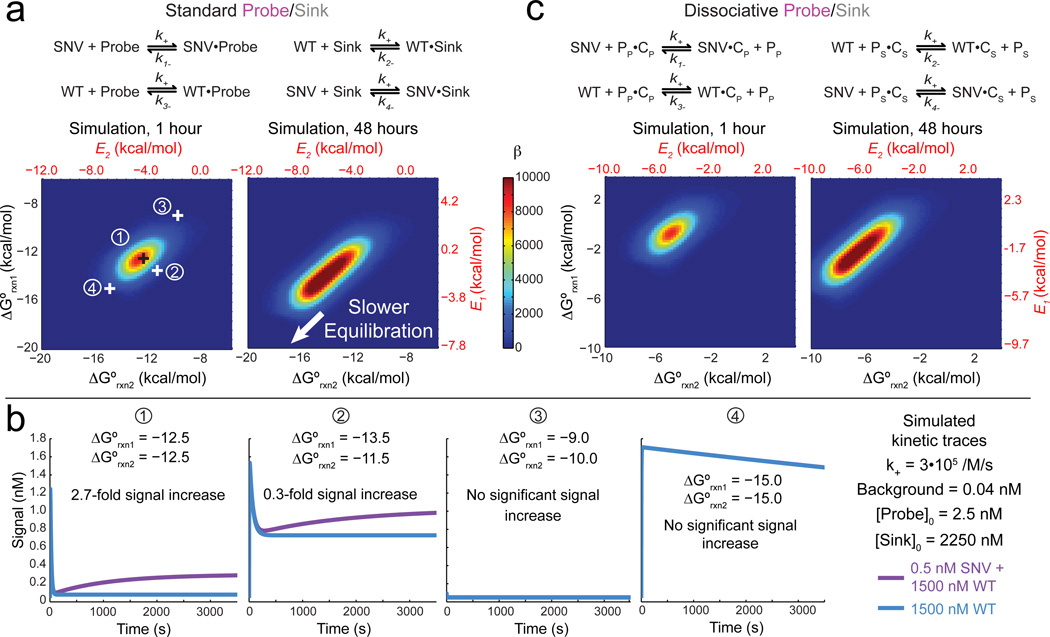
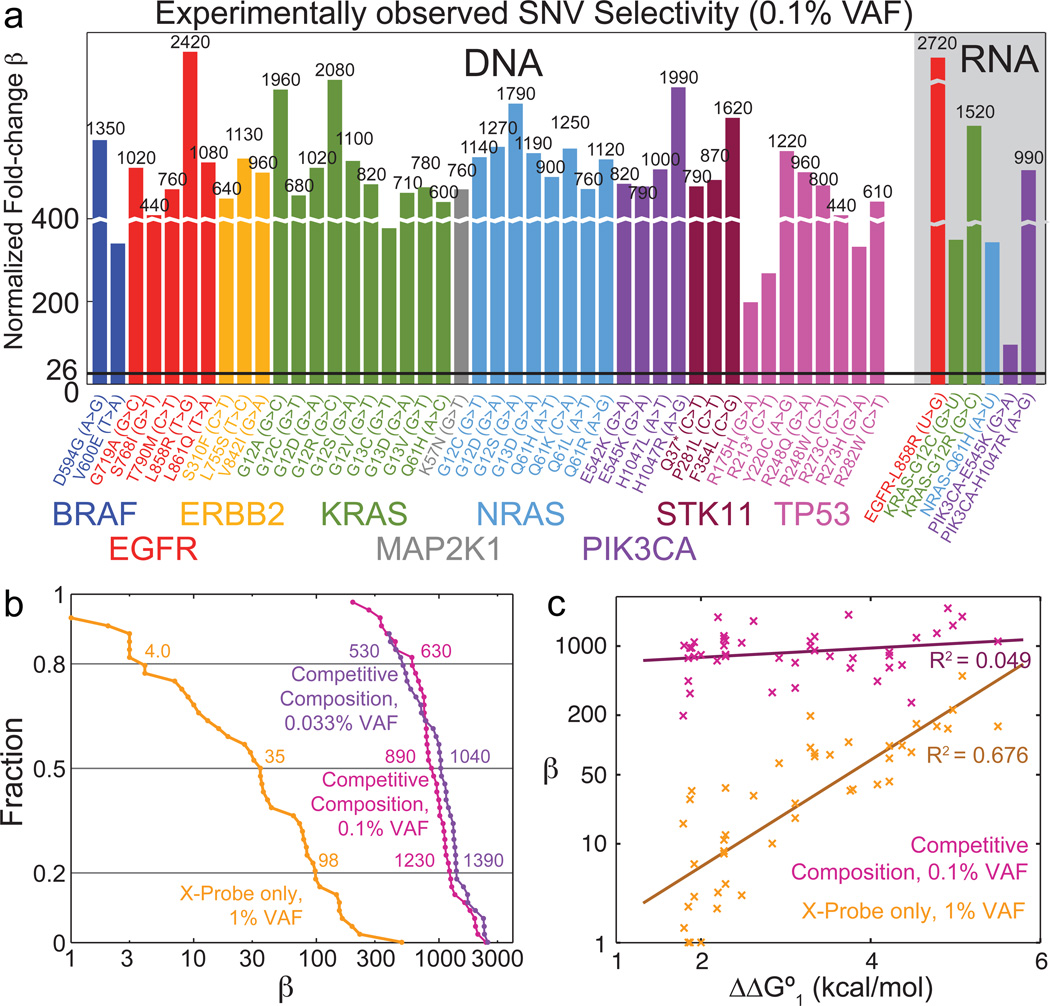
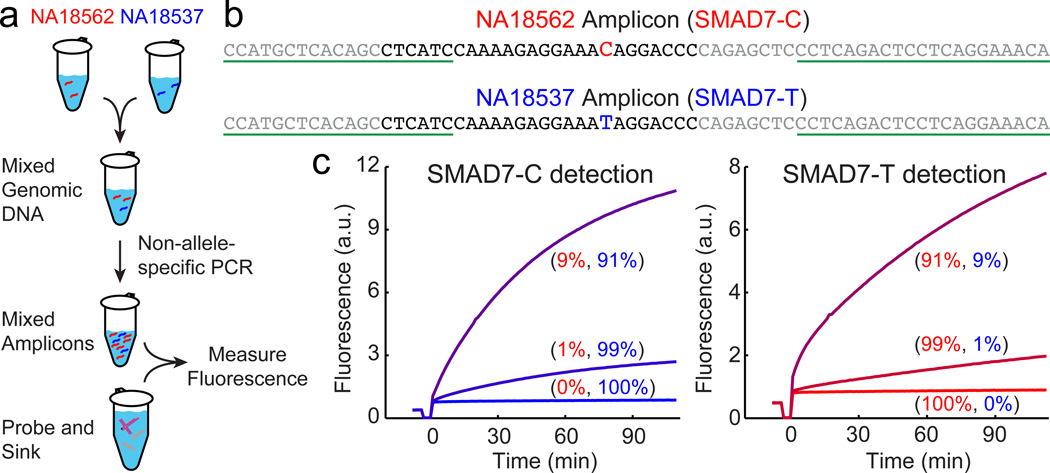
Hybridization of complementary sequences is one of the central tenets of nucleic acid chemistry; however, the unintended binding of closely related sequences limits the accuracy of hybridization-based approaches to analysing nucleic acids. Thermodynamics-guided probe design and empirical optimization of the reaction conditions have been used to enable the discrimination of single-nucleotide variants, but typically these approaches provide only an approximately 25-fold difference in binding affinity. Here we show that simulations of the binding kinetics are both necessary and sufficient to design nucleic acid probe systems with consistently high specificity as they enable the discovery of an optimal combination of thermodynamic parameters. Simulation-guided probe systems designed against 44 sequences of different target single-nucleotide variants showed between a 200- and 3,000-fold (median 890) higher binding affinity than their corresponding wild-type sequences. As a demonstration of the usefulness of this simulation-guided design approach, we developed probes that, in combination with PCR amplification, detect low concentrations of variant alleles (1%) in human genomic DNA.


Figures

Figure 1
Figure 1. Detection of rare nucleic acid variants by Competitive Compositions
(a) A Competitive Composition comprises a Target-specific Probe and a Wildtype-specific Sink molecule. Potential architectures of the Probe and Sink are shown in the exploded panel. The state energies of different products are shown; Single nucleotide variant (SNV) and Wildtype (WT) molecules bound to Probe produce detectable signal. (b) Energy level diagram of the Competitive Composition system describes the equilibrium distribution according to a statistical mechanics model. The occupancy of each state is determined by the state's energy E, which is in turn determined by the sequence design of the Probe and Sink, as well as the reaction conditions. (c) The specificity and sensitivity of the Competitive Composition depend on values of E1 and E2; shown are analytic results assuming ΔΔG°1 = 3 kcal/mol and ΔΔG°2 = 4 kcal/mol at 37 °C. Discrimination factor is the fold-change difference in yield of the SNV and the WT in binding to the Probe. Qualitatively similar results are observed for other values of ΔΔG°. (d) The normalized fold-change β metric expresses a combination of system specificity and sensitivity. When [SNV]0 = 0.5 nM, [WT]0 = 1500 nM, and Background = 0.04 nM, there is a ray-shaped parameter space that yields optimal β at equilibrium.
Figure 2
Figure 2. Kinetic simulations of Competitive Compositions
(a) Reactions and simulations of standard (non-dissociative) Probe and Sink architectures. At t = 1 hr, there is a single optimal combination of ΔG°rxn1 and ΔG°rxn2 that yield highest β; corresponding E values are plotted in red. At t = 48 hr, the parameter space yielding high β broadens slightly; the lower left corner (highly negative ΔG°rxn1 and ΔG°rxn2) is slow to achieve equilibrium. Four representative combinations of ΔG°rxn1 and ΔG°rxn2 are shown; 1 represents the optimal combination, 2 represents a suboptimal combination with significantly lower selectivity, 3 represents a grossly incorrect combination, and 4 represents a combination that would have produced high selectivity after significantly longer reaction time. (b) Example simulation traces for different combinations of ΔG°rxn1 and ΔG°rxn2. (c) Reaction schemes and simulations for dissociative Probe and Sink architectures that release an auxiliary protector species P upon binding. PP refers to protector for the Probe, and PS refers to the protector for the Sink; PP•CP refers to the dissociative probe and PS•CS refers to the dissociative sink. Optimal parameter values are shifted relative to dissociative Probes, but there is likewise a single optimal combination of ΔG°rxn1 and ΔG°rxn2 that yield highest β at t = 1 hr.
Figure 3
Figure 3. The X-Probe is a dissociative probe that conditionally fluoresces upon hybridization to its DNA target
Its construction utilizes universal functionalized strands F and Q; only the regions in green and red are target-specific. (a) Sequences of the X-probe targeting the EGFR-L858R (c.2573T>G) mutation; ROX denotes carboxy-X-rhodamine, and RQ denotes the Iowa Black Red Quencher. The polymorphic nucleotide (shown in red) can also exist in the double-stranded specific region for some probe designs (Section S3). (b) Experimental time-based fluorescence response of 10 nM X-Probe to 20 nM Target (red) and to 20 nM WT (light green); triplicate experimental traces are displayed. All triplicate experiments, including X-Probe to 5 other target sequences, show less than 5% variability (Section S5). All experiments were performed at 37 °C in 5× PBS buffer. (c) Fluorescence response of 10 nM X-Probe to 500 nM WT (100% variant allele frequency (VAF), dark green) and to 500 nM WT plus 5 nM Target (1% VAF, yellow). Triplicate experimental traces are displayed. Normalized fold-change β is calculated from the VAF, the background fluorescence fB, control fluorescence due to the WT fC, and the additional fluorescence due to the SNV fA.
Figure 4
Figure 4. Design workflow and experimental demonstration of Competitive Composition
(a) Competitive Composition design workflow. (b) ΔΔG° (kcal/mol) of the two mismatch bubbles at 37 °C, in 1M Na+. (c) The Competitive Composition here consists of a target-specific X-Probe and a WT-specific Sink, with near-optimal ΔG°rxn values (kcal/mol). (d) Sink architecture and sequence; the sequences of the X-Probe, Target, and WT are the same as in Fig. 3a. (e) Experimental time-based fluorescence response of Competitive Composition to different variant allele frequencies (VAF) of the target. β is higher for experiments at lower VAF due to the relatively smaller contribution of background fluorescence fB.
Figure 5
Figure 5. Summary of Competitive Composition experimental results on synthetic targets
(a) Experimentally observed normalized fold-change β for Competitive Compositions designed to 44 SNV cancer mutation sequences across 9 genes [36], and their corresponding WT sequences. The black horizontal line shows β = 26, the previous best median β demonstrated [20]. (b) Distribution of β for X-Probes only and Competitive Compositions. Also shown is Competitive Composition results with 0.033% VAF (Section S10). The 60% confidence interval for X-Probes' β is roughly 4 to 100, and for Competitive Compositions' is roughly 600 to 1300. (c) Scatter plot and linear fits of β versus literature-reported ΔΔG°1 for X-Probe only and for Competitive Compositions. Competitive Compositions consistently result in high β regardless of mismatch identities.
Figure 6
Figure 6. Competitive Composition assays on PCR amplicons of human genomic DNA samples
(a) Experimental workflow. Two extracted DNA samples from Coriell Cell Repository (NA18537 and NA18546) bearing single nucleotide polymorphisms at the SMAD7 locus are mixed at 100:0, 99:1, 90:10, 10:90, 1:99, and 0:100 ratios to total concentrations of 2ng/µL (50 µL), and amplified by asymmetric non-allele-specific PCR to generate single-stranded amplicon. Competitive Compositions are designed to each allele; the rarer allele is assayed with the appropriate design. (b) Sequences of the SMAD7 amplicons. The Probe- and Sink-binding regions are shown in black; the forward PCR primer sequence and reverse PCR primer binding sites are underlined. (c) Fluorescence responses of Competitive Composition to each SNP. In each experiment, 0.5 nM Probe and 10 nM Sink were reacted with 40 µL PCR product. Allele frequencies of SMAD7-C and SMAD7-T in genomic DNA mixture prior to PCR are displayed in parentheses.

Similar articles

Cited by

References

    1. Kim S, Misra A. SNP genotyping: technologies and biomedical applications. Annu. Rev. Biomed. Eng. 2007;9:289–320. - PubMed
    1. Schwarzenbach H, Hoon DSB, Pantel K. Cell-free nucleic acids as biomarkers in cancer patients. Nature Reviews Cancer. 2011;11:426–437. - PubMed
    1. Diehl F, et al. Detection and quantification of mutations in the plasma of patients with colorectal tumors. Proc. Natl. Acad. Sci. 2005;102:16368–16373. - PMC - PubMed
    1. Vogelstein B, et al. Cancer Genome Landscapes. Science. 2013;339:1546–1558. - PMC - PubMed
    1. Schmitt M. et al Detection of ultra-rare mutations by next-generation sequencing. Proc. Natl. Acad. Sci. 2012;109:14508–14513. - PMC - PubMed

Publication types