. 2015 Sep;75(1):117-26.
doi: 10.1016/j.cyto.2014.12.007. Epub 2015 Jun 20.

Diallyl disulfide inhibits TNFα induced CCL2 release through MAPK/ERK and NF-Kappa-B signaling

Affiliations

Diallyl disulfide inhibits TNFα induced CCL2 release through MAPK/ERK and NF-Kappa-B signaling

D Bauer et al. Cytokine. 2015 Sep.

Abstract

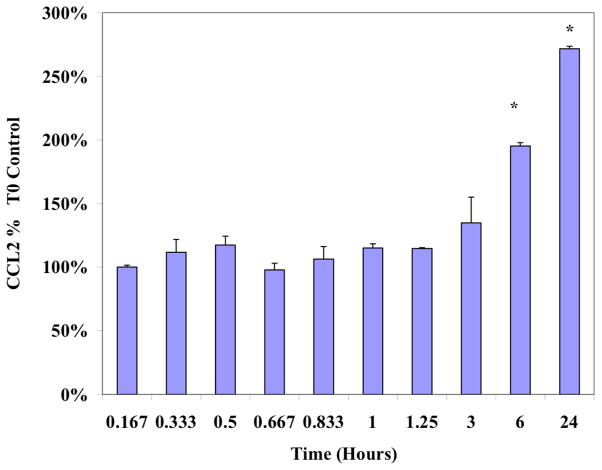
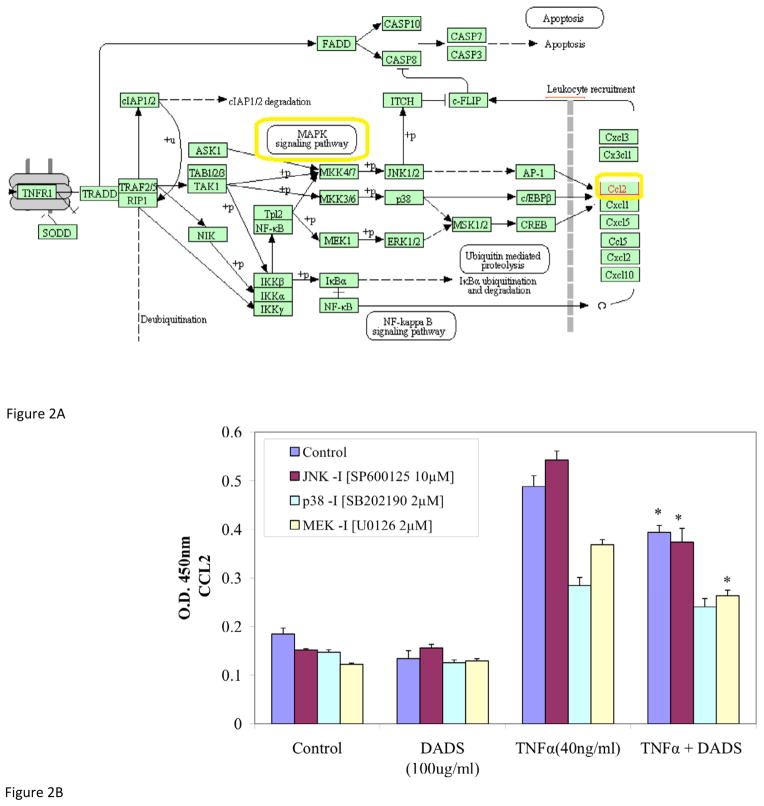
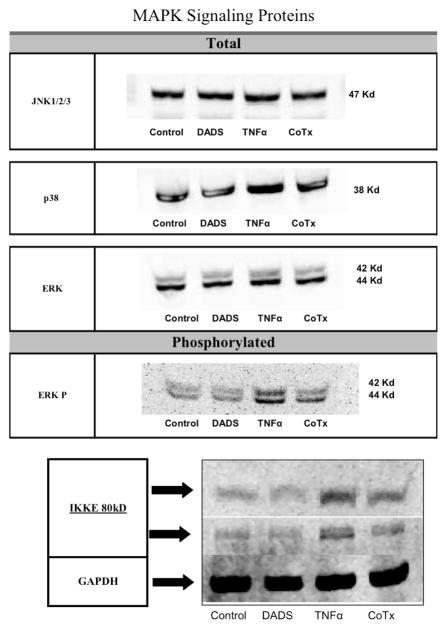
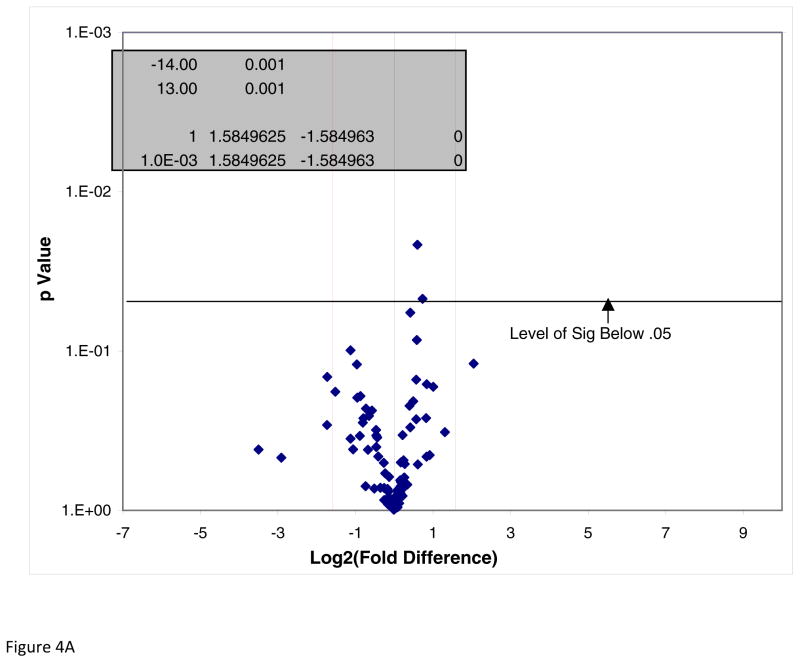
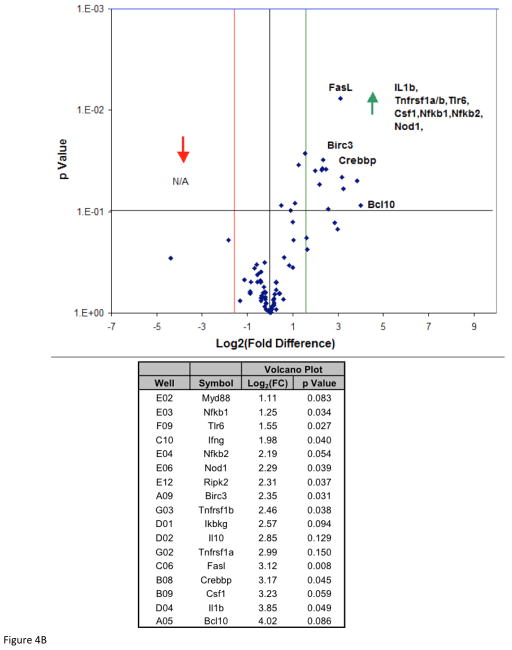
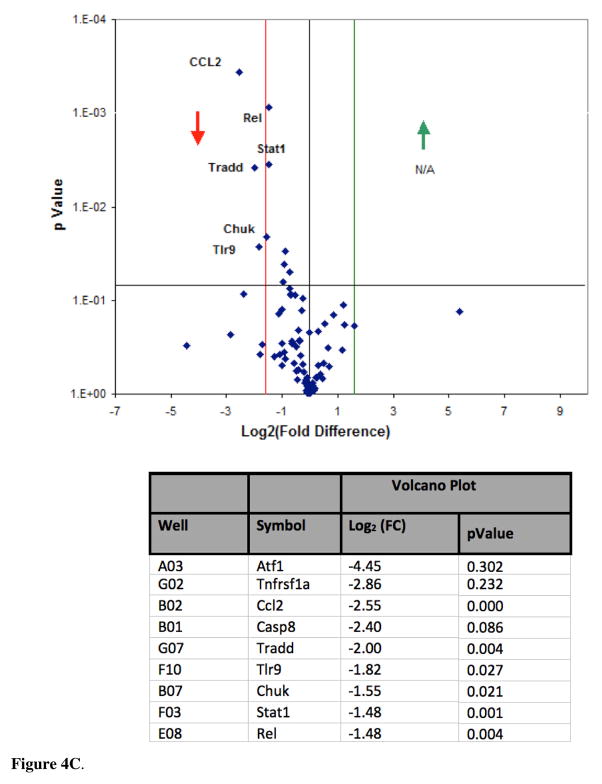
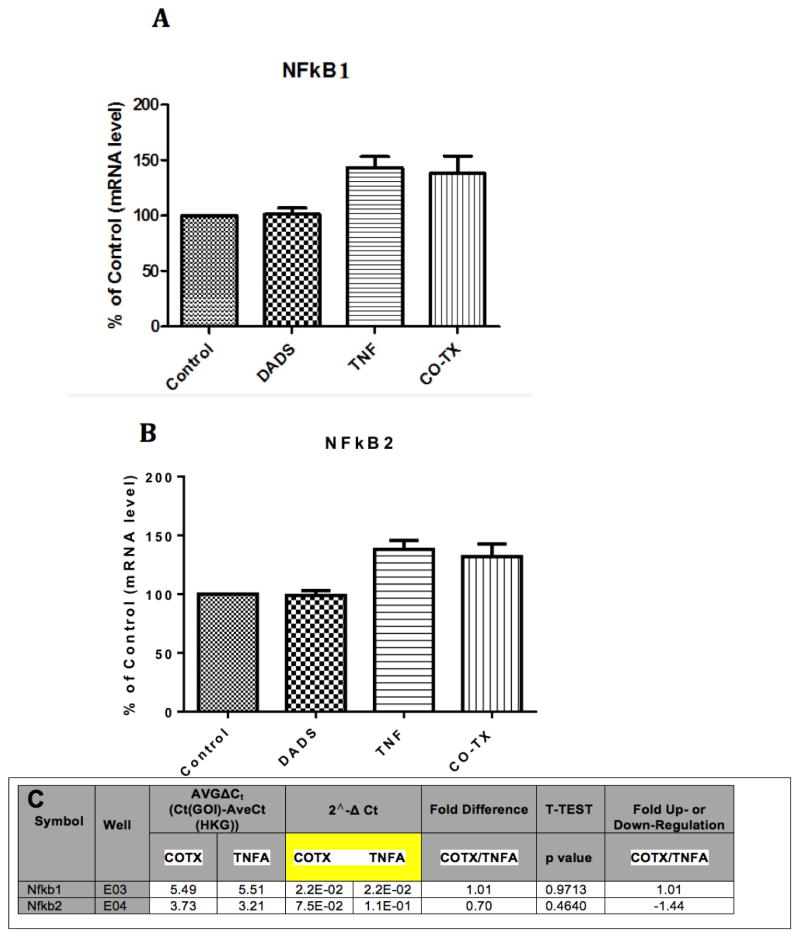
TNFα receptors are constitutively overexpressed in tumor cells, correlating to sustain elevated NFκB and monocyte chemotactic protein-1 (MCP-1/CCL2) expression. The elevation of CCL2 evokes aggressive forms of malignant tumors marked by tumor associated macrophage (TAM) recruitment, cell proliferation, invasion and angiogenesis. Previously, we have shown that the organo-sulfur compound diallyl disulfide (DADS) found in garlic (Allium sativum) attenuates TNFα induced CCL2 production in MDA-MB-231 cells. In the current study, we explored the signaling pathways responsible for DADS suppressive effect on TNFα mediated CCL2 release using PCR Arrays, RT-PCR and western blots. The data in this study show that TNFα initiates a rise in NFκB mRNA, which is not reversed by DADS. However, TNFα induced heightened expression of IKKε and phosphorylated ERK. The expression of these proteins corresponds to increased CCL2 release that can be attenuated by DADS. CCL2 induction by TNFα was also lessened by inhibitors of p38 (SB202190) and MEK (U0126) but not JNK (SP 600125), all of which were suppressed by DADS. In conclusion, the obtained results indicate that DADS down regulates TNFα invoked CCL2 production primarily through reduction of IKKε and phosphorylated-ERK, thereby impairing MAPK/ERK, and NFκB pathway signaling. Future research will be required to evaluate the effects of DADS on the function and expression of TNFα surface receptors.

Keywords: Diallyl disulfide; Map kinase b; Monocyte chemoattractant protein 1; Nuclear factor kappa b; Tumor necrosis factor alpha.


Figures

Figure 1
Figure 1. Time course of the TNFα-dependent accumulation of CCL2 in MDA-MB-231 cells
MDA-MB-231 cells were exposed to sublethal levels of TNFα (40ng/ml) and CCL2 release was monitored as described in Materials and Methods. The data is presented as % Ctrl at Timezero, displayed as the Mean ± S.E.M., n=4. Differences from Control were determined using a determined by a one-way ANOVA, with a Tukey post hoc test. *p<0.05.
Figure 2
Figure 2
Figure 2A. Kegg Diagram interconnecting MAPK signaling with CCL2 release. CCL2 release is initiated by TNFα acting on TNFR1 and contributes to leukocyte recruitment. The factors analyzed in this study are highlighted. Figure 2B. Effect of DADS and MAPK signaling inhibitors on CCL2 release in MDA-MB-231 cells. Additive or synergistic effects of MAPK inhibitors on DADS-treated (100μM), TNFα-treated (40ng/ml) and co-treated MDA-MB-231 cells after 24 hrs. The data are presented as CCL2 release (OD 450nm) and represent the Mean ± S.E.M. n=4. Significance of differences from the control in both groups was determined by T-test. *p<0.05.
Figure 3
Figure 3. Evaluation total or phosphorylated proteins involved with NFκB Signaling Pathway
DADS-treated (100μM), TNFα-treated (40ng/ml) and co-treated MDA-MB-231 cell lysates were evaluated for the protein levels of JNK1/2/3, p38, ERK and IKKε. Phosphorylation status of ERK was also determined as described in the Materials and methods.
Figure 4
Figure 4
Figure 4A. NFκB Signaling Pathway RT2 Profiler PCR Array of DADS vs Control. Effect of DADS vs control in MDA-MB-231 cells, displayed on a volcano plot showing significance, fold change and direction. There were no significant differences found between these groups at p<0.05. Figure 4B. NFκB Signaling Pathway RT2 Profiler PCR Array of TNFα vs control. Analysis of TNFα vs control displayed on a volcano plot showing significance, fold change and direction. Transcriptome upward directional shifts (A), with significance and Log2 (Fold Change) listed along official gene symbols (B). Figure 4C. NFκB Signaling Pathway RT2 Profiler PCR Array of TNFα vs TNFα/DADS. Effect of TNFα vs TNFα/DADS on gene expression: displayed on a volcano plot showing significance, fold change and direction. There were significant differences found between these groups using the PCR Array PAMM – 025Z in the downward direction (A), with significance and Log2 (Fold Change) listed along official gene symbols (B).
Figure 4
Figure 4
Figure 4A. NFκB Signaling Pathway RT2 Profiler PCR Array of DADS vs Control. Effect of DADS vs control in MDA-MB-231 cells, displayed on a volcano plot showing significance, fold change and direction. There were no significant differences found between these groups at p<0.05. Figure 4B. NFκB Signaling Pathway RT2 Profiler PCR Array of TNFα vs control. Analysis of TNFα vs control displayed on a volcano plot showing significance, fold change and direction. Transcriptome upward directional shifts (A), with significance and Log2 (Fold Change) listed along official gene symbols (B). Figure 4C. NFκB Signaling Pathway RT2 Profiler PCR Array of TNFα vs TNFα/DADS. Effect of TNFα vs TNFα/DADS on gene expression: displayed on a volcano plot showing significance, fold change and direction. There were significant differences found between these groups using the PCR Array PAMM – 025Z in the downward direction (A), with significance and Log2 (Fold Change) listed along official gene symbols (B).
Figure 5
Figure 5. Effect of DADs on TNFα NF-Kappa B expression pattern using RT-PCR
The data represent the Mean ± S.E.M. n=3. There were no statistical differences found between the Control and TNFα controls ± DADS for NF-Kappa B1 (A) or NF-KappaB2 (B), also corroborating PCR expression arrays for both subtypes (C).

Similar articles

Cited by

References

    1. Zlotnik A. Chemokines in neoplastic progression. Seminars in cancer biology. 2004;14:181–5. - PubMed
    1. Tanaka T, Bai Z, Srinoulprasert Y, Yang BG, Hayasaka H, Miyasaka M. Chemokines in tumor progression and metastasis. Cancer science. 2005;96:317–22. - PMC - PubMed
    1. Rossi D, Zlotnik A. The biology of chemokines and their receptors. Annual review of immunology. 2000;18:217–42. - PubMed
    1. Jaattela M. Biologic activities and mechanisms of action of tumor necrosis factor-alpha/cachectin. Laboratory investigation; a journal of technical methods and pathology. 1991;64:724–42. - PubMed
    1. Balkwill F. TNF-alpha in promotion and progression of cancer. Cancer metastasis reviews. 2006;25:409–16. - PubMed

Publication types

MeSH terms