Osmotic stress induces phosphorylation of histone H3 at threonine 3 in pericentromeric regions of Arabidopsis thaliana
- PMID: 26100864
- PMCID: PMC4500206
- DOI: 10.1073/pnas.1423325112
Osmotic stress induces phosphorylation of histone H3 at threonine 3 in pericentromeric regions of Arabidopsis thaliana
Abstract
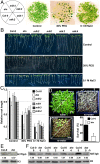
Histone phosphorylation plays key roles in stress-induced transcriptional reprogramming in metazoans but its function(s) in land plants has remained relatively unexplored. Here we report that an Arabidopsis mutant defective in At3g03940 and At5g18190, encoding closely related Ser/Thr protein kinases, shows pleiotropic phenotypes including dwarfism and hypersensitivity to osmotic/salt stress. The double mutant has reduced global levels of phosphorylated histone H3 threonine 3 (H3T3ph), which are not enhanced, unlike the response in the wild type, by drought-like treatments. Genome-wide analyses revealed increased H3T3ph, slight enhancement in trimethylated histone H3 lysine 4 (H3K4me3), and a modest decrease in histone H3 occupancy in pericentromeric/knob regions of wild-type plants under osmotic stress. However, despite these changes in heterochromatin, transposons and repeats remained transcriptionally repressed. In contrast, this reorganization of heterochromatin was mostly absent in the double mutant, which exhibited lower H3T3ph levels in pericentromeric regions even under normal environmental conditions. Interestingly, within actively transcribed protein-coding genes, H3T3ph density was minimal in 5' genic regions, coincidental with a peak of H3K4me3 accumulation. This pattern was not affected in the double mutant, implying the existence of additional H3T3 protein kinases in Arabidopsis. Our results suggest that At3g03940 and At5g18190 are involved in the phosphorylation of H3T3 in pericentromeric/knob regions and that this repressive epigenetic mark may be important for maintaining proper heterochromatic organization and, possibly, chromosome function(s).
Keywords: abiotic stress; epigenetics; heterochromatin; histone phosphorylation; protein kinase.
Conflict of interest statement
The authors declare no conflict of interest.
Figures


Similar articles
-
Alterations of lysine modifications on the histone H3 N-tail under drought stress conditions in Arabidopsis thaliana.Plant Cell Physiol. 2008 Oct;49(10):1580-8. doi: 10.1093/pcp/pcn133. Epub 2008 Sep 8. Plant Cell Physiol. 2008. PMID: 18779215
-
AtHaspin phosphorylates histone H3 at threonine 3 during mitosis and contributes to embryonic patterning in Arabidopsis.Plant J. 2011 Nov;68(3):443-54. doi: 10.1111/j.1365-313X.2011.04699.x. Epub 2011 Aug 30. Plant J. 2011. PMID: 21749502
-
Dependence of heterochromatic histone H3 methylation patterns on the Arabidopsis gene DDM1.Science. 2002 Sep 13;297(5588):1871-3. doi: 10.1126/science.1074950. Epub 2002 Jun 20. Science. 2002. PMID: 12077425
-
Heterochromatin proteins and the control of heterochromatic gene silencing in Arabidopsis.J Plant Physiol. 2006 Feb;163(3):358-68. doi: 10.1016/j.jplph.2005.10.015. Epub 2005 Dec 27. J Plant Physiol. 2006. PMID: 16384625 Review.
-
Switching between Epigenetic States at Pericentromeric Heterochromatin.Trends Genet. 2015 Nov;31(11):661-672. doi: 10.1016/j.tig.2015.09.003. Epub 2015 Sep 29. Trends Genet. 2015. PMID: 26431676 Review.
Cited by
-
Post-Translational Modifications in Histones and Their Role in Abiotic Stress Tolerance in Plants.Proteomes. 2023 Nov 22;11(4):38. doi: 10.3390/proteomes11040038. Proteomes. 2023. PMID: 38133152 Free PMC article. Review.
-
Role of Epigenetics in Modulating Phenotypic Plasticity against Abiotic Stresses in Plants.Int J Genomics. 2022 Jun 14;2022:1092894. doi: 10.1155/2022/1092894. eCollection 2022. Int J Genomics. 2022. PMID: 35747076 Free PMC article. Review.
-
Cross-species complementation reveals conserved functions for EARLY FLOWERING 3 between monocots and dicots.Plant Direct. 2017 Oct 16;1(4):e00018. doi: 10.1002/pld3.18. eCollection 2017 Oct. Plant Direct. 2017. PMID: 31245666 Free PMC article.
-
Haspin balances the ratio of asymmetric cell division through Wnt5a and regulates cell fate decisions in mouse embryonic stem cells.Cell Death Discov. 2023 Aug 23;9(1):307. doi: 10.1038/s41420-023-01604-w. Cell Death Discov. 2023. PMID: 37612272 Free PMC article.
-
Signaling coupled epigenomic regulation of gene expression.Oncogene. 2017 Oct 26;36(43):5917-5926. doi: 10.1038/onc.2017.201. Epub 2017 Jun 26. Oncogene. 2017. PMID: 28650470 Review.
References
-
- Mirouze M, Paszkowski J. Epigenetic contribution to stress adaptation in plants. Curr Opin Plant Biol. 2011;14(3):267–274. - PubMed
Publication types
MeSH terms
Substances
LinkOut - more resources
Full Text Sources
Other Literature Sources
Molecular Biology Databases

