. 2015 Jul 7;112(27):8457-62.
doi: 10.1073/pnas.1500438112. Epub 2015 Jun 22.

Theta-gamma coordination between anterior cingulate and prefrontal cortex indexes correct attention shifts

Affiliations

Theta-gamma coordination between anterior cingulate and prefrontal cortex indexes correct attention shifts

Benjamin Voloh et al. Proc Natl Acad Sci U S A. .

Abstract

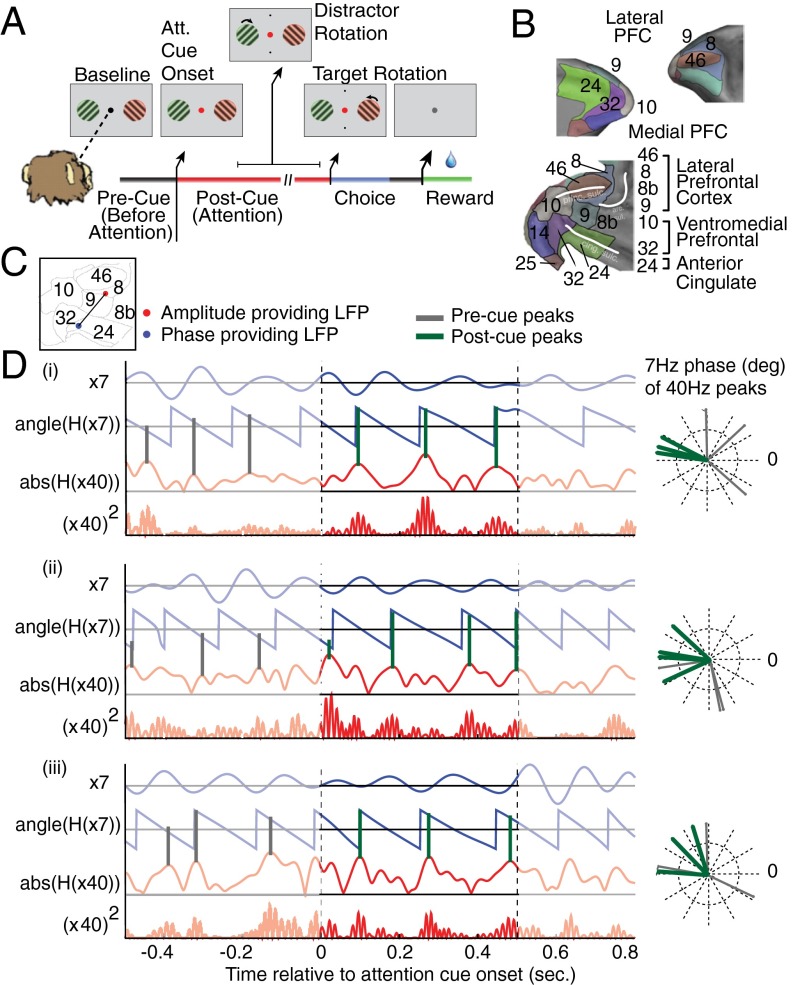
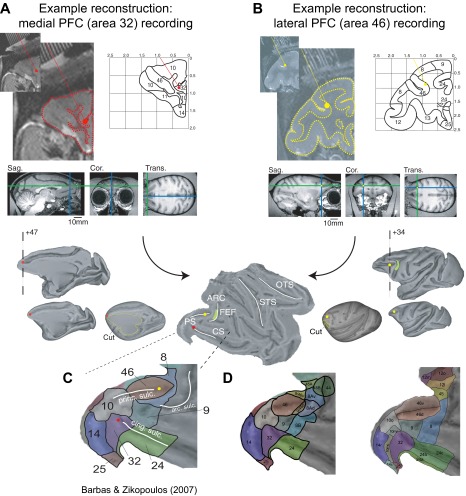
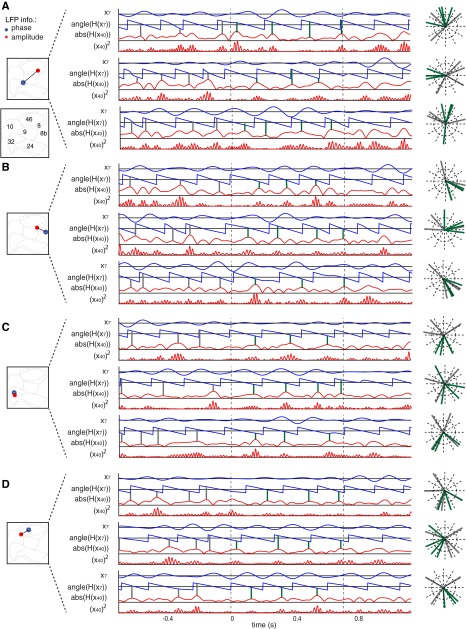
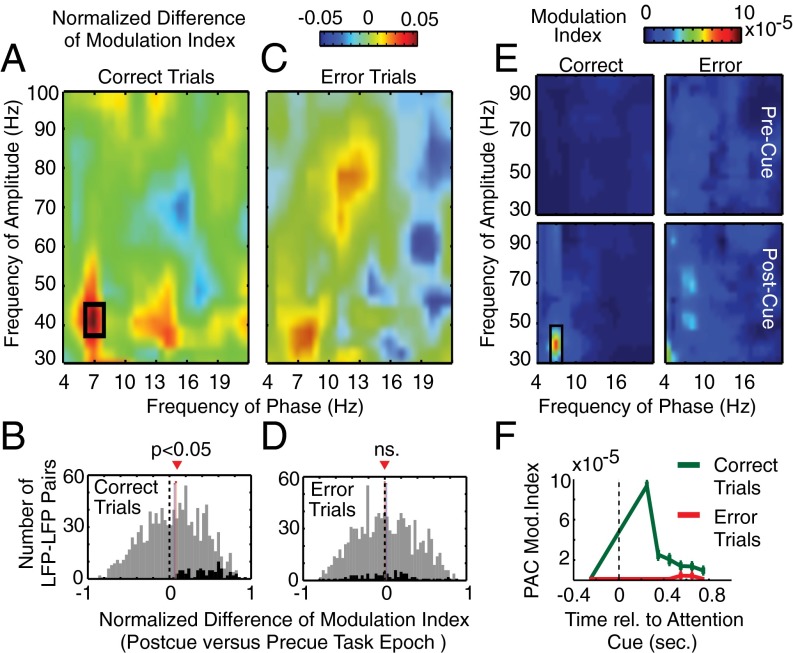
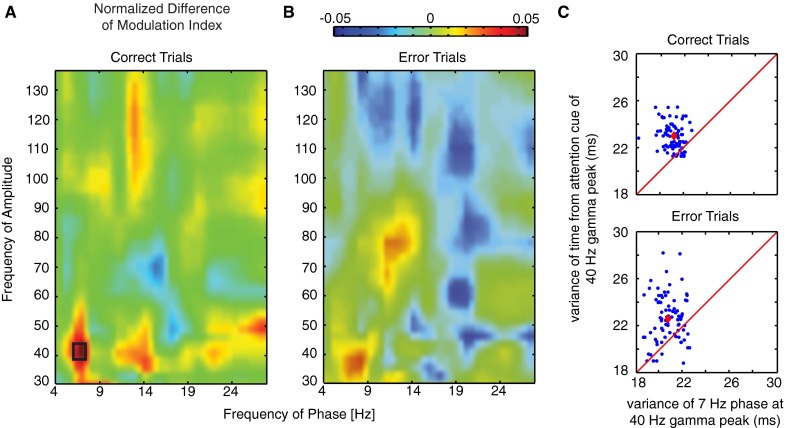
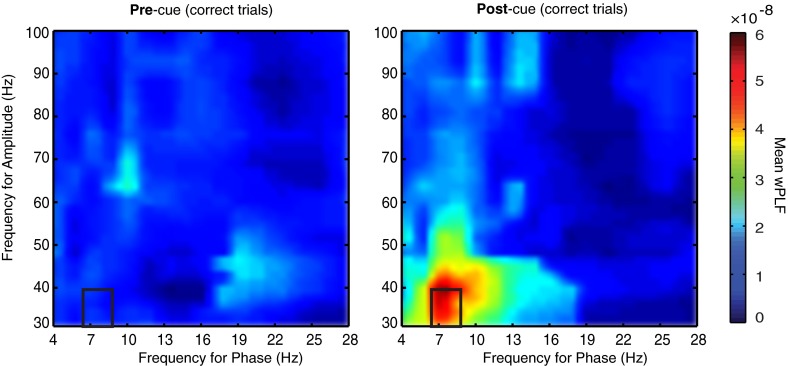
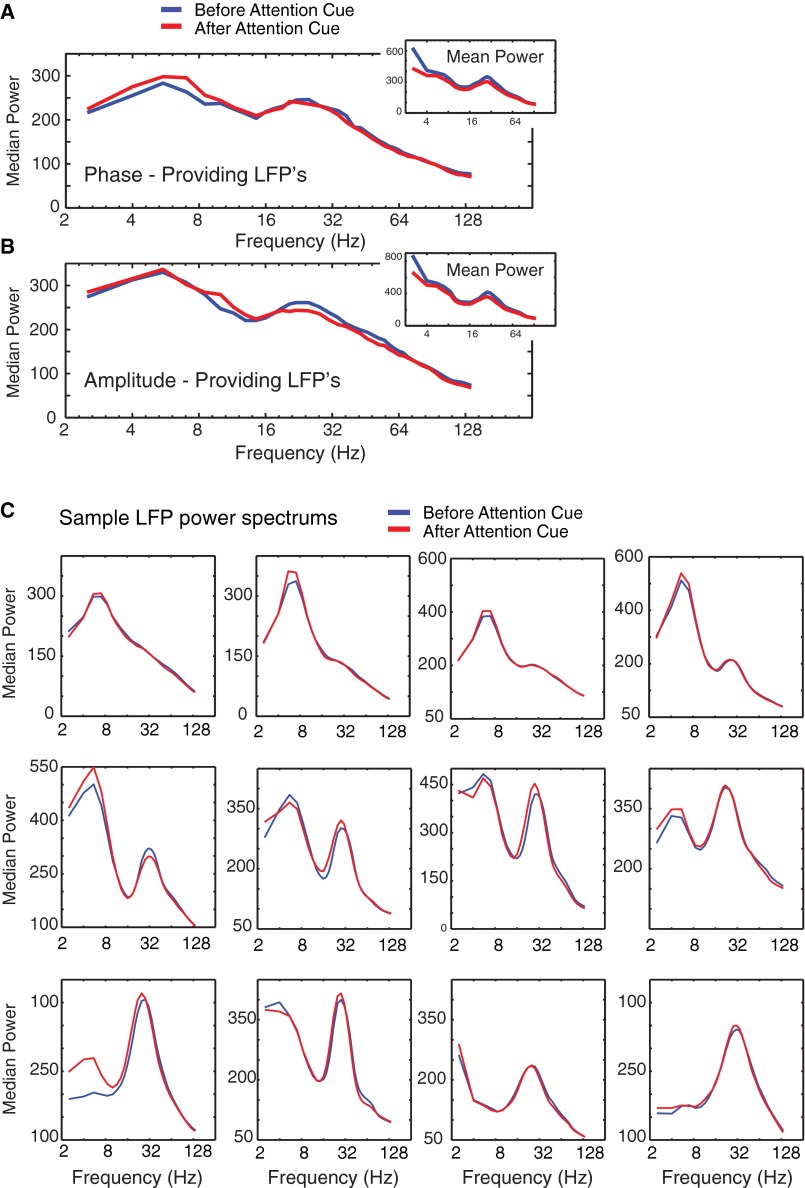
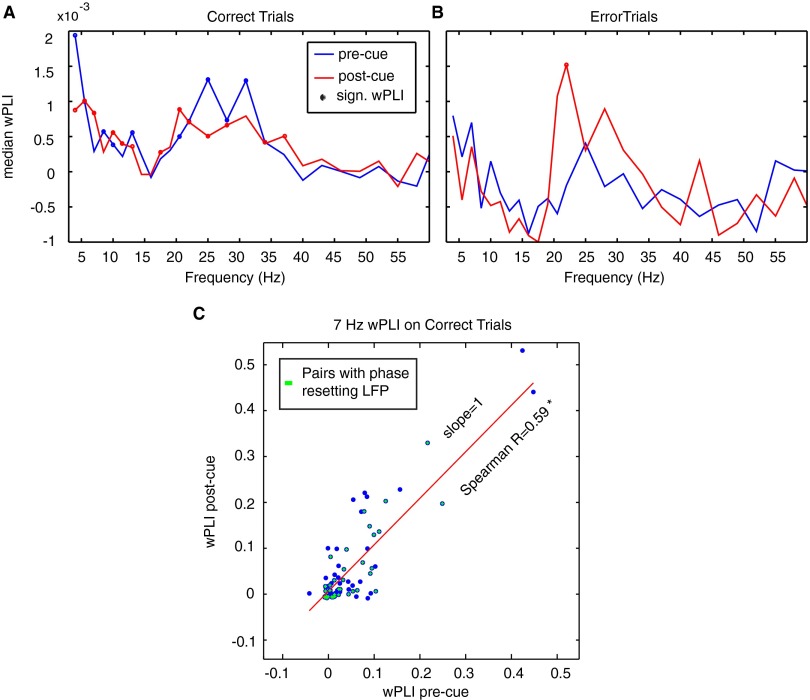
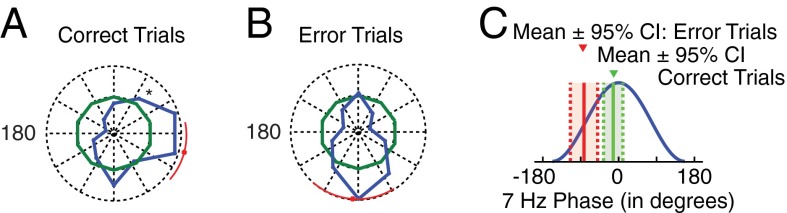
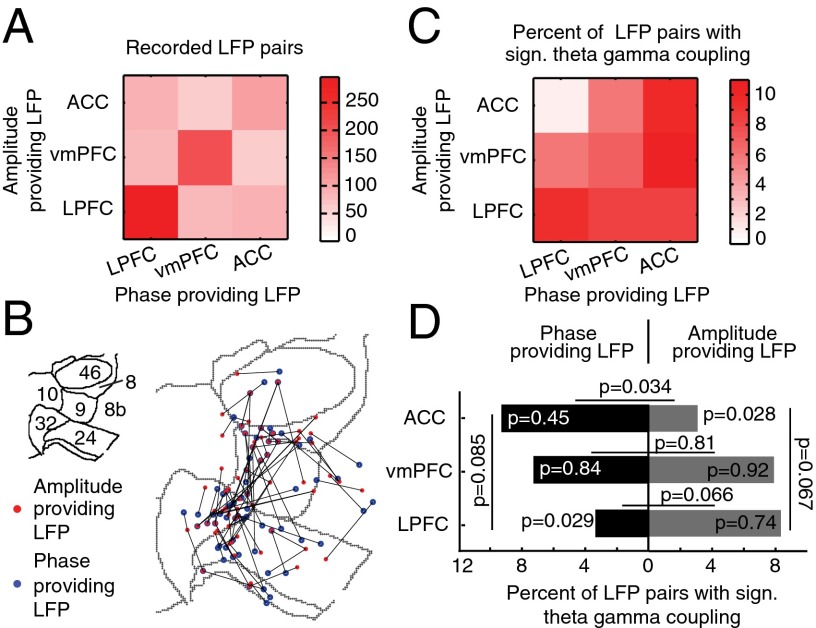
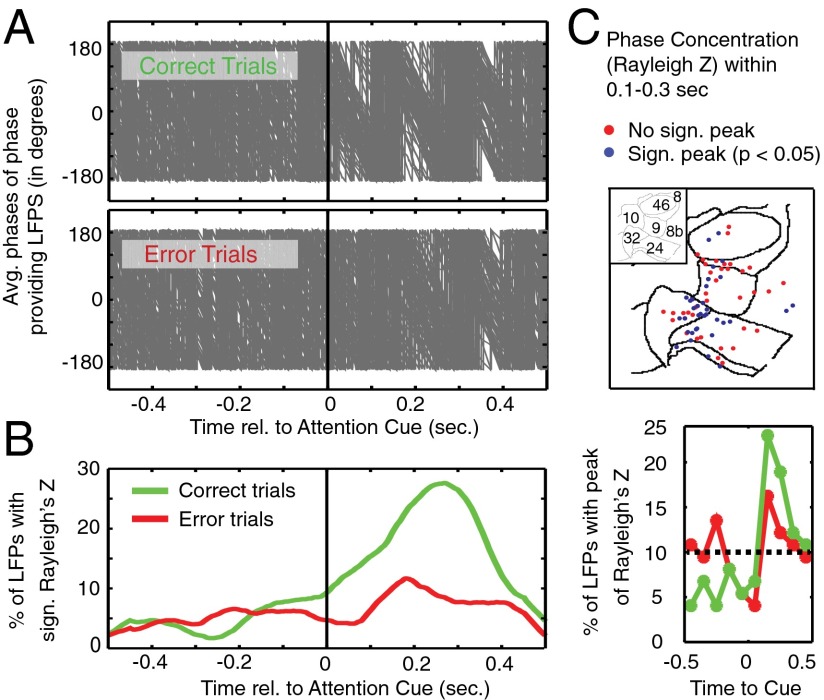
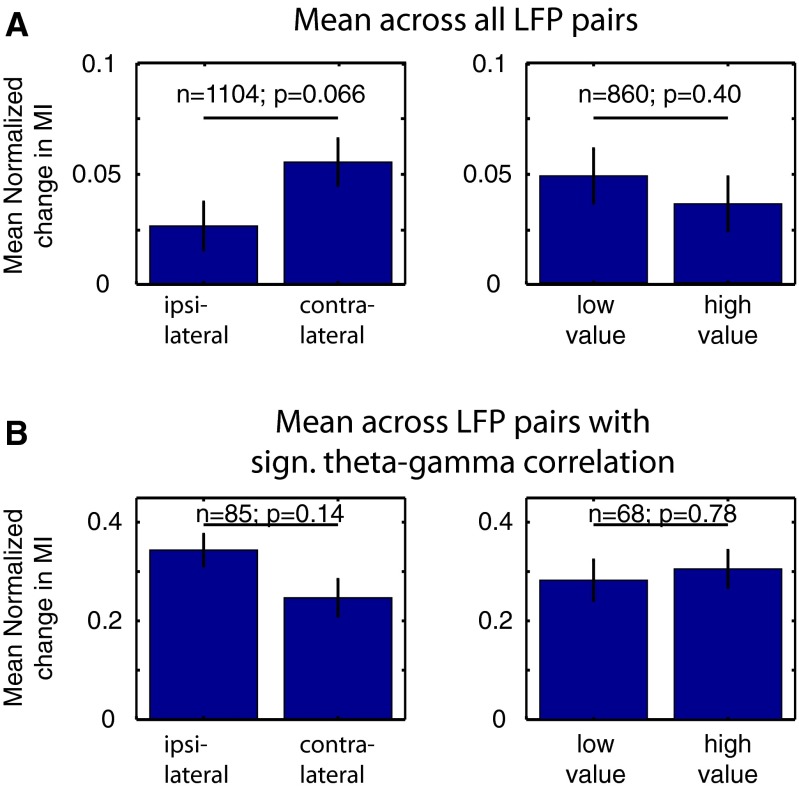
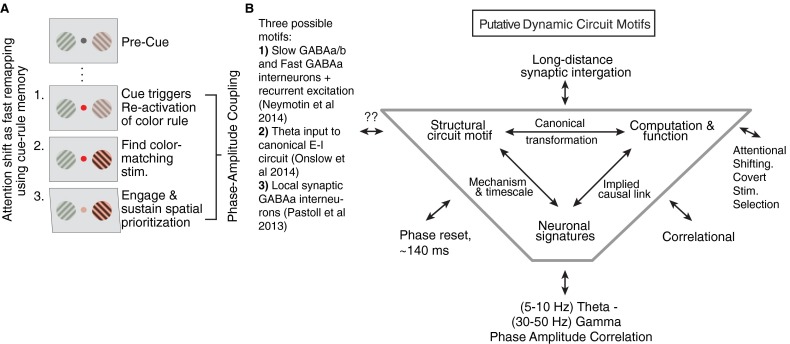
Anterior cingulate and lateral prefrontal cortex (ACC/PFC) are believed to coordinate activity to flexibly prioritize the processing of goal-relevant over irrelevant information. This between-area coordination may be realized by common low-frequency excitability changes synchronizing segregated high-frequency activations. We tested this coordination hypothesis by recording in macaque ACC/PFC during the covert utilization of attention cues. We found robust increases of 5-10 Hz (theta) to 35-55 Hz (gamma) phase-amplitude correlation between ACC and PFC during successful attention shifts but not before errors. Cortical sites providing theta phases (i) showed a prominent cue-induced phase reset, (ii) were more likely in ACC than PFC, and (iii) hosted neurons with burst firing events that synchronized to distant gamma activity. These findings suggest that interareal theta-gamma correlations could follow mechanistically from a cue-triggered reactivation of rule memory that synchronizes theta across ACC/PFC.

Keywords: anterior cingulate cortex; attention; gamma oscillation; prefrontal cortex; theta oscillation.


Conflict of interest statement

The authors declare no conflict of interest.

Figures

Fig. 1.
Fig. 1.
Task and illustration of example theta–gamma correlation. (A) The selective attention task required monkeys to keep fixation on a central cue throughout a trial, while presented with two peripheral grating stimuli. First, both grating stimuli changed their color simultaneously to either green or red, the location of which was random. Then, the fixation point changed its color to match the stimulus to which the monkey has to covertly shift attention. The attended stimulus rotated transiently at unpredictable times, requiring the monkey to judge a clockwise/counterclockwise rotation to receive fluid reward. Rotations of the nonattended stimulus had to be ignored (filtered). (B) Lateral and medial prefrontal cortex of macaques rendered in 3D (upper panels) and represented as 2D flat map (bottom panel) with a standard labeling of cortical fields (for details, see Fig. S1). Adapted from ref. . (C) Anatomical locations on the 2D flat map of an example LFP pair in which the LFP theta phase of one recording site in the ACC (blue dot) correlated with the low-gamma amplitude of a second LFP recording site in LPFC area 8 (red dot). (D) Filtered phase and amplitude traces for the example LFP–LFP pair that is shown in C for three trials (i–iii). For each trial, the bandpass-filtered low-frequency activation and its phase evolution are shown with blue lines, and the amplitude envelope and the squared gamma amplitude of the amplitude-providing LFP recording are shown in red. Gray (green) vertical lines highlight the phases at which the gamma-amplitude variations show peaks within the 500 ms before (after) attention cue onset. The polar plot on the Right shows these peak phases in the precue and postcue epoch. For this ACC–LPFC example pair, the gamma-amplitude peaks of the PFC channel correlate with similar theta phases of the ACC channel in the postcue period. For more examples, see Fig. S2.
Fig. S1.
Fig. S1.
Illustration of the reconstruction of recording sites. (A and B) Reconstruction of a medial PFC (area 32; A), and a LPFC (area 46; B) recording site started from the 7-T anatomical MR, which was obtained with (iodine-based) visualization of electrode trajectories within the electrode grid placed inside the recording chamber. The outline of the cortical folding was sketched on the coronal MR slice to ease identification of areas and landmarks according to standard brain atlases, and to place the depth of the electrode tip (red dot in A and yellow dot in B) with custom MATLAB code. The electrode tip position was then placed into a standardized macaque brain available in the MR Caret software package. Caret allowed rendering the MR slice into a 3D volume and to inflate the volume before the spherically inflated brain was cut (indicated as yellow line) to represent it as 2D flat map. White lines on the flat map demarcate the principal sulcus (PS), the arcuate sulcus (ARC), and the cingulate sulcus (CS). The location of the frontal eye field (FEF) within the ARC is indicated by a green patch. (C) As a last step, the anatomical subdivision of areas in the prefrontal-cingulate cortex were visualized following the nomenclature from Barbas and Zikopoulus (46). The area 32 and area 46 recording sites are visualized throughout the panels by a red and a yellow dot, respectively. (D) Similar format to C, but using major anatomical reference schema as indicated in ref. . Adapted from ref. .
Fig. S2.
Fig. S2.
Example LFP–LFP pairs showing theta–gamma correlation in the postcue period. (A–D) Example LFP–LFP pairs shown in same format as Fig. 1D in the main text. Filtered phases and amplitude traces for the example LFP–LFP pairs that are shown in Insets of the 2D ACC/PFC representation. For each of three trials (i–iii) the bandpass-filtered low-frequency activation and its phase evolution are shown with blue lines, and the amplitude envelope and the squared gamma amplitude of the amplitude-providing LFP recording are shown in red. Gray (green) vertical lines highlight the phases at which the gamma-amplitude variations show peaks within the 500 ms before (after) attention cue onset. The polar plot on the Right shows these peak phases in the precue and postcue period. For all example LFP–LFP pairs, the gamma-amplitude peaks in the 0.5-s time after cue onset couple to similar theta phases of the phase channels in the postcue period across trials.
Fig. 2.
Fig. 2.
Theta–gamma correlation is significantly enhanced after attention cue onset on correct trials. (A) Comodulograms of the normalized difference in the phase (x axis)-to-amplitude (y axis) correlation (measured as MI) in the postcue relative to the precue task epoch on correct trials (n = 1,104). Positive values indicate increases of P–A correlation after attention cue onset. The black rectangle denotes significant (P < 0.05) comodulation difference. (B) Histogram of the difference in theta–gamma P–A correlation MI in the postcue relative to precue task epoch across all LFP–LFP pairs on correct trials (n = 1,104). Black bars in both panels highlight those LFP pairs that exhibited an individually significant P–A correlation increase with attention on correct trials (n = 85). Red and blue vertical bars denote mean and median of the distribution, and the dotted line highlights the difference in MI of zero. (C and D) Same format as A and B but for error trials. Note that, in D, the black bars in the histogram show the theta–gamma MI values for the same LFP pairs highlighted in B. (E) Comodulograms showing the average P–A MI on correct trials (left column) and error trials (right column), and in the precue task epoch (upper row) and the postcue epoch (bottom row) (n = 85). Shown are the average MIs of those LFP–LFP pairs with significantly increased theta-to-gamma P–A correlation (the black-colored bars in B). (F) Temporal evolution of theta–gamma P–A correlation for those LFP pairs with a significant P–A correlation effect on correct trials (n = 85) during correct (green) and error (red) trials at different 500-ms time windows relative to the attention cue onset (x axis).
Fig. S3.
Fig. S3.
Theta–gamma correlation is significantly enhanced after attention cue onset on correct trials in a narrow theta–gamma coupling range. (A and B) Same format as Fig. 2 A and B in the main text. Comodulograms of the normalized difference in the phase (x axis)-to-amplitude (y axis) correlation (measured as MI) in the postcue relative to the precue task epoch (n = 1,104). Positive values indicate increases of P–A correlation after attention cue onset. The left and right panels shows PAC difference for correct and error trials, respectively. The black rectangle denotes significant (P < 0.05, FDR corrected) comodulation difference. (C) Scatter plot of the variance of the time from attention cue onset (y axis) and circular variance of the phase (x axis) relative to the maximum peak of the gamma envelope (n = 85). The red line denotes where variances are equal, and the red dot is defined by the average variance.
Fig. S4.
Fig. S4.
Theta–gamma correlation indexed with Maris’ weighted phase-locking factor. Comodulograms of average wPLF in the precue (Left) and postcue (Right) for the LFP–LFP pairs (n = 85) that showed a significant increase (P < 0.05) in coupling on correct trials. The black rectangle denotes frequency pairs that show a significant normalized difference in coupling at the population level.
Fig. S5.
Fig. S5.
Average power spectral densities for phase- and amplitude-providing LFP recordings. (A) Median power spectral density (y axis) for unique LFP recordings (n = 74) that provided the low-frequency phase information to the LFP–LFP pairs that showed significant theta–gamma P–A correlation in the post-attention cue epoch but not in the pre-attention cue epoch. Line colors denote the median power in 0.5-s time windows immediately before the attention cue (blue) and immediately after the attention cue onset (red). The Inset shows the mean power spectral density instead of the median. (B) Same format as A but in unique LFP recordings that provided the amplitude information (n = 67) to the theta–gamma P–A correlation. (C) Average power spectral densities (y axis) for 12 example LFPs that engaged in significant cross-frequency P–A correlation in the 500 ms after the onset of the attention cue (red), but not before the attention cue onset (blue). Power spectra were arranged so that LFPs with a stronger theta power component are shown earlier, and LFPs with relatively stronger beta LFP peak are shown later in the sequence. The examples illustrate the range of LFP power spectral densities evident in the PFC/ACC, and they show that there were no apparent LFP power modulations between the precue and postcue attention epoch.
Fig. S6.
Fig. S6.
Phase synchronization in the P–A correlation network during attention switching. (A and B) Average phase synchronization (measured as wPLI) across LFP pairs (n = 85) that showed a reliable increase in phase–amplitude theta–gamma correlation, for correct (A) and error (B) trials. There was no significant change in phase synchronization between the precue and postcue epochs (SI Result S7). The dots mark frequencies where the average wPLI was significantly higher than zero (Wilcoxon sign rank). (C) Spearman rank correlation and linear regression (red line) of the wPLI in the precue and postcue epoch. Spearman R was significant (P < 0.05). Green crosses highlight those P–A correlation LFP pairs where the theta-providing LFP showed a significant phase reset 100–300 ms after attention cue onset. Phase-resetting channels are broadly distributed even among weakly P–A correlated LFP pairs.
Fig. 3.
Fig. 3.
Preferred theta phase of theta–gamma correlation on correct and error trials. (A) Polar histogram of the amplitude-weighted mean preferred phases in the postcue period at which gamma activity phase locked in those LFP pairs with significant theta–gamma coupling in the postcue period (n = 85). Colors denote the distributions expected by chance (green) and from the post-attention cue epoch (blue) on correct trials. The outer dotted ring corresponds to a proportion of 20%. The red dot and line denote circular mean and 95% confidence range. (B) Same as in A, but for error trials. (C) Illustration of the mean and 95% confidence range of the preferred theta phases on correct (green) and error trials (red) at which gamma amplitudes couple for the LFP pairs that showed a significant increase in theta–gamma P–A correlation after attention cue onset.
Fig. 4.
Fig. 4.
Anatomical origins of cortical sites with phase and amplitude modulation during theta–gamma P–A correlation. (A) Combination matrix showing the total number of LFP–LFP pairs (n = 1,104) recorded from the ventromedial PFC (vmPFC) (areas 32 and 10), the anterior cingulate cortex (ACC) (area 24), and the LPFCs (areas 46, 8, and 9). The brain area of the phase-providing channels is on the x axis, and the origin of the amplitude-providing LFP channels is on the y axis. (B) Anatomical recording location of phase (blue)- and amplitude (red)-providing LFPs (n = 85 LFP pairs; connected with black lines) and plotted on the 2D flat-map representation of the ACC and PFC. Gray contours denote area boundaries (see Inset for area labels; Fig. 1B). (C) Same as in A, but for the proportion of theta–gamma P-A–correlated LFP pairs (n = 85) relative to all LFP pairs recorded for an area combination. Color indexes the proportion. (D) Likelihood to find a phase-providing channel (values Left from zero) and an amplitude-providing channel (Right from zero) in the vmPFC, ACC, and LPFC during cross-area theta–gamma correlation (n = 32; y axis).
Fig. 5.
Fig. 5.
Phase-providing LFPs engaging in significant theta–gamma phase–amplitude correlation show a theta-phase reset after attention cue onset on correct trials. (A) Progression of the average phase (y axis) for all phase-providing LFP channels (n = 74) engaging in significant theta–gamma correlation around the time of the attention cue onset (x axis). Each gray line represents the average phase across trials of one such LFP. Top and bottom panels show the progression of mean phases on correct trials and on error trials, respectively. (B) The left panel shows the percentage of phase-providing channels with significant phase concentration (y axis, measured as Rayleigh’s Z) around the time of the attention cue onset (x axis). Green and red lines show the average Rayleigh’s Z across LFP channels for correct and for error trials, respectively. The panel on the Right shows the percentage of LFPs whose peak phase concentration fell within 1 of 10 nonoverlapping time bins (around attention cue onset). (C) The anatomical distribution of recorded LFPs that showed a significant phase concentration (blue) or that did not show significant phase concentration (red) in the 0.1–0.3 s following attention cue onset. See Fig. 1B for the labeling of PFC/ACC brain areas on the 2D flat-map representation (and Figs. 1 and 2).
Fig. S7.
Fig. S7.
Representation of spatial information and information about target-associated reward outcome in theta–gamma P–A correlation. (A) The average change in theta–gamma correlation across all LFP pairs for different spatial and reward outcome conditions (n = 1,104 for spatial conditions; n = 860 for value conditions), represented as the mean and SE. There is a higher increase in correlation on contralateral vs. ipsilateral trials (Left), but no difference between attention to lower vs. higher rewarded targets (Right). (B) Same as in A, but only for LFP pairs where theta–gamma correlation showed reliable increase in the postcue period on correct trials (n = 85 for spatial conditions; n = 68 for value conditions). Insignificant theta–gamma correlation was masked to zero. There is no difference between contralateral and ipsilateral trials, or between high- and low-value target trials.
Fig. S8.
Fig. S8.
Cue-triggered attention shifts during memory reactivation and remapping and hypothetical dynamic circuit motifs of theta–gamma P–A correlation. (A) Illustration of three separable component processes underlying the cue-triggered (covert) attention shift. The panel shows the succession from precue (top panel) to postcue period (bottom three panels). The panels show that attention shifting proceeds from (i) the reactivation of a color rule, (ii) applying the rule by finding the color matching peripheral stimulus and filtering out nonmatching stimuli, and (iii) engaging and sustaining stimulus selection. (B) The framework of the tripartite dynamic circuit motifs helps understand how an activation signature (theta–gamma P–A correlation) links to a function (attentional shifting and stimulus selection). Completion of a dynamic motif would require identification of the structural (cellular and synaptic) origin of the activation state. (For details, see ref. .) The shown putative motif makes it explicit that the link of theta–gamma P–A correlation and attentional prioritization is correlational. Moreover, we can only speculate which synaptic or cellular mechanisms implement theta–gamma P–A correlation, but outline three generic cortical circuits that are powerful candidates.

Similar articles

Cited by

References

    1. Miller EK, Buschman TJ. Cortical circuits for the control of attention. Curr Opin Neurobiol. 2013;23(2):216–222. - PMC - PubMed
    1. Shenhav A, Botvinick MM, Cohen JD. The expected value of control: An integrative theory of anterior cingulate cortex function. Neuron. 2013;79(2):217–240. - PMC - PubMed
    1. Kaping D, Vinck M, Hutchison RM, Everling S, Womelsdorf T. Specific contributions of ventromedial, anterior cingulate, and lateral prefrontal cortex for attentional selection and stimulus valuation. PLoS Biol. 2011;9(12):e1001224. - PMC - PubMed
    1. Rushworth MF, Noonan MP, Boorman ED, Walton ME, Behrens TE. Frontal cortex and reward-guided learning and decision-making. Neuron. 2011;70(6):1054–1069. - PubMed
    1. Gläscher J, et al. Lesion mapping of cognitive control and value-based decision making in the prefrontal cortex. Proc Natl Acad Sci USA. 2012;109(36):14681–14686. - PMC - PubMed

Publication types