. 2015 Jul 7;112(27):E3600-8.
doi: 10.1073/pnas.1508838112. Epub 2015 Jun 22.

N-linked glycosylation of protease-activated receptor-1 at extracellular loop 2 regulates G-protein signaling bias

Affiliations

N-linked glycosylation of protease-activated receptor-1 at extracellular loop 2 regulates G-protein signaling bias

Antonio G Soto et al. Proc Natl Acad Sci U S A. .

Abstract

Protease-activated receptor-1 (PAR1) is a G-protein-coupled receptor (GPCR) for the coagulant protease thrombin. Similar to other GPCRs, PAR1 is promiscuous and couples to multiple heterotrimeric G-protein subtypes in the same cell and promotes diverse cellular responses. The molecular mechanism by which activation of a given GPCR with the same ligand permits coupling to multiple G-protein subtypes is unclear. Here, we report that N-linked glycosylation of PAR1 at extracellular loop 2 (ECL2) controls G12/13 versus Gq coupling specificity in response to thrombin stimulation. A PAR1 mutant deficient in glycosylation at ECL2 was more effective at stimulating Gq-mediated phosphoinositide signaling compared with glycosylated wildtype receptor. In contrast, wildtype PAR1 displayed a greater efficacy at G12/13-dependent RhoA activation compared with mutant receptor lacking glycosylation at ECL2. Endogenous PAR1 rendered deficient in glycosylation using tunicamycin, a glycoprotein synthesis inhibitor, also exhibited increased PI signaling and diminished RhoA activation opposite to native receptor. Remarkably, PAR1 wildtype and glycosylation-deficient mutant were equally effective at coupling to Gi and β-arrestin-1. Consistent with preferential G12/13 coupling, thrombin-stimulated PAR1 wildtype strongly induced RhoA-mediated stress fiber formation compared with mutant receptor. In striking contrast, glycosylation-deficient PAR1 was more effective at increasing cellular proliferation, associated with Gq signaling, than wildtype receptor. These studies suggest that N-linked glycosylation at ECL2 contributes to the stabilization of an active PAR1 state that preferentially couples to G12/13 versus Gq and defines a previously unidentified function for N-linked glycosylation of GPCRs in regulating G-protein signaling bias.

Keywords: GPCR; RhoA; arrestin; endothelial; thrombin.


Conflict of interest statement

The authors declare no conflict of interest.

Figures

Fig. 1.
Fig. 1.
PAR1 NA ECL2 mutant exhibits enhanced Gαq-mediated PI hydrolysis. (A) FLAG–PAR1 WT or FLAG–NA ECL2 mutant HeLa cells transfected with nonspecific (ns) or Gαq siRNA labeled with myo-[3H]inositol were stimulated with 10 nM α-Th. Data (mean ± SD; n = 3) are from three independent experiments and were significant (***P < 0.001). (B) PAR1 surface expression (mean ± SD; n = 3) was determined by ELISA. Control (Ctrl) is secondary antibody only. (Inset) Immunoblots of cell lysates. (C) FLAG–PAR1 WT or FLAG–NA ECL2 mutant HeLa cells transiently transfected with HA–Gαq were lysed, immunoprecipitated, and immunoblotted as indicated. Data (mean ± SD; n = 3) are from three independent experiments and were significant (**P < 0.01). (D) FLAG–PAR1 WT or FLAG–NA ECL2 mutant HeLa cells transfected with HA–Gαq or untransfected (UT) cells were treated with 10 nM α-Th, lysed, immunoprecipitated, and immunoblotted as indicated. Data (mean ± SEM; n = 4) are from four independent experiments and were significant (*P < 0.01).
Fig. S1.
Fig. S1.
PAR1 deficient in N-linked glycosylation at ECL2 exhibits enhanced Gαq association and PI hydrolysis in COS-7 cells but similar distribution in sucrose gradient fractionation. (A) COS-7 cells transiently transfected with PBJ vector, FLAG–PAR1 WT, or NA ECL2 mutant were labeled with myo-[3H]inositol and treated with or without 10 nM α-Th for 30 min. The data shown (mean ± SD; n = 3) are representative of three independent experiments performed in triplicate and were significant (**P < 0.01). (B) PAR1 cell surface expression (mean ± SD; n = 3) was determined by ELISA. (C) COS-7 cells transiently coexpressing FLAG–PAR1 WT or NA ECL2 mutant with HA-tagged Gαq were lysed, immunoprecipitated, and immunoblotted as indicated. The data shown (mean ± SD; n = 3) are from three independent experiments and were significant (*P < 0.05). (D) FLAG–PAR1 WT or NA ECL2 mutant HeLa cells were lysed, and caveolin-1-enriched fractions were isolated by detergent-free sucrose gradient centrifugation. Aliquots representing each of the 12 fractions were immunoblotted as indicated.
Fig. 2.
Fig. 2.
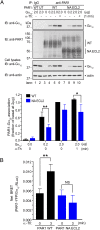
PAR1 WT and NA ECL2 differentially activate RhoA. FLAG–PAR1 WT and NA ECL2 mutant HeLa cells displaying similar cell surface expression (WT, 0.363 ± 0.079; NA ECL2, 0.363 ± 0.049, OD units) were treated with 10 nM α-Th (A) or 100 μM SFLLRN (B), lysed, and processed for GST-RBD pull-down assays, and activated RhoA was detected by immunoblotting. UT cells were processed similarly. The data (mean ± SD; n = 3) were normalized to total RhoA, are representative of three independent experiments, and were significant (*P < 0.05; ***P < 0.001). NS, not significant.
Fig. S2.
Fig. S2.
Thrombin-induced RhoA activation in PAR1 WT and NA ECL2 mutant expressing HeLa and COS-7 cells. (A) FLAG–PAR1 WT or NA ECL2 mutant HeLa cells expressing similar amounts of cell surface expression (WT = 0.881 ± 0.016 and NA ECL2 = 0.818 ± 0.019, OD units) were treated with 10 nM α-Th, lysed and processed for GST-RBD pull-down assays, and activated RhoA was detected by immunoblotting. The data shown (mean ± SD; n = 3) were normalized to total RhoA and were significant (*P < 0.05; ***P < 0.001). (B) COS-7 cells transiently expressing similar cell surface levels of FLAG–PAR1 WT and NA ECL2 mutant (WT = 0.210 ± 0.016 and NA ECL2 = 0.196 ± 0.020, OD units) were treated with 10 nM α-Th, and RhoA activation was measured as described in A. Data (mean ± SD; n = 3) were normalized to total RhoA and were significant at 2.5 min (**P < 0.01). NS, not significant.
Fig. 3.
Fig. 3.
Thrombin-induced RhoA activation requires Gα12 and Gα13 expression. FLAG–PAR1 WT (A) or NA ECL2 mutant (B) HeLa cells transfected with siRNAs were treated with 10 nM α-Th and processed for GST-RBD pull-down assays, and RhoA activation was determined. Cell lysates were immunoblotted as indicated. Data (mean ± SD; n = 3) are from three independent experiments and were significant (***P < 0.001).
Fig. 4.
Fig. 4.
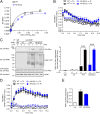
PAR1 WT and NA ECL2 differentially associate with Gα12. (A) FLAG–PAR1 WT or NA ECL2 HeLa cells transfected with Gα12–EE were treated with 10 nM α-Th, immunoprecipitated, and immunoblotted. Data (mean ± SD; n = 3) are from three independent experiments and were significant (*P < 0.05; **P < 0.01). (B) COS-7 cells cotransfected with PAR1 WT–YFP or NA ECL2–YFP and Gα12–Rluc were treated with 10 nM α-Th, and BRET was determined. Data shown (mean ± SD; n = 3) from three independent experiments were significant (**P < 0.01). NS, not significant.
Fig. S3.
Fig. S3.
PAR1 WT and NA ECL2 mutant differentially associate with Gα13. FLAG–PAR1 WT or NA ECL2 mutant HeLa cells transiently transfected with Gα13–EE were treated with or without 10 nM α-Th, lysed, PAR1 immunoprecipitated, and immunoblotted as indicated. The data shown (mean ± SD; n = 3) are representative of three independent experiments and were significant (*P < 0.05; **P < 0.01).
Fig. S4.
Fig. S4.
PAR1 WT–YFP and NA ECL2–YFP and Gα12–Rluc luminescence and fluorescence values. Total luminescence (Left) and fluorescence (Right) expressed as arbitrary units (A.U.) detected in PAR1 WT–YFP or NA ECL2–YFP coexpressed with Gα12–Rluc or pcDNA vector transfected COS-7 cells. The data shown (mean ± SD; n = 3) are representative of three independent experiments.
Fig. 5.
Fig. 5.
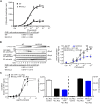
PAR1 WT and NA ECL2 are equally effective at coupling to Gi and β-arrestin-1. (A) COS-7 cells coexpressing increasing PAR1 WT–YFP or NA ECL2–YFP with a constant amount of Gαi–Rluc were analyzed by BRET. Data are representative of three independent experiments. (B) COS-7 cells coexpressing PAR1 WT–YFP or NA ECL2–YFP and Gαi–Rluc were treated with 10 nM α-Th, and BRET was determined. Data (mean ± SD; n = 3) are representative of three independent experiments. (C) COS-7 cells coexpressing PAR1 WT–YFP or NA ECL2–YFP and Gαi–Rluc were stimulated with 10 nM α-Th, immunoprecipitated, and immunoblotted. Data (mean ± SD; n = 3) are from three independent experiments and were significant (***P < 0.001). (D) COS-7 cells coexpressing PAR1 WT–YFP or NA ECL2–YFP and β-arrestin-1–Rluc were stimulated with 10 nM α-Th, and BRET was determined. The data (mean ± SD; n = 3) are representative of three independent experiments. (E) PAR1 surface expression (mean ± SD; n = 3) was measured by ELISA.
Fig. S5.
Fig. S5.
PAR1 WT–YFP and NA ECL2 PAR1–YFP and Gαi–Rluc or β-arrestin-1–Rluc expression, luminescence, and fluorescence. (A) Total luminescence (Left) and fluorescence (Right) expressed as A.U. from COS-7 cells coexpressing PAR1 WT–YFP or NA ECL2–YFP together with Gαi–Rluc or pcDNA control. Data (mean ± SD; n = 3) are representative of three independent experiments. (B) PAR1 WT–YFP and NA ECL2–YFP cell surface expression in COS-7 cells coexpressing Gαi–Rluc or pcDNA vector was determined by ELISA. (C) Total luminescence (Left) and fluorescence (Right) from COS-7 cells coexpressing PAR1 WT–YFP or NA ECL2–YFP and β-arrestin-1–Rluc. Data (mean ± SD; n = 3) are representative of three independent experiments.
Fig. S6.
Fig. S6.
PAR1 WT and NA ECL2 concentration–response curves. (A) PAR1 WT and NA ECL2 HeLa cells with comparable cell surface expression were labeled with myo-[3H]inositol and left untreated (Ctrl) or treated with various concentrations of α-Th for 60 min at 37 °C. The data (mean ± SD; n = 3) are representative of three independent experiments. PAR1 surface expression (mean ± SD; n = 3) was determined by cell surface ELISA. (B) PAR1 WT and NA ECL2 expressed at similar levels in HeLa cells were treated without (Ctrl) or with various concentrations of α-Th for 1 min, and RhoA activation was determined. (Left) A representative RhoA GST-RBD pull-down immunoblot. (Right) The data (mean ± SD; n = 4) were normalized to total RhoA from four independent experiments. PAR1 surface expression (mean ± SD; n = 3) was determined by ELISA. (C) COS-7 cells transiently coexpressing PAR1 WT–YFP or NA ECL2–YFP and Gαi–Rluc were left untreated (Ctrl) or treated with various concentrations of α-Th for 2.5 min and net BRET signal was determined. (Left) The data (mean ± SD; n = 3) are the net BRET signal from three independent experiments. (Right) Total luminescence and fluorescence PAR1 WT–YFP and NA ECL2–YFP coexpressed with Gαi–Rluc.
Fig. 6.
Fig. 6.
Glycosylation-deficient endogenous PAR1 exhibits enhanced PI hydrolysis and diminished RhoA activation. (A) Endothelial cells incubated with 0.25 μg/mL tunicamycin (TNC) for 18 h and treated with 10 nM α-Th. Cells were lysed, immunoprecipitated, and immunoblotted. Asterisk (*) is a nonspecific band. (B) TNC-treated and untreated endothelial cells labeled with myo-[3H]inositol were stimulated with 10 nM α-Th, and [3H]IPs were measured. Data (mean ± SD; n = 3) were normalized to PAR1 surface expression from three independent experiments and were significant (**P < 0.01). (C) Endothelial cells treated with or without TNC and 10 nM α-Th were processed for GST-RBD pull-down assays, and RhoA activation was determined. Data (mean ± SD, n = 4) were normalized to PAR1 surface expression and were significant (*P < 0.05).
Fig. S7.
Fig. S7.
Surface expression of PAR1 in endothelial cells and fibroblasts and EGF signaling. Endothelial cells expressing endogenous PAR1 were treated with or without 0.25 μg/mL TNC for 18 h at 37 °C. (A) PAR1 surface expression (mean ± SD; n = 3) was measured by ELISA. (B) Control and TNC-treated endothelial cells were serum starved for 1 h at 37 °C, then treated with or without 100 ng/mL EGF for 5 min at 37 °C. Cells were lysed, and lysates were immunoblotted with anti-phospho-ERK1/2 and anti-total-ERK1/2 antibodies. The data (mean ± SD; n = 3) are representative of three independent experiments. (C) FLAG–PAR1 WT and NA ECL2 mutant cell surface expression (mean ± SD; n = 3) in mouse lung Par1−/− fibroblasts was determined by ELISA using anti-PAR1 antibody (first Ab) and GAM-HRP (second Ab).
Fig. 7.
Fig. 7.
PAR1 NA ECL2 exhibits diminished stress fiber formation and enhanced cellular proliferation. (A) FLAG–PAR1 WT or FLAG–NA ECL2 mutant HeLa cells were treated with 10 nM α-Th for 5 min, stained with phalloidin-TRITC, and imaged. Data (mean ± SD; n = 3) for f-actin fluorescence were quantified from four different images of three independent experiments and were significant (*P < 0.05). (Scale bar, 10 μm.) (B) FLAG–PAR1 WT HeLa cells pretreated with 1.5 μg/mL C3 toxin for 4 h at 37 °C or DMSO were incubated with 10 nM α-Th for 5 min and stained with phalloidin-TRITC, and f-actin fluorescence was quantified. Data (mean ± SD; n = 3) were significant (***P < 0.001). (Scale bar, 10 μm.) (C) Mouse lung fibroblasts expressing FLAG–PAR1 WT or NA ECL2 mutant were incubated without (basal) or (D) with 10 nM α-Th or 2% FBS, and [3H]thymidine incorporation was measured. Basal [3H]thymidine incorporation (mean ± SD; n = 3) is from three independent experiments and was significant (***P < 0.001). Data (mean ± SD; n = 3) are from α-Th-stimulated [3H]thymidine incorporation from three independent experiments and were significant (*P < 0.05). NS, not significant.

Similar articles

Cited by

References

    1. Coughlin SR. Protease-activated receptors in hemostasis, thrombosis and vascular biology. J Thromb Haemost. 2005;3(8):1800–1814. - PubMed
    1. Ramachandran R, Noorbakhsh F, Defea K, Hollenberg MD. Targeting proteinase-activated receptors: Therapeutic potential and challenges. Nat Rev Drug Discov. 2012;11(1):69–86. - PubMed
    1. Arora P, Ricks TK, Trejo J. Protease-activated receptor signalling, endocytic sorting and dysregulation in cancer. J Cell Sci. 2007;120(Pt 6):921–928. - PubMed
    1. Vu TK, Hung DT, Wheaton VI, Coughlin SR. Molecular cloning of a functional thrombin receptor reveals a novel proteolytic mechanism of receptor activation. Cell. 1991;64(6):1057–1068. - PubMed
    1. Vu TK, Wheaton VI, Hung DT, Charo I, Coughlin SR. Domains specifying thrombin-receptor interaction. Nature. 1991;353(6345):674–677. - PubMed

Publication types

MeSH terms