. 2015 Jul 7;112(27):8173-80.
doi: 10.1073/pnas.1509743112. Epub 2015 Jun 22.

Antibiotic efficacy is linked to bacterial cellular respiration

Affiliations

Antibiotic efficacy is linked to bacterial cellular respiration

Michael A Lobritz et al. Proc Natl Acad Sci U S A. .

Abstract

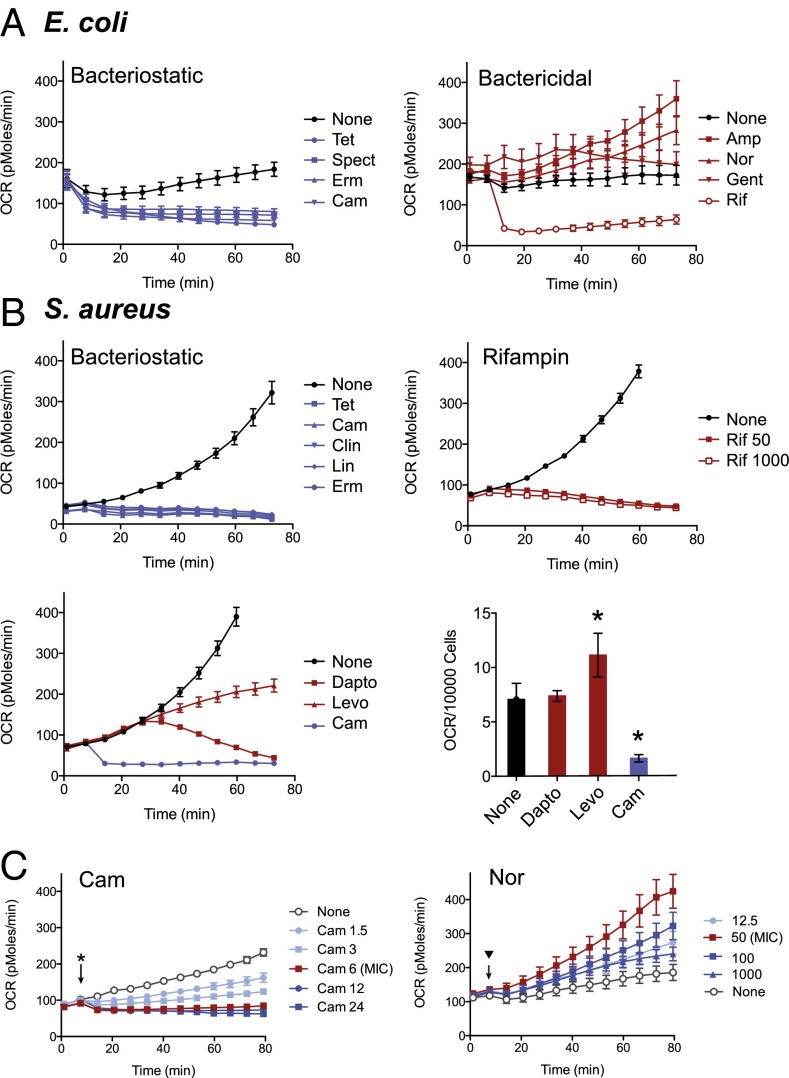
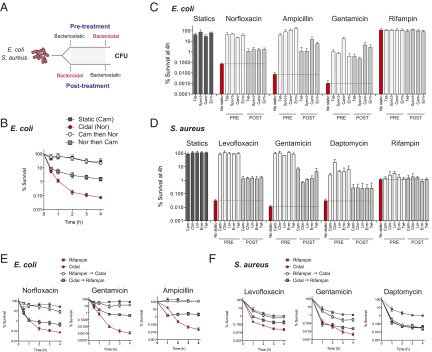
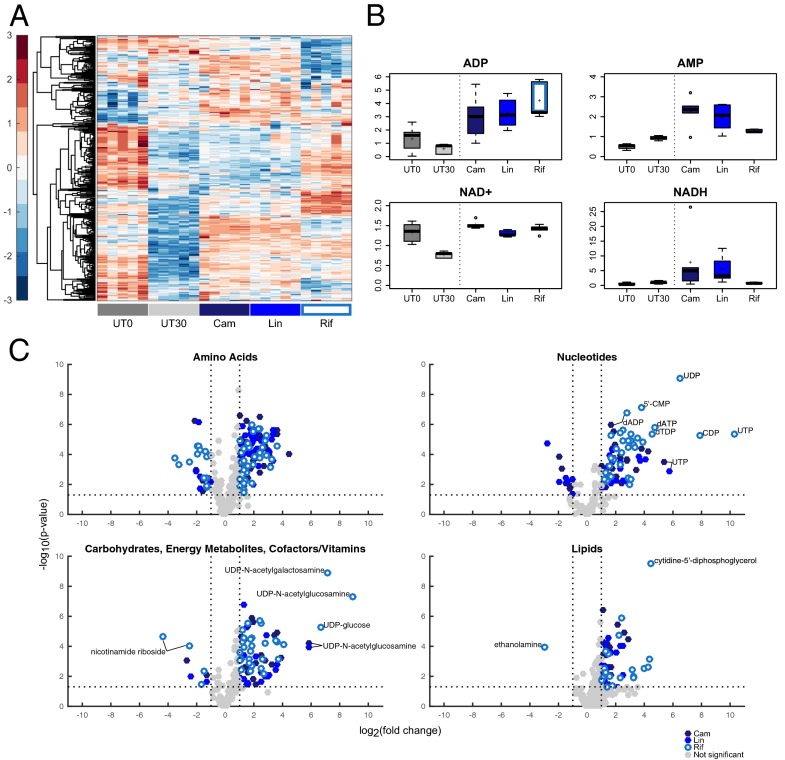
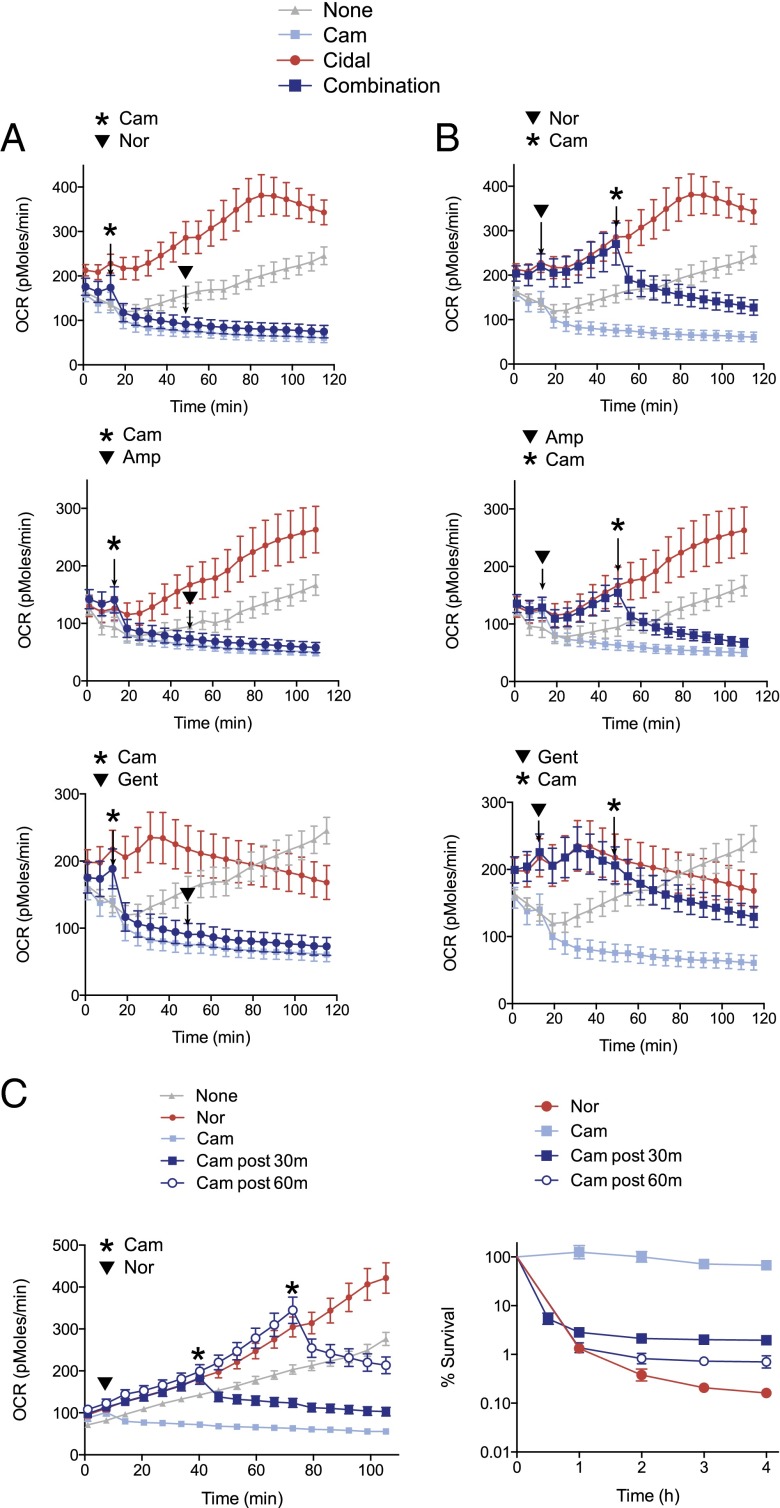
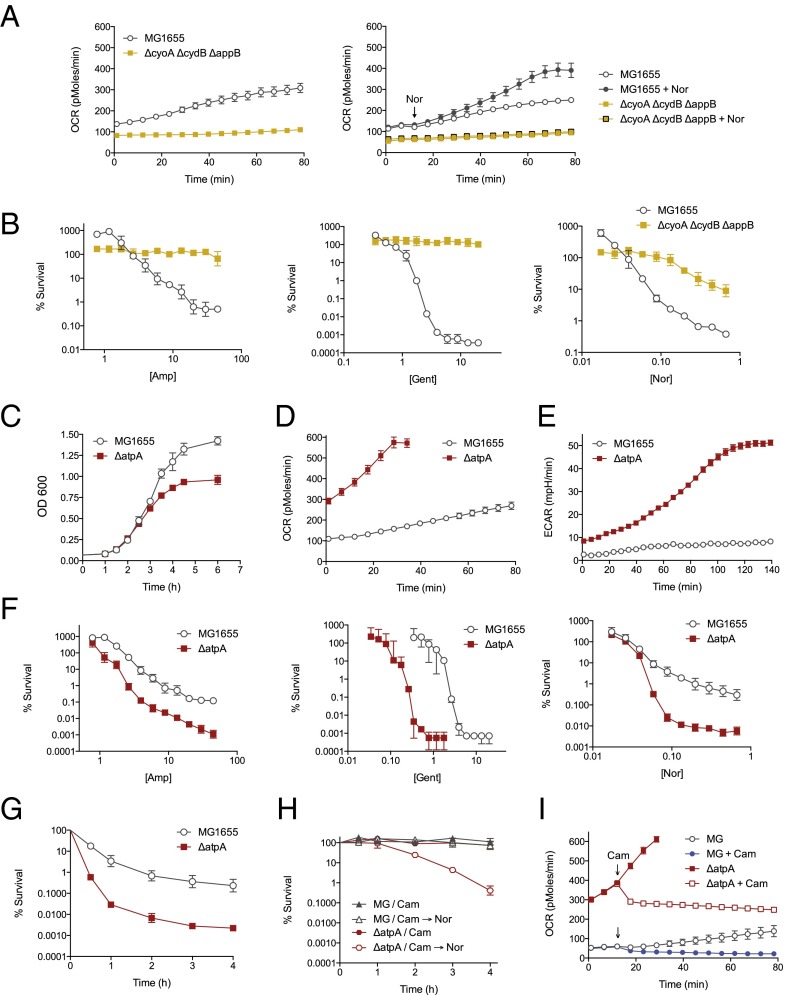
Bacteriostatic and bactericidal antibiotic treatments result in two fundamentally different phenotypic outcomes--the inhibition of bacterial growth or, alternatively, cell death. Most antibiotics inhibit processes that are major consumers of cellular energy output, suggesting that antibiotic treatment may have important downstream consequences on bacterial metabolism. We hypothesized that the specific metabolic effects of bacteriostatic and bactericidal antibiotics contribute to their overall efficacy. We leveraged the opposing phenotypes of bacteriostatic and bactericidal drugs in combination to investigate their activity. Growth inhibition from bacteriostatic antibiotics was associated with suppressed cellular respiration whereas cell death from most bactericidal antibiotics was associated with accelerated respiration. In combination, suppression of cellular respiration by the bacteriostatic antibiotic was the dominant effect, blocking bactericidal killing. Global metabolic profiling of bacteriostatic antibiotic treatment revealed that accumulation of metabolites involved in specific drug target activity was linked to the buildup of energy metabolites that feed the electron transport chain. Inhibition of cellular respiration by knockout of the cytochrome oxidases was sufficient to attenuate bactericidal lethality whereas acceleration of basal respiration by genetically uncoupling ATP synthesis from electron transport resulted in potentiation of the killing effect of bactericidal antibiotics. This work identifies a link between antibiotic-induced cellular respiration and bactericidal lethality and demonstrates that bactericidal activity can be arrested by attenuated respiration and potentiated by accelerated respiration. Our data collectively show that antibiotics perturb the metabolic state of bacteria and that the metabolic state of bacteria impacts antibiotic efficacy.

Keywords: E. coli; S. aureus; antibiotics; cellular respiration; metabolomics.


Conflict of interest statement

Conflict of interest statement: J.J.C. is a scientific cofounder and Scientific Advisory Board chair of EnBiotix, Inc., a start-up focused on antibiotic development.

Figures

Fig. 1.
Fig. 1.
Antibiotics perturb bacterial respiration. Real-time changes in oxygen consumption rate (OCR, in picomoles of molecular oxygen per minute) in response to antibiotic treatment in E. coli and S. aureus were measured on a Seahorse XFe Extracellular Flux Analyzer. (A, Left) OCR of E. coli treated with the following bacteriostatic antibiotics (5× MIC): tetracycline (Tet), spectinomycin (Spect), erythromycin (Erm), or chloramphenicol (Cam), compared with media plus vehicle. (Right) Real-time OCR of E. coli treated with the bactericidal antibiotics ampicillin (Amp), norfloxacin (Nor), gentamicin (Gent), or rifampin (Rif) at 5× MIC. (B) Real-time OCR of S. aureus treated with tetracycline (Tet), chloramphenicol (Cam), clindamycin (Clin), linezolid (Lin), or erythromycin (Erm) compared with vehicle-treated cells in TSB at 5× MIC. (Upper Right) OCR response to rifampin (Rif) in S. aureus relative to vehicle treated control at 4× MIC (50 ng/mL) and 80× MIC (1,000 ng/mL). (Lower Left) Demonstrates OCR of S. aureus in response to Cam, daptomycin (Dapto), and levofloxacin (Levo). (Lower Right) Normalized OCR per live cell. (C) E. coli OCR measurement with a dose range of chloramphenicol (μg/mL, MIC = 6 μg/mL). (Right) E. coli OCR measurement with a dose range of norfloxacin (ng/mL, MIC = 50 ng/mL) over time. Data represent mean ± SEM of eight replicates. Where appropriate, statistical analysis is shown (*P ≤ 0.01).
Fig. 2.
Fig. 2.
Bacteriostatic antibiotics disrupt bactericidal lethality. (A) Time-kill analysis was performed on E. coli or S. aureus with bacteriostatic-bactericidal antibiotic pairs. Pretreatment: Bacteria were initially treated with bacteriostatic antibiotics (5× MIC) and subsequently challenged with bactericidal drugs. Posttreatment: Bacteria received initial bactericidal challenge, and bacteriostatic drugs were added second. (B) Representative time-kill analysis of norfloxacin and chloramphenicol combination. In all screens, combination therapy was compared against monotherapy with the single bacteriostatic and bactericidal antibiotic. Survivorship was assessed hourly. Screening of 36 individual antibiotic combinations in E. coli (C) and S. aureus (D). For both datasets, cell survival was plotted at the 4-h time point as log-change in colony-forming units per milliliter, expressed as percent survival relative to the population at t = 0. Bacteriostatic antibiotic monotherapy (black) is listed first. Bactericidal monotherapy (red) is followed by pretreatment (white) and posttreatment approaches (light gray). Chloramphenicol (Cam); clindamycin (Clin); erythromycin (Erm); linezolid (Lin); spectinomycin (Spect); Tetracycline (Tet). Error bars represent SEM of three independent experiments. (E) Time-kill curves of E. coli treated with norfloxacin, ampicillin, gentamicin, or rifampin monotherapy, compared with pretreatment or posttreatment with rifampin. (F) Time-kill curves of S. aureus treated with levofloxacin, gentamicin, daptomycin, or rifampin with rifampin pre- or posttreatment. Curves show mean ± SEM of three independent experiments.
Fig. 3.
Fig. 3.
Broad metabolite accumulation observed in bacteriostatic-treated S. aureus. In A, B, and C, UT0 represents metabolite levels at the time of antibiotic addition; UT30 represents 30 min of growth in the absence of antibiotics. Cam, Lin, and Rif treatments were assessed 30 min after exposure. (A) Hierarchical clustering of log-transformed and autoscaled relative metabolite concentrations for S. aureus treated with bacteriostatic antibiotics or vehicle. Five independent experiments are shown as replicates. (B) Box plots of relative concentration values from five independent experiments for ADP, AMP, NAD+, and NADH. (C) Volcano plots showing the fold change (x axis) and significance (y axis) of metabolites detected in the major metabolic pathways. Blue shapes represent metabolites having a fold-change greater than two and P value less than 0.05; gray shapes represent metabolites that are not significantly changing. Fold changes are relative to UT30 control and are based on mean values of five independent experiments.
Fig. 4.
Fig. 4.
Bacteriostatic antibiotics dominantly inhibit bactericidal respiratory activity. (A) E. coli was pretreated with the bacteriostatic antibiotic chloramphenicol (Cam, asterisk) for 30 min, then challenged with bactericidal antibiotics (arrowhead). (B) OCR versus time of E. coli treated with bactericidal antibiotic first (arrowhead), and then Cam after 30 min (asterisk). Respiration rates were compared with untreated cells, Cam treatment alone, or bactericidal antibiotic treatment alone. (C) OCR of E. coli treated with Nor at 5× MIC (arrowhead), and then treated with Cam at 30 min or 60 min (asterisks). (Right) Inhibition of Nor killing in E. coli after addition of Cam at 30 or 60 min.
Fig. 5.
Fig. 5.
Uncoupling of respiration enhances bactericidal killing. (A) Basal cellular respiration of ΔcyoA ΔcydB ΔappB was compared with WT MG1655 using optical density-matched inputs. (Right) OCR response to challenge with Nor (250 ng/mL). (B) Cell survival as a function of antibiotic concentration after 90 min of drug exposure for Amp, Gent, and Nor. (C) Optical density of MG1655 or ΔatpA in M9 at 600 nanometers. (D) Basal oxygen consumption rate of optical density-matched cells. (E) Basal extracellular acidification rate (ECAR) in milli-pH/min of optical density-matched cells. (F) Cell survival as a function of antibiotic concentration after 90 min of drug exposure for Amp, Gent, and Nor. (G) Time-kill kinetics of MG1655 compared with ΔatpA with Nor (250 ng/mL). (H) Time-kill kinetics of cells preincubated with Cam (50 μg/mL) for 30 min before Nor (250 ng/mL) challenge. (I) Oxygen consumption perturbation induced by addition of Cam (50 μg/mL) in MG1655 and ΔatpA.

Comment in

Similar articles

Cited by

References

    1. Pankey GA, Sabath LD. Clinical relevance of bacteriostatic versus bactericidal mechanisms of action in the treatment of Gram-positive bacterial infections. Clin Infect Dis. 2004;38(6):864–870. - PubMed
    1. Finberg RW, et al. The importance of bactericidal drugs: Future directions in infectious disease. Clin Infect Dis. 2004;39(9):1314–1320. - PubMed
    1. Chowdhury MH, Tunkel AR. Antibacterial agents in infections of the central nervous system. Infect Dis Clin North Am. 2000;14(2):391–408. - PubMed
    1. Archer G, Fekety FR., Jr Experimental endocarditis due to Pseudomonas aeruginosa. II. Therapy with carbenicillin and gentamicin. J Infect Dis. 1977;136(3):327–335. - PubMed
    1. Carrizosa J, Kaye D. Antibiotic concentrations in serum, serum bactericidal activity, and results of therapy of streptococcal endocarditis in rabbits. Antimicrob Agents Chemother. 1977;12(4):479–483. - PMC - PubMed

Publication types

MeSH terms

Substances