. 2016 Jan 1;524(1):199-209.
doi: 10.1002/cne.23835. Epub 2015 Jul 16.

Linear correlation between the number of olfactory sensory neurons expressing a given mouse odorant receptor gene and the total volume of the corresponding glomeruli in the olfactory bulb

Affiliations

Linear correlation between the number of olfactory sensory neurons expressing a given mouse odorant receptor gene and the total volume of the corresponding glomeruli in the olfactory bulb

Olaf Christian Bressel et al. J Comp Neurol. .

Abstract

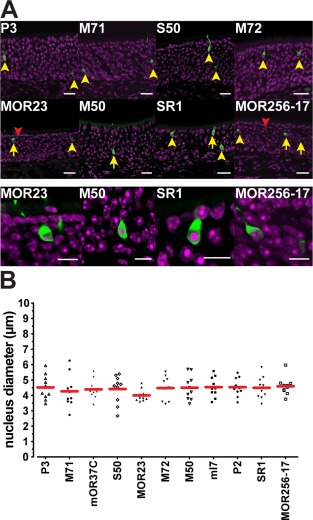
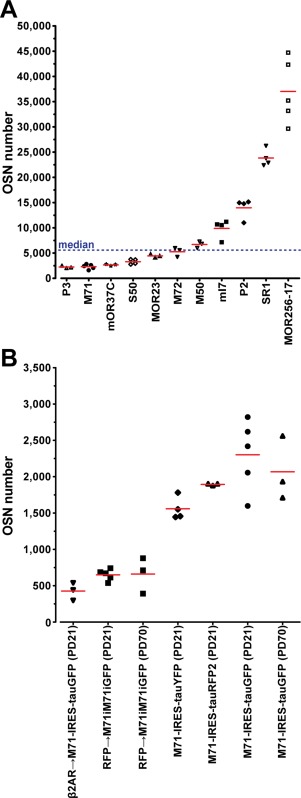
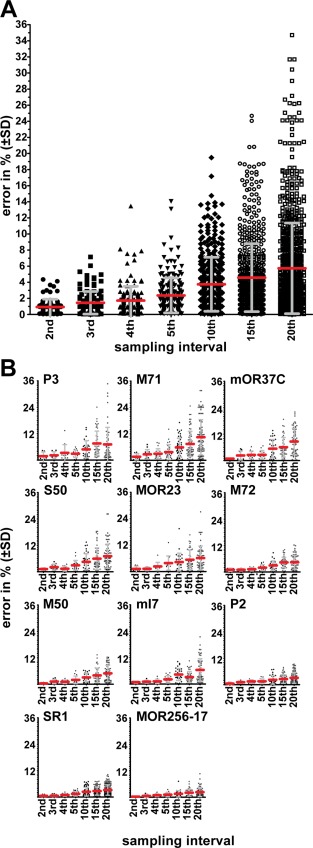
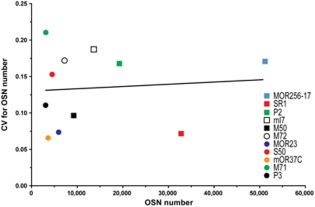
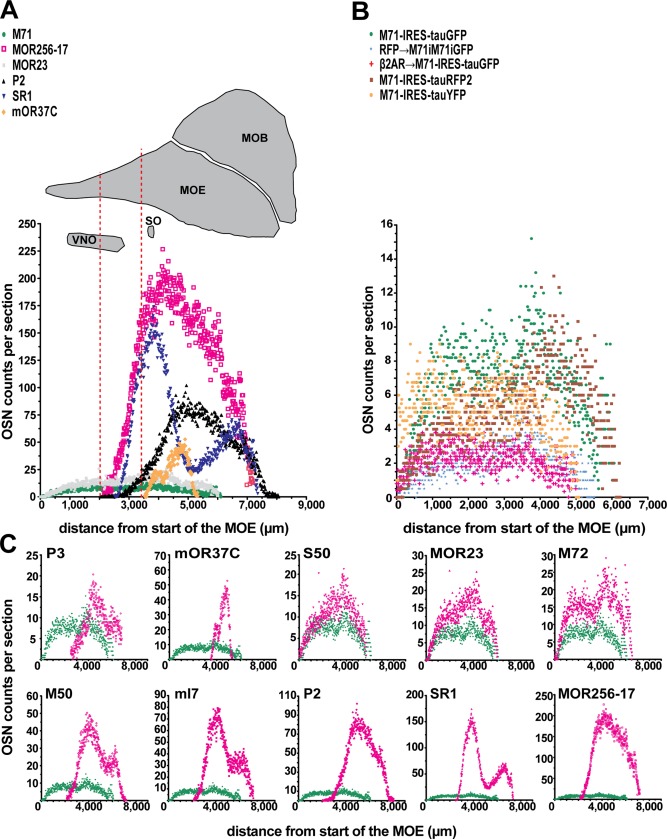
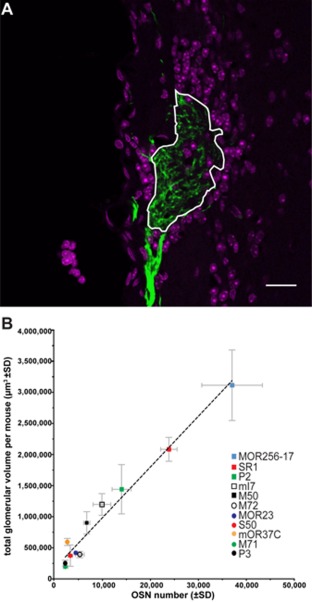
Chemosensory specificity in the main olfactory system of the mouse relies on the expression of ∼1,100 odorant receptor (OR) genes across millions of olfactory sensory neurons (OSNs) in the main olfactory epithelium (MOE), and on the coalescence of OSN axons into ∼3,600 glomeruli in the olfactory bulb. A traditional approach for visualizing OSNs and their axons consists of tagging an OR gene genetically with an axonal marker that is cotranslated with the OR by virtue of an internal ribosome entry site (IRES). Here we report full cell counts for 15 gene-targeted strains of the OR-IRES-marker design coexpressing a fluorescent protein. These strains represent 11 targeted OR genes, a 1% sample of the OR gene repertoire. We took an empirical, "count every cell" strategy: we counted all fluorescent cell profiles with a nuclear profile within the cytoplasm, on all serial coronal sections under a confocal microscope, a total of 685,673 cells in 56 mice at postnatal day 21. We then applied a strain-specific Abercrombie correction to these OSN counts in order to obtain a closer approximation of the true OSN numbers. We found a 17-fold range in the average (corrected) OSN number across these 11 OR genes. In the same series of coronal sections, we then determined the total volume of the glomeruli (TGV) formed by coalescence of the fluorescent axons. We found a strong linear correlation between OSN number and TGV, suggesting that TGV can be used as a surrogate measurement for estimating OSN numbers in these gene-targeted strains.

Keywords: main olfactory epithelium; odorant receptor; olfactory sensory neuron.


Figures

Figure 1
Figure 1
Fluorescent cells in the main olfactory epithelium of gene‐targeted mice. (A) Confocal images of coronal sections for eight selected strains sorted by average cell numbers: from P3, low, to MOR256‐17, high. The upper two rows show OSNs that are either counted (yellow arrows and arrowheads) or excluded from counting (red arrowheads). The bottom row shows magnified images of selected OSNs (yellow arrows). Intrinsic fluorescence in green, DAPI staining in magenta. (B) Nucleus diameter used for Abercrombie correction for the core set of 11 strains, measured with 10 single cells each. Scale bars = 20 μm in A, upper two rows, 10 μm in A, bottom row.
Figure 2
Figure 2
Numbers of fluorescent cells in OR‐IRES‐marker strains. (A) Average OSN number of the core set of 11 gene‐targeted strains at PD21. A symbol represents a single mouse. The blue line indicates the median of 5,983. (B) Average OSN number for strains with gene‐targeted mutations in the M71 locus at PD21 or PD70. The five mice of M71‐IRES‐tauGFP at PD21 in (B) are the same as in (A).
Figure 3
Figure 3
Effect of sampling interval. (A) Average percentage of difference (error) in interleaved sampling compared to the “count every cell” approach (±SD). Errors for all tauGFP strains for each sampling interval were pooled to calculate the averages. A symbol represents a single virtual sampling set. (B) Error of cell counts by sampling interval for GFP‐expressing strains sorted by average OSN number, from P3, low, to MOR256‐17, high. A symbol represents a single virtual sampling set.
Figure 4
Figure 4
Coefficient of variation (CV). CV for average OSN number of the 11 GFP strains shows that there is no correlation between average OSN number and CV. The line is best modeled by y = 3.1*10‐7x + 0.13 (r2 = 0.008, P = 0.79).
Figure 5
Figure 5
OSN counts across the anterior–posterior dimension of the main olfactory epithelium. (A) Average OSN counts per section. The dotted red lines indicate two reference positions in a sagittal view of a mouse head. Strains were chosen for showing the diversity in expression per section. Cells in the septal organ are not included in these counts. (B) Average OSN counts per section for strains with mutations in the M71 gene. (C) Average OSN counts per section of (tau)GFP‐expressing strains (magenta) compared to M71‐IRES‐tauGFP (green), sorted by average OSN number from P3, low, to MOR256‐17, high. The strains display a multitude of spatial expression patterns/zones.
Figure 6
Figure 6
Glomerular volume and correlation with OSN numbers. (A) Confocal image of an M71‐IRES‐tauGFP glomerulus. Green, intrinsic fluorescence; magenta, DAPI. The area framed in white is measured as the cross‐sectional area. (B) TGV per strain at PD21 correlates strongly and linearly to the OSN number (r2 = 0.97, P ≤ 0.0001) in the core set of 11 strains. The curve is best modeled by y = 81.55x + 168,700. A symbol represents a single strain. Scale bar = 20 μm in A.
Figure 7
Figure 7
Fluorescent pixel density in glomeruli. (A) The ratio of fluorescent pixels to all pixels in the glomerular area is ∼0.8 in all strains (ANOVA, F = 21.50, P < 0.0001), except for S50‐IRES‐tauGFP. A symbol represents a single mouse. Strains are sorted by average OSN number from P3, low, to MOR256‐17, high. (B) Example of a lateral S50‐IRES‐tauGFP glomerulus illustrates its lower fluorescent pixel density. Green, intrinsic fluorescence; white, DAPI. (C) Example of a medial S50‐IRES‐tauGFP glomerulus. (D) Ratios of axonal density for lateral versus medial S50‐IRES‐tauGFP glomeruli (±SD) show that only the lateral glomeruli have a lower fluorescent pixel density. A symbol represents the average of glomeruli in both bulbs of an individual mouse. Scale bars = 20 μm.

References

    1. Abercrombie, M. 1946. Estimation of nuclear population from microtome sections. Anat Rec 94:239–247. - PubMed
    1. Benes FM, Lange N. 2001. Two‐dimensional versus three‐dimensional cell counting: a practical perspective. Trends Neurosci 24:11–17. - PubMed
    1. Bozza T, Feinstein P, Zheng C, Mombaerts P. 2002. Odorant receptor expression defines functional units in the mouse olfactory system. J Neurosci 22:3033–3043. - PMC - PubMed
    1. Bozza T, Vassalli A, Fuss S, Zhang JJ, Weiland B, Pacifico R, Feinstein P, Mombaerts P. 2009. Mapping of class I and class II odorant receptors to glomerular domains by two distinct types of olfactory sensory neurons in the mouse. Neuron 29:220–233. - PMC - PubMed
    1. Buck L, Axel R. 1991. A novel multigene family may encode odorant receptors: a molecular basis for odor recognition. Cell 65:175–187. - PubMed

Publication types

LinkOut - more resources