Enhanced Evaporation Strength through Fast Water Permeation in Graphene-Oxide Deposition
- PMID: 26100977
- PMCID: PMC4477327
- DOI: 10.1038/srep11896
Enhanced Evaporation Strength through Fast Water Permeation in Graphene-Oxide Deposition
Abstract
The unique characteristic of fast water permeation in laminated graphene oxide (GO) sheets has facilitated the development of ultrathin and ultrafast nanofiltration membranes. Here we report the application of fast water permeation property of immersed GO deposition for enhancing the performance of a GO/water nanofluid charged two-phase closed thermosyphon (TPCT). By benchmarking its performance against a silver oxide/water nanofluid charged TPCT, the enhancement of evaporation strength is found to be essentially attributed to the fast water permeation property of GO deposition instead of the enhanced surface wettability of the deposited layer. The expansion of interlayer distance between the graphitic planes of GO deposited layer enables intercalation of bilayer water for fast water permeation. The capillary force attributed to the frictionless interaction between the atomically smooth, hydrophobic carbon structures and the well-ordered hydrogen bonds of water molecules is sufficiently strong to overcome the gravitational force. As a result, a thin water film is formed on the GO deposited layers, inducing filmwise evaporation which is more effective than its interfacial counterpart, appreciably enhanced the overall performance of TPCT. This study paves the way for a promising start of employing the fast water permeation property of GO in thermal applications.
Figures


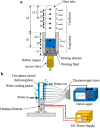
 .
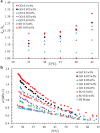
.
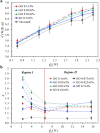
 during the heat conduction experiments. (b) The evaporator heat transfer coefficient augmentation ratio, η, as a function of
  with nanoparticles weight ratio as a parameter. Two distinct regimes –
  and
and  can be clearly identified.


Similar articles
-
Remarkable Thermal Performance Enhancement of Micro Heat Pipes with Graphene-Nanoplatelet Nano-Wicks.Nanomaterials (Basel). 2023 Jan 4;13(2):232. doi: 10.3390/nano13020232. Nanomaterials (Basel). 2023. PMID: 36677986 Free PMC article.
-
Effective micro-spray cooling for light-emitting diode with graphene nanoporous layers.Nanotechnology. 2017 Apr 21;28(16):164003. doi: 10.1088/1361-6528/aa6385. Epub 2017 Feb 28. Nanotechnology. 2017. PMID: 28244882
-
Effects of interlayer spacing and oxidation degree of graphene oxide nanosheets on water permeation: a molecular dynamics study.J Mol Model. 2022 Feb 8;28(3):57. doi: 10.1007/s00894-022-05045-7. J Mol Model. 2022. PMID: 35137256
-
Molecular mechanism of water permeation in a helium impermeable graphene and graphene oxide membrane.Phys Chem Chem Phys. 2015 Aug 28;17(32):20557-62. doi: 10.1039/c5cp02410b. Epub 2015 Jul 22. Phys Chem Chem Phys. 2015. PMID: 26198311
-
Ultrathin graphene-based membrane with precise molecular sieving and ultrafast solvent permeation.Nat Mater. 2017 Dec;16(12):1198-1202. doi: 10.1038/nmat5025. Epub 2017 Nov 13. Nat Mater. 2017. PMID: 29170556
Cited by
-
Effect of graphene oxide (GO) nanosheet sizes, pinhole defects and non-ideal lamellar stacking on the performance of layered GO membranes: an atomistic investigation.Nanoscale Adv. 2019 May 28;1(8):3023-3035. doi: 10.1039/c9na00235a. eCollection 2019 Aug 6. Nanoscale Adv. 2019. PMID: 36133605 Free PMC article.
-
Remarkable Thermal Performance Enhancement of Micro Heat Pipes with Graphene-Nanoplatelet Nano-Wicks.Nanomaterials (Basel). 2023 Jan 4;13(2):232. doi: 10.3390/nano13020232. Nanomaterials (Basel). 2023. PMID: 36677986 Free PMC article.
References
-
- Novoselov K. S. et al. Electric field effect in atomically thin carbon films. Science 306, 666–669 (2004). - PubMed
-
- Balandin A. A. et al. Superior thermal conductivity of single-layer graphene. Nano Lett. 8, 902–907 (2008). - PubMed
-
- Huang X. et al. Graphene-based materials: Synthesis, characterization, properties, and applications. Small 7, 1876–1902 (2011). - PubMed
-
- Zhu Y. et al. Graphene and graphene oxide: Synthesis, properties, and applications. Adv. Mater. 22, 3906–3924 (2010). - PubMed
-
- Zhu Y., James D. K. & Tour J. M. New routes to graphene, graphene oxide and their related applications. Adv. Mater. 24, 4924–4955 (2012). - PubMed
Publication types
LinkOut - more resources
Full Text Sources
Other Literature Sources
Research Materials

