Comparative Study
. 2016 Feb 15;524(3):564-77.
doi: 10.1002/cne.23837. Epub 2015 Jul 18.

Individual differences in cortical connections of somatosensory cortex are associated with parental rearing style in prairie voles (Microtus ochrogaster)

Affiliations
Comparative Study

Individual differences in cortical connections of somatosensory cortex are associated with parental rearing style in prairie voles (Microtus ochrogaster)

Adele M H Seelke et al. J Comp Neurol. .

Abstract

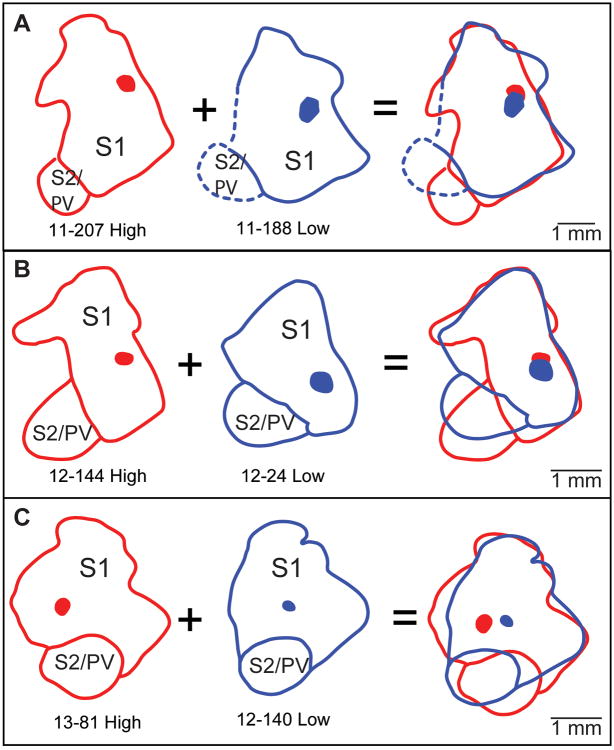
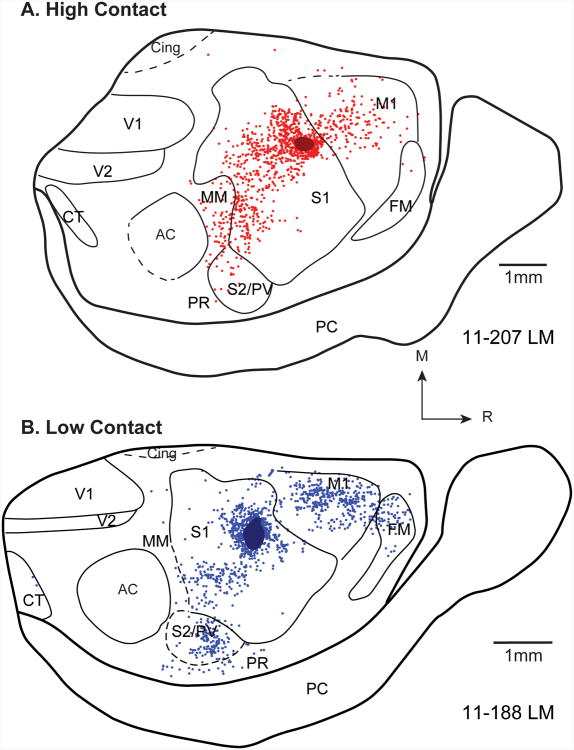
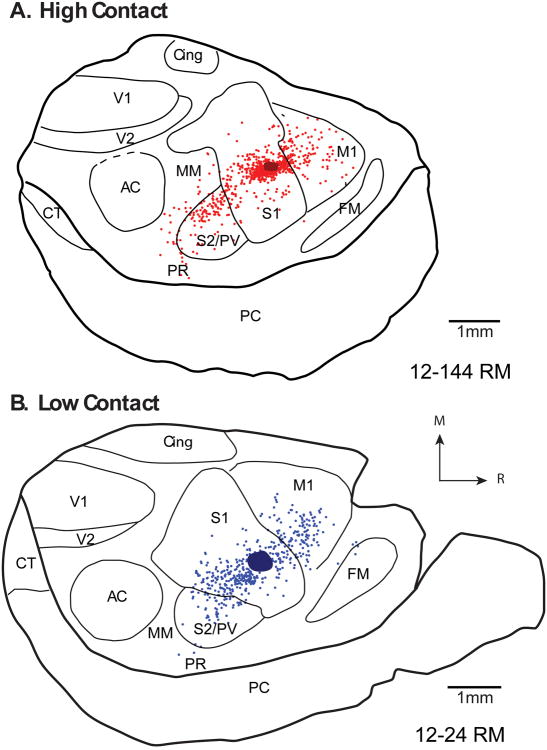
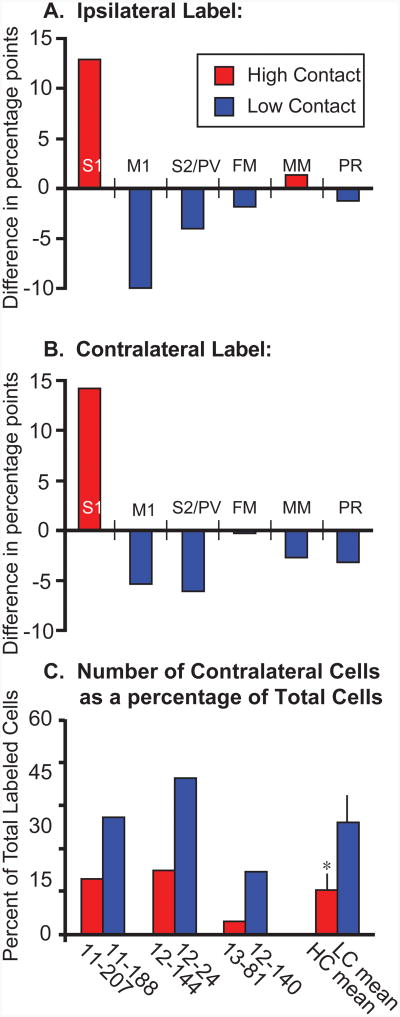
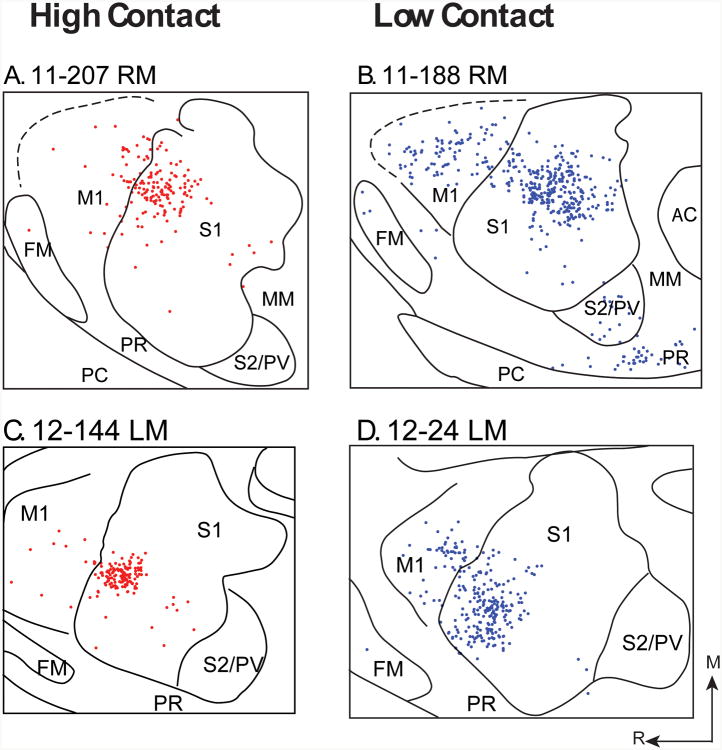
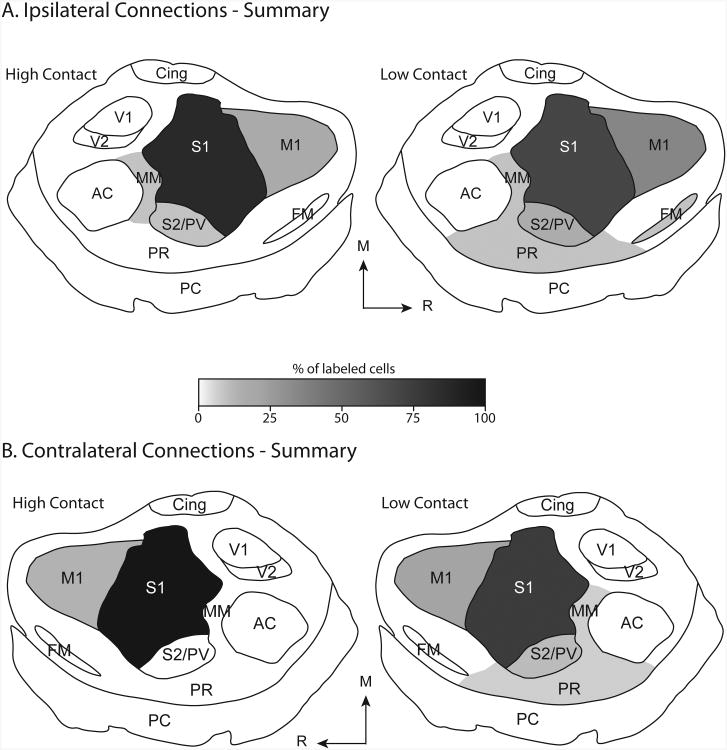
Early-life sensory experiences have a profound effect on brain organization, connectivity, and subsequent behavior. In most mammals, the earliest sensory inputs are delivered to the developing brain through tactile contact with the parents, especially the mother. Prairie voles (Microtus ochrogaster) are monogamous and, like humans, are biparental. Within the normal prairie vole population, both the type and the amount of interactions, particularly tactile contact, that parents have with their offspring vary. The question is whether these early and pervasive differences in tactile stimulation and social experience between parent and offspring are manifest in differences in cortical organization and connectivity. To address this question, we examined the cortical and callosal connections of the primary somatosensory area (S1) in high-contact (HC) and low-contact (LC) offspring using neuroanatomical tracing techniques. Injection sites within S1 were matched so that direct comparisons between these two groups could be made. We observed several important differences between these groups. The first was that HC offspring had a greater density of intrinsic connections within S1 compared with LC offspring. Additionally, HC offspring had a more restricted pattern of ipsilateral connections, whereas LC offspring had dense connections with areas of parietal and frontal cortex that were more widespread. Finally, LC offspring had a broader distribution of callosal connections than HC offspring and a significantly higher percentage of labeled callosal neurons. This study is the first to examine individual differences in cortical connections and suggests that individual differences in cortical connections may be related to natural differences in parental rearing styles associated with tactile contact.

Keywords: S1; development; epigenetics; individual differences; primary somatosensory cortex.


Conflict of interest statement

Conflict of Interest Statement: The authors declare that they have no identified conflicts of interest.

Figures

Figure 1
Figure 1. Behavioral assessment of high contact (HC) and low contact (LC) voles
A) The total amount of time HC (red) and LC (blue) parents spend in contact with their pups. LC animals differ from HC animals on measures of maternal + paternal care (left) and total maternal care (center), but they did not differ on a measure of total paternal care (right). B) The amount of time HC and LC parents spend in specific pup-oriented behaviors. During non-huddling contact the fathers were quiescent and in contact with the pups. Lateral nursing involved the mother laying on her side with the pups latched to her ventrum. Neutral nursing involved standing over the pups in a relaxed position without locomotion. HC mothers (red) spent significantly more time than LC mothers (blue) engaging in each of these behaviors. Mean + s.e. * - significantly differs from HC. Adapted from Perkeybile et al., 2013.
Figure 2
Figure 2. Reconstruction of the flattened vole cortex
A) A tangential section of cortical tissue stained for myelin. Darkly staining fields correspond to S1 and S2/PV. Note that S1 is not homogeneous but is broken into myelin light and dark regions that separate major body part representations. Using an entire series of myelin sections, we are able to identify the borders of the sensory areas, and divisions within S1 (B). The representations of different body parts within S1 are indicated in (C). Adapted from Campi et al., 2010. Conventions as in previous figures.
Figure 3
Figure 3. Examples of injections and cells retrogradely labeled with Fluoro Ruby
Digital images showing the injection site in S1 of cases 11-207 (A) and 11-188 (B). In both cases the injection site is small and localized to S1. Labeled cells resulting from these injection sites were clearly visible. In high contact (HC; C) animals, S1 contained a higher proportion of labeled cells than in low contact (LC; D) animals. In contrast, M1 (E, F) and S2 (G, H) contained a lower proportion of labeled cells in HC than LC animals. For all cases, the number and percent of labeled cells were quantified. See Table 1 for abbreviations. Scale = 50 μm
Figure 4
Figure 4. The location of matched injections sites
Sites are shown in a high contact animal (A) and a low contact animal (C) relative to architectonic boundaries in tissue stained for myelin (B, D). The boxes in A and C delineate the extent of the area shown in the myelin stained tissue in B and D. The boundaries drawn in A and C were determined from the entire series of myelin stained sections. Arrows indicate the location of the injection sites. Medial is up, rostral is right. Scale = 1mm. Conventions as in previous figures.
Figure 5
Figure 5. Matching injection sites
A schematic illustrating how injection locations and sizes were matched for analysis in high and low contact (A – C). The boundaries of the primary somatosensory cortex (S1) are shown as thick red (high contact) and blue (low contact) lines. The extent of the injection sites are indicated by translucent red (high contact) and blue (low contact) ovoids. This includes the injection site and the halo surrounding the site. Injection site locations and sizes were matched by aligning the rostral and lateral boundaries of S1. Injection sites were considered to be matched when they were of similar size and located in close proximity to each other (400 microns). Conventions as in previous figures. Scale = 1mm.
Figure 6
Figure 6. Patterns of ipsilateral connections
Comparison of patterns of ipsilateral cortical connections resulting from size and location matched S1 injections in high (A) and low (B) contact voles. Red and blue dots denote individual neurons labeled by the neuroanatomical tracer in high and low contact animals, respectively. A) In the high contact animal (11-207), most ipsilateral label is intrinsic to S1. Moderate label is seen in M1, and weak label is found in S2/PV, MM, and FM. B). In the low contact animal (11-188), most ipsilateral label is intrinsic to S1. Moderate label is seen in M1 and S2/PV, and weak label is found in FM, MM, and PR. Note the difference in the distribution of labeled cells, particularly in M1, FM and S2/PV. See Figure 8 for the quantified differences in the distribution of labeled cells. Conventions as in previous figures.
Figure 7
Figure 7. Patterns of ipsilateral connections
Comparison of patterns of ipsilateral cortical connections resulting from size and location matched S1 injections in high (A) and low (B) contact voles. Red and blue dots indicate individual neurons labeled by the neuroanatomical tracer in high and low contact animals, respectively. Patterns of label in S1, M1 and S2/PV are similar to those observed for high and low contact animals in the previous case (Fig. 6), but with differences in density. See Table 1 for abbreviations. Rostral is to the right and medial is up. Scale = 1mm. Conventions as in previous figures.
Figure 8
Figure 8. Distribution of labeled cells in high- and low-contact animals
Difference in the distribution of labeled cells in high and low contact animals in both the ipsilateral (A) and contralateral (B) hemispheres. The proportion of labeled cells in each cortical field was averaged across animals within a condition (N=3). Within the ipsilateral hemisphere the mean percentages for the low contact (LC) animals were subtracted from the mean percentages for the high contact (HC) animals. The same calculations were performed for the contralateral hemisphere (“Contralateral Label”, B). Positive values indicate a higher proportion of labeled cells in a given cortical field in the HC animals, while negative values indicate a higher proportion of labeled cells in the LC animals. Thus in both the ipsilateral and contralateral hemispheres, HC animals had a higher proportion of labeled cells in S1 (12.8% more ipsilaterally, 14.2% more contralaterally) than LC animals, while LC animals had a higher proportion of labeled cells in M1 (9.8% more ipsilaterally, 5.1% more contralaterally), S2/PV (3.9% more ipsilaterally, 6.1% more contralaterally), and PR (1.2% more ipsilaterally and 3.2% more contralaterally) than HC animals. C) The proportion of labeled cells in the contralateral hemisphere out of the total number of labeled cells in both hemipsheres was also determined for both HC (red) and LC (blue) voles. In matched pairs and means across each group, HC voles had proportionally fewer contralaterally labeled cells than LC voles. * - significantly different from LC.
Fig 9
Fig 9. Patterns of contralateral connections
Comparison of patterns of contralateral cortical connections resulting from size and location matched S1 injections in high (A and C) and low (B and D) contact voles. Red and blue dots indicate individual cells labeled by the neuroanatomical tracer in high and low contact animals, respectively. High contact (HC) cases are characterized by dense homotopic connections within S1, sparse or no label within M1, and a lack of labeled cells within S2/PV. In contrast, while low contact (LC) cases also showed dense homotopic connections within S1, they had moderate numbers of labeled cells within M1. Labeled cells were additionally found within S2/PV, MM, FM, and PR. See Table 1 for abbreviations. Rostral is to the left and medial is up. Scale = 1mm. Conventions as in previous figures.
Fig 10
Fig 10. Summary of HC and LC connections
Schematic representing the distribution of labeled cells in the ipsilateral and contralateral cortex of high contact (HC) and low contact (LC) voles following the injection of neuroanatomical tracers into S1. The mean proportion of labeled cells found within a given cortical area is represented by a gradient ranging from black (100% of labeled cells) to white (0% of labeled cells). Within the ipsilateral hemisphere of HC voles (A, left), S1 contained 81% of labeled cells, S2/PV contained 5% of labeled cells, M1 contained 9% of labeled cells, and MM contained 3% of labeled cells. Within the ipsilateral hemisphere of LC voles (A, right), S1 contained 68% of labeled cells, S2/PV contained 9% of labeled cells, M1 contained 19% of labeled cells, and FM, MM, and PR contained 2%, 1%, and 2% of labeled cells, respectively. Within the contralateral hemisphere of HC voles (B, left), S1 contained 90% of labeled cells and M1 contained 10% of labeled cells. Within the contralateral hemisphere of LC voles (B, right), S1 contained 75% of labeled cells, S2/PV contained 6% of labeled cells, M1 contained 15% of labeled cells, and MM and PR each contained 3% of labeled cells. Areas containing less than 1% of labeled cells were not included in this analysis. Conventions as in previous figures.

Similar articles

Cited by

References

    1. Adams DL, Horton JC. Capricious expression of cortical columns in the primate brain. Nat Neurosci. 2003;6(2):113–114. - PubMed
    1. Bales KL, Carter CS. Sex differences and developmental effects of oxytocin on aggression and social behavior in prairie voles (Microtus ochrogaster) Horm Behav. 2003;44(3):178–184. - PubMed
    1. Bales KL, Perkeybile AM, Conley OG, Lee MH, Guoynes CD, Downing GM, Yun CR, Solomon M, Jacob S, Mendoza SP. Chronic intranasal oxytocin causes long-term impairments in partner preference formation in male prairie voles. Biological psychiatry. 2013;74(3):180–188. - PMC - PubMed
    1. Bales KL, van Westerhuyzen JA, Lewis-Reese AD, Grotte ND, Lanter JA, Carter CS. Oxytocin has dose-dependent developmental effects on pair-bonding and alloparental care in female prairie voles. Horm Behav. 2007;52(2):274–279. - PMC - PubMed
    1. Bishop KM, Rubenstein JL, O'Leary DD. Distinct actions of Emx1, Emx2, and Pax6 in regulating the specification of areas in the developing neocortex. J Neurosci. 2002;22(17):7627–7638. - PMC - PubMed

Publication types

LinkOut - more resources