. 2015 Jun 22;209(6):829-42.
doi: 10.1083/jcb.201408045.

Pheromone-encoding mRNA is transported to the yeast mating projection by specific RNP granules

Affiliations

Pheromone-encoding mRNA is transported to the yeast mating projection by specific RNP granules

Stella Aronov et al. J Cell Biol. .

Abstract

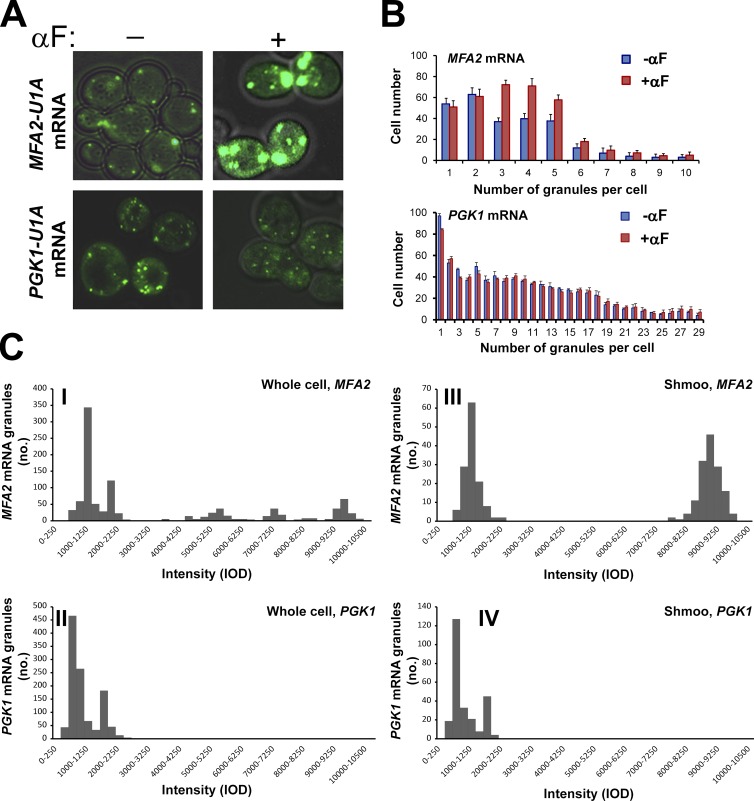
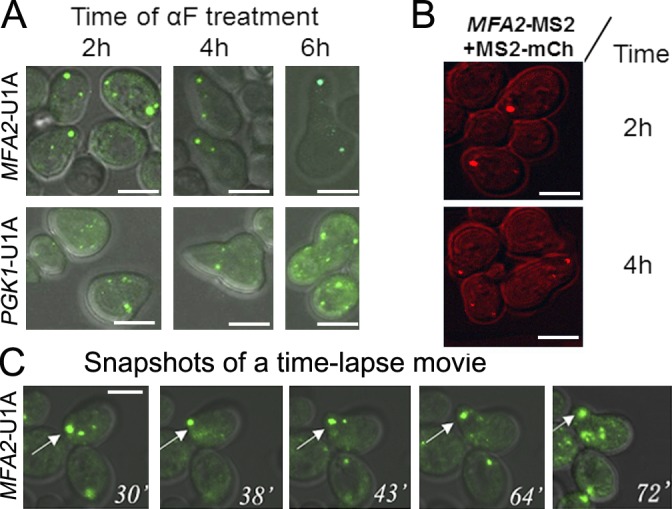
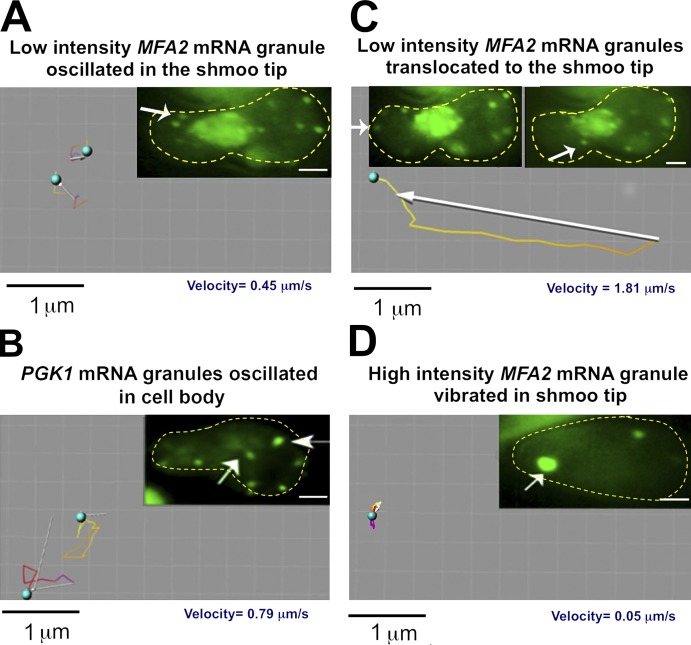
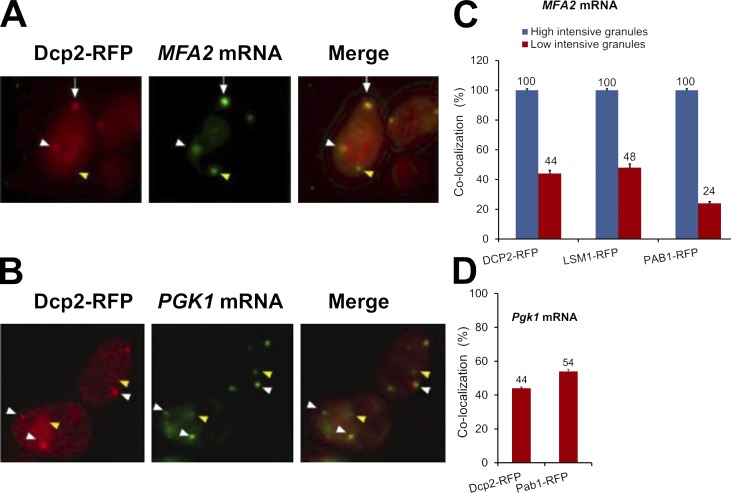
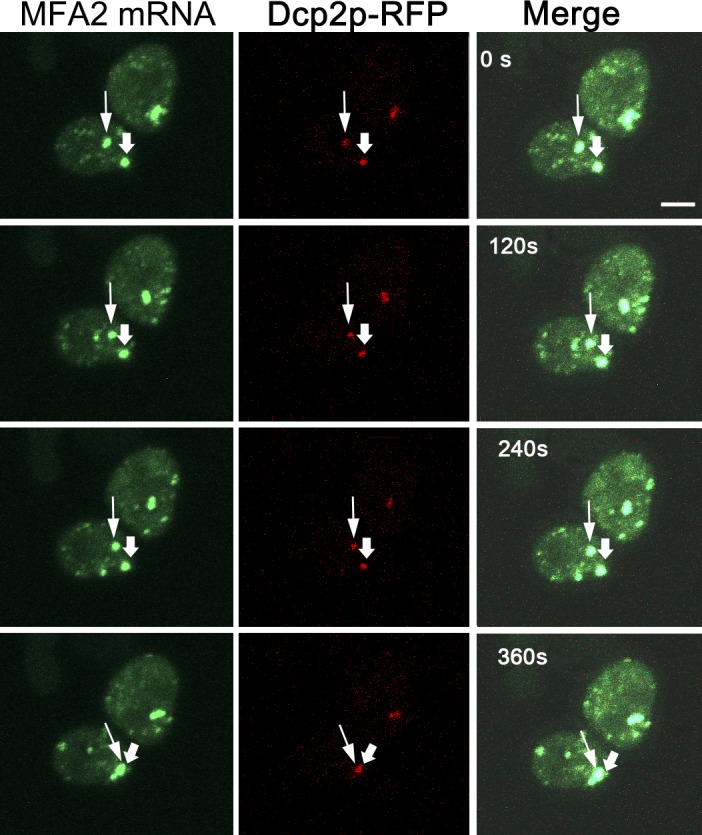
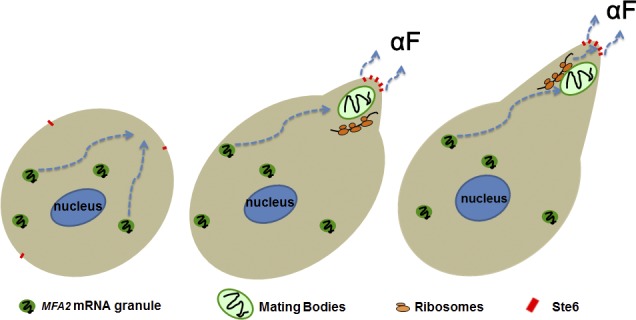
Association of messenger RNAs with large complexes such as processing bodies (PBs) plays a pivotal role in regulating their translation and decay. Little is known about other possible functions of these assemblies. Exposure of haploid yeast cells, carrying mating type "a," to "α pheromone" stimulates polarized growth resulting in a "shmoo" projection; it also induces synthesis of "a pheromone," encoded by MFA2. In this paper, we show that, in response to α pheromone, MFA2 mRNA is assembled with two types of granules; both contain some canonical PB proteins, yet they differ in size, localization, motility, and sensitivity to cycloheximide. Remarkably, one type is involved in mRNA transport to the tip of the shmoo, whereas the other-in local translation in the shmoo. Normal assembly of these granules is critical for their movement, localization, and for mating. Thus, MFA2 mRNAs are transported to the shmoo tip, in complex with PB-like particles, where they are locally translated.


Figures

Figure 1.
Figure 1.
In response to pheromone treatment, the number, intensity, and distribution of MFA2 mRNA granules increases, whereas PGK1 mRNA granules remain unchanged. (A) The WT strain coexpressing U1A-GFP and either MFA2-U1A (ySA20) or PGK1-U1A (ySA32) was grown to the early exponential phase and treated with 3 nM αF for 60 min, as indicated. Bar, 5 µm. (B) Quantification of the number of MFA2 or PGK1 mRNA granules in treated and untreated cells 1 h after adding αF. Histograms illustrating the distribution of mRNA granules per cell are shown. Error bars represent the standard deviation of three independent experiments. n = 200–350 cells. Averaging these numbers revealed that, in response to αF, the number of MFA2 mRNA–containing granules per cell increased twofold, whereas their intensity increased threefold. No change in the number and intensity of the PGK1 mRNA–containing granules was observed in response to a similar treatment with αF. (C) Intensity histograms of MFA2 and PGK1 mRNA granules in αF-treated cells. The WT strain coexpressing U1A-GFP and either MFA2-U1A (ySA20) or PGK1-U1A (ySA32) was treated with αF for 2 h. Images were captured, threshold, and analyzed for Integrated Optical Density (IOD) using the ImageJ program. IOD distributions are depicted as histograms (see Materials and methods). 200–350 cells displaying a clear shmoo were analyzed. Distribution of intensities of the MFA2 and PGK1 mRNA granules in a whole cell (I and II) and in the shmoo region (III-IV) are shown. Note the clear distinction between the “low-intensity” granules (750–2,200 IOD) and the “high-intensity” granules (8,000–10,000 IOD). The data represent compilation of three independent experiments.
Figure 2.
Figure 2.
MFA2 mRNA granules, but not PGK1 mRNA granules, are preferentially localized to shmoo tips. (A)­­ Microscopic analysis of the distribution of low- and high-intensity MFA2 and PGK1 mRNA granules during shmoo growth. The WT strain coexpressing U1A-GFP and either MFA2-U1A (ySA20) or PGK1-U1A (ySA32) was treated with αF for the indicated time. n = 200–250 from three independent experiments. (B) Shmoo localization of MFA2 mRNA granules was observed using an MS2 labeling system, instead of the U1A system. The WT strain (ySA24) expressing MFA2-MS2 (from pMC475) and MS2-mCh (from pMC522) was grown in selective medium until mid–log phase and then treated with αF. At the indicated time after αF addition, cells were inspected under confocal microscope. (C) Snapshots from time-lapse analysis of MFA2 mRNA-containing granules during shmoo formation in response to αF treatment (Video 1). The arrows point at a high-intensity MFA2 mRNA granule that was located in the shmoo tip during the growth of the shmoo (Video 1). Bars, 5 µm.
Figure 3.
Figure 3.
Tracking analysis of MFA2 and PGK1 mRNA granules. (A–D) Cells expressing a MFA2-U1A detection system (A, C, and D) or a PGK1-U1A detection depiction system (B) were treated with αF for 2 h and high- and low-intensity granules (marked by arrows) in the shmoo region and cell body were tracked using the Imaris program in 2D videos (see Materials and methods). Images in A and C are snapshots taken from Videos 2 and 3. The yellow dotted lines highlight the cell boundary. (A) Two low-intensity MFA2 mRNA granules located in the shmoo region of the cell were tracked. Note the oscillatory motion and slow translocation of the granules. Tracking shows movement duration of 6.6 s. (B) Two low intensity motile PGK1 mRNAs granules in the cell body were tracked; note the oscillatory motion and slow translocation of the granules. Tracking shows movement duration 6.3 s (Videos 4 and 5). (C) A low-intensity MFA2 mRNA granule that was translocated from the cell body to the shmoo tip was tracked. The right arrow points at the translocated granule, at its half-way location; the left arrow points at this granule at its final destination. The tracking shows movement duration of 4.1 s. Note the rapid translocation from the cell body to the shmoo tip. (D) A high-intensity MFA2 mRNA granule located in the growing shmoo tip was tracked. The tracking shows movement duration of 60 s. Note the vibrational motion of the granule that remains localized to the shmoo tip.
Figure 4.
Figure 4.
MFA2 mRNA granules colocalize with PBs in the shmoo tip. (A) Cells expressing MFA2 mRNA and the PB marker, Dcp2p-RFP (red; ySA22), were treated with αF for 2 h and analyzed by fluorescence microscopy. Both high- and low-intensity granules colocalized with the PB marker (see also Video 6). Arrows show high-intensity mRNA granules colocalized with PB marker; white arrowheads mark colocalized low-intensity granules; yellow arrowheads show low-intensity mRNA granules that did not colocalize with PB markers. (B) Colocalization of PGK1 mRNA and PB markers in αF-treated yeast. Cells expressing PGK1-U1A mRNA (green) and Dcp2p-RFP (red; ySA26) were treated with αF for 2 h, as indicated, and analyzed by fluorescence microscopy. (C) Colocalization of high- and low-intensity MFA2 mRNA granules with the indicated markers in αF-treated cells (ySA21; ySA23). (D) Colocalization of PGK1 mRNA with PB markers (ySA26; ySA33) in αF-treated cells. Error bars represent the standard deviation from three independent experiments. n = 220–250 cells. Bars, 5 µm.
Figure 5.
Figure 5.
MFA2 mRNA move together with Dcp2p-RFP in αF-treated cells. Snapshots of Video 6 are shown, indicating a time-lapse analysis of early time points after αF treatment (when the stationary granule was still of low intensity) performed using z stack (six slices with 0.6-µm thickness), during 360 s. Bar, 2 µm. The thin arrowheads show one example of MFA2 mRNA granules colocalized with Dcp2p-RFP (ySA22). The thick arrowheads point at the stationary granule at the tip of the (still) small shmoo. Note that the marked low-intensity granule moved, together with Dcp2p, in the direction of the shmoo tip.
Figure 6.
Figure 6.
PB integrity is required for the normal responses and shmoo localization of MFA2 mRNA granules to αF treatment and for efficient mating. (A and B) MFA2 mRNA was expressed in WT cells and in two strains defective in PB formation—pat1Δ dhh1Δ (ySA25; A) and edc3Δ lsm4ΔC (ySA25; B). The cells were treated with αF for 2 h, and the number of MFA2 mRNA granules were counted (n = 200–350 cells). Histograms are plotted as in Fig. 1 B. (C) Granules are preferentially localized in the shmoo-proximal portion of WT cells but not in mutant cells. WT and double deletion mutant strains, described in A and B, were treated with αF for 2, 4, or 6 h. Each type of cell was divided into two equal portions, one containing a shmoo (“shmoo-proximal”) and a “shmoo-distal” (cell body) one. MFA2 mRNA granules were counted and classified into high- and low-intensity granules. We note that the difference in the intensity between the two types of granules is ∼10-fold (see Table 1), and the distinction between them was quite apparent. The ratio between the total number of granules in shmoo-proximal region and in shmoo-distal region is indicated. The ratio of distribution for high (top)- and low (bottom)-intensity granules was calculated for the indicated strains. No high-intensity granules were observed in the double deletion mutant strains. Error bars represent the standard deviation from three independent experiments. n = 100–125 cells in each sample. (D) The studied mutant strains are sterile. The mating assay was determined with the indicated mutant strains (yMC376; yMC524) or isogenic WT (yMC375; all are MATa), as was reported previously (Michaelis and Herskowitz, 1988). The tester strain was WT (MATα; yMC134; see Table 4). After 3 h of mating on rich nonselective plate (YPD), the cells were replica plated onto appropriate selectable plate and incubated for 3 d before the photo was taken. (E) edc3Δ (yMC429) cells are only partially sterile relatively to the edc3Δ lsm4ΔC strain. Semiquantitative mating assay was performed as in D except that 10-fold dilutions were spotted, as indicated.
Figure 7.
Figure 7.
The large granules of MFA2 mRNA dissociate rapidly in response to CHX. (A) Cells expressing MFA2-U1A (ySA20) and PGK1-UA1 mRNA (ySA32) detection system were treated with αF for 2 h. 100 µg/ml cycloheximide (CHX) was then added, and cells were inspected microscopically 10 or 30 min later (top). Bars, 5 µm. (B and C) The percentage of high- and low-intensity MFA2 or PGK1 mRNAs granules was determined at the indicated time points after CHX addition. The percentage is plotted relative to t = 0 (before CHX addition), which was arbitrarily defined as 100%. Error bars represent the standard deviation of three independent experiments.
Figure 8.
Figure 8.
Local translation of MFA2 mRNA in the vicinity of the high-intensity granule in the shmoo. (A–C) Mfa2p-mCh protein colocalizes with its mRNA in the shmoo tip after αF treatment. WT yeast cells cotransformed with MFA2p-mCh-UA1 and UA1p-GFP (ySA147) were grown to early logarithmic phase and treated with αF for 2 h. The upper cell was photobleached, and fluorescence recovery was monitored by time-lapse microscopy. (A) Representative images from the time-lapse video before photobleaching; bar, 5 µm. The arrows point at high-intensity MFA2 mRNA granules (green)/protein (red) accumulated in the shmoo tip. (B) Immediately after photobleaching. (C) 10 min after recovery.
Figure 9.
Figure 9.
A model of local translation of MFA2 mRNA in the shmoo tip of an αF-treated cell. Shortly after αF treatment, low-intensity MFA2-containing granules begin to be transported to a region in the cell that is destined to form a shmoo (left cell). MFA2 mRNA in these granules might be partially translationally repressed (and its granules are relatively resistant to CHX—see the “low-intensity granules” in Fig. 7 B). Later, the shmoo begins to form, and several low-intensity granules are merged to form a high-intensity granule “mating body.” At the same time, an aF transporter, Ste6p, is transported to the shmoo tip (middle cell; see Discussion). MFA2 mRNA is released for translation in the vicinity of the mating body, and the peptide is processed and secreted by Ste6p in the shmoo tip (middle and right cells). The shmoo continues to grow until it is fused with the shmoo of the mating partner (not depicted). In our experiments, all cells were MATa, and no mating occurred. Therefore, at later time points (>2 h), the transport of low-intensity granules subsided, and the mating body gradually disassembled, in preparation for later cell division (not depicted).

References

    1. Anderson P., and Kedersha N.. 2009. RNA granules: post-transcriptional and epigenetic modulators of gene expression. Nat. Rev. Mol. Cell Biol. 10:430–436. 10.1038/nrm2694 - DOI - PubMed
    1. Aronov S., Gelin-Licht R., Zipor G., Haim L., Safran E., and Gerst J.E.. 2007. mRNAs encoding polarity and exocytosis factors are cotransported with the cortical endoplasmic reticulum to the incipient bud in Saccharomyces cerevisiae. Mol. Cell. Biol. 27:3441–3455. 10.1128/MCB.01643-06 - DOI - PMC - PubMed
    1. Bardwell L. 2005. A walk-through of the yeast mating pheromone response pathway. Peptides. 26:339–350. 10.1016/j.peptides.2004.10.002 - DOI - PMC - PubMed
    1. Beach D.L., Salmon E.D., and Bloom K.. 1999. Localization and anchoring of mRNA in budding yeast. Curr. Biol. 9:569–578. 10.1016/S0960-9822(99)80260-7 - DOI - PubMed
    1. Brengues M., and Parker R.. 2007. Accumulation of polyadenylated mRNA, Pab1p, eIF4E, and eIF4G with P-bodies in Saccharomyces cerevisiae. Mol. Biol. Cell. 18:2592–2602. 10.1091/mbc.E06-12-1149 - DOI - PMC - PubMed

Publication types

MeSH terms

LinkOut - more resources