. 2015 Jun 22;209(6):863-78.
doi: 10.1083/jcb.201502088.

Binding of STIL to Plk4 activates kinase activity to promote centriole assembly

Affiliations

Binding of STIL to Plk4 activates kinase activity to promote centriole assembly

Tyler C Moyer et al. J Cell Biol. .

Abstract

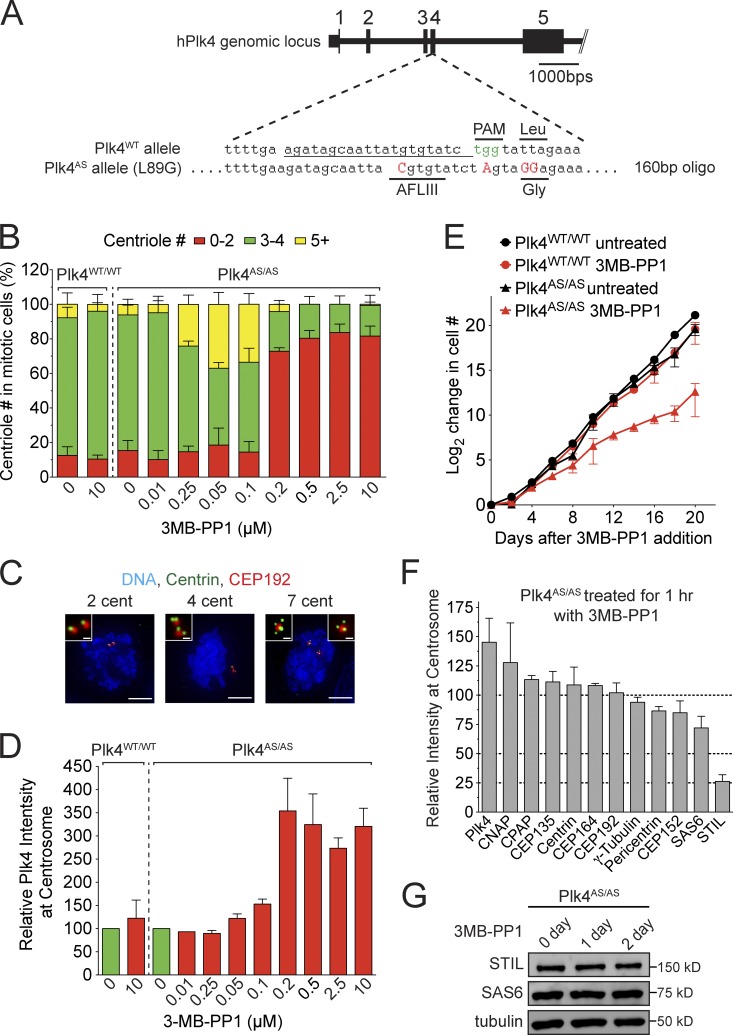
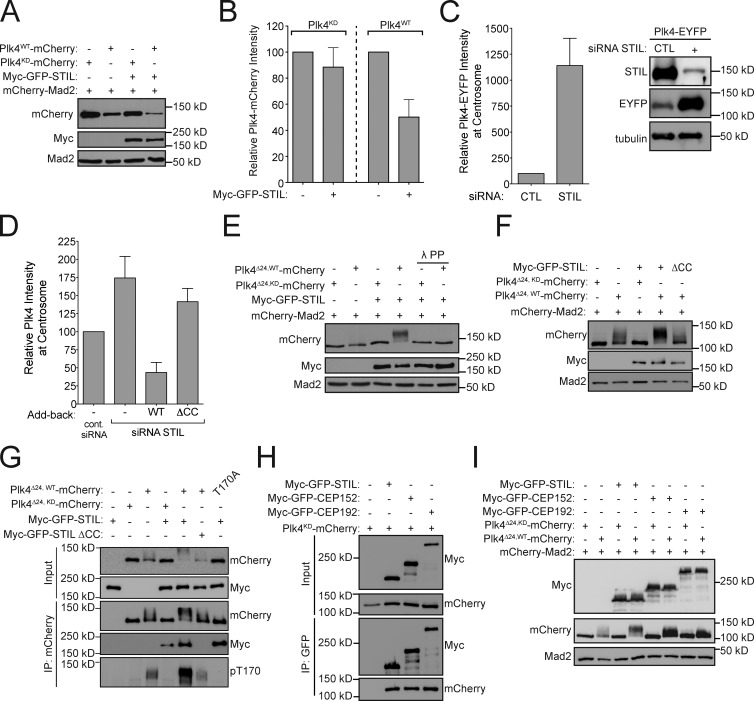
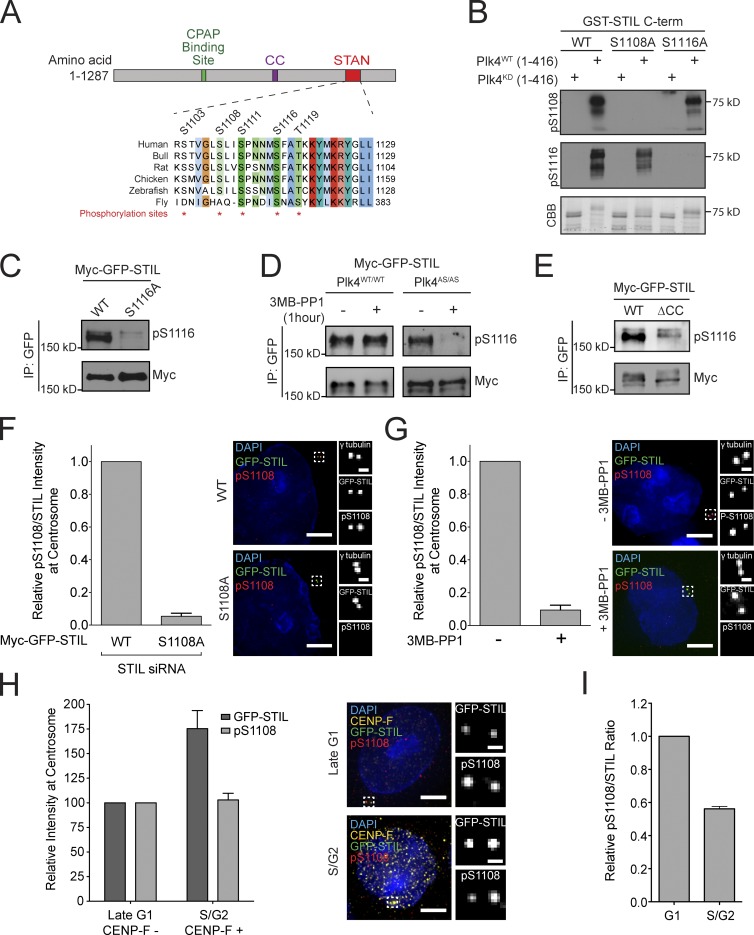
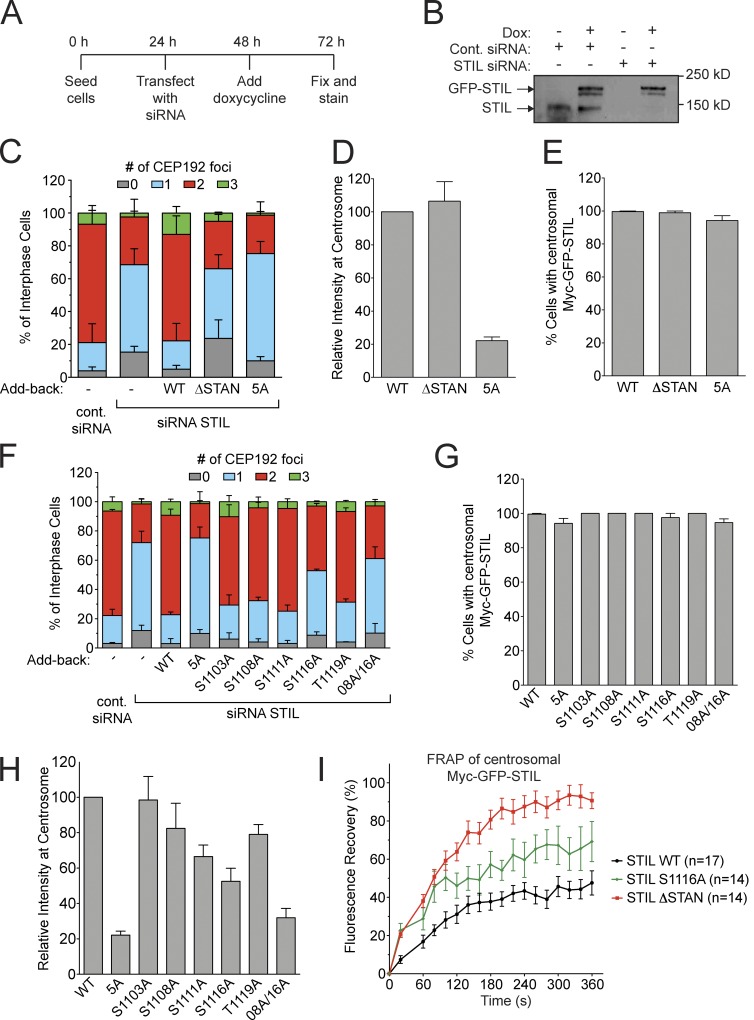
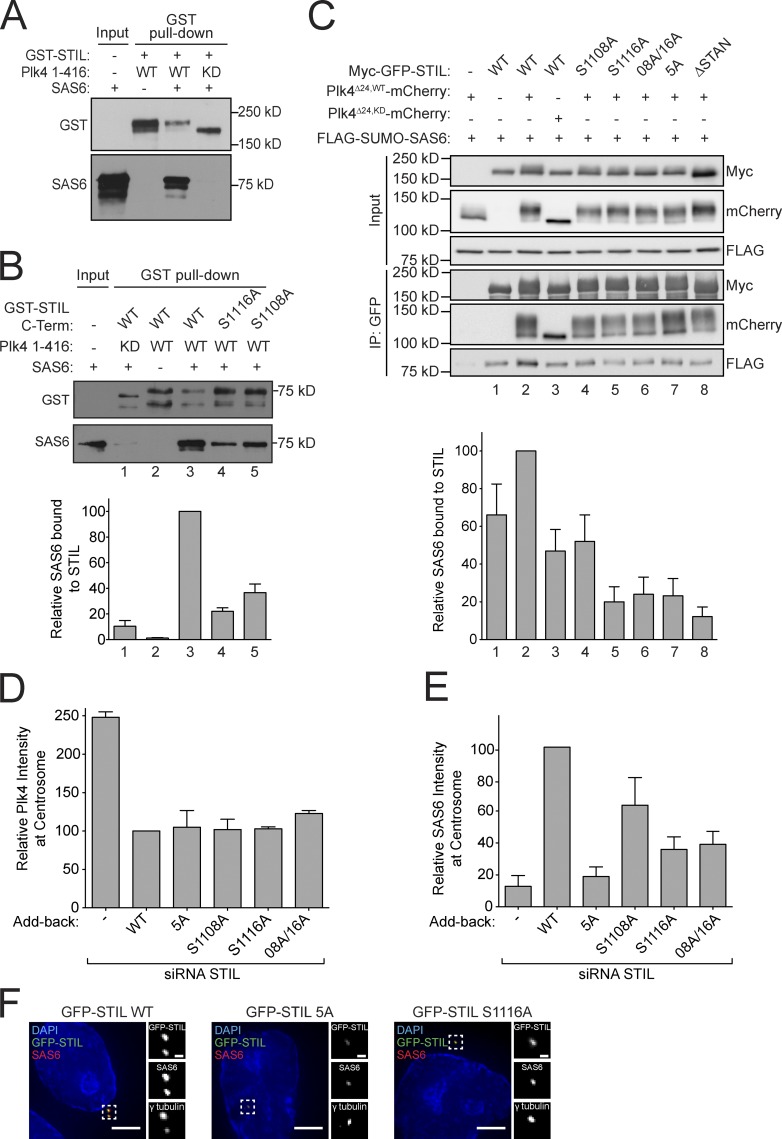
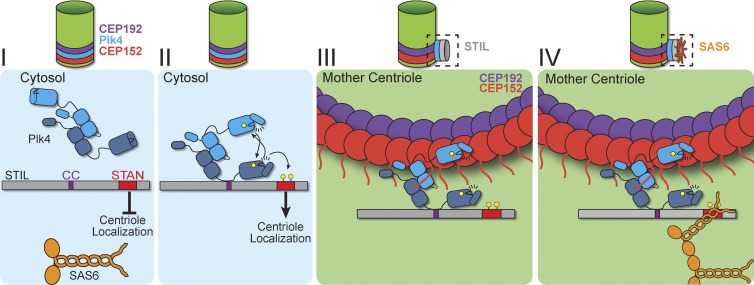
Centriole duplication occurs once per cell cycle in order to maintain control of centrosome number and ensure genome integrity. Polo-like kinase 4 (Plk4) is a master regulator of centriole biogenesis, but how its activity is regulated to control centriole assembly is unclear. Here we used gene editing in human cells to create a chemical genetic system in which endogenous Plk4 can be specifically inhibited using a cell-permeable ATP analogue. Using this system, we demonstrate that STIL localization to the centriole requires continued Plk4 activity. Most importantly, we show that direct binding of STIL activates Plk4 by promoting self-phosphorylation of the activation loop of the kinase. Plk4 subsequently phosphorylates STIL to promote centriole assembly in two steps. First, Plk4 activity promotes the recruitment of STIL to the centriole. Second, Plk4 primes the direct binding of STIL to the C terminus of SAS6. Our findings uncover a molecular basis for the timing of Plk4 activation through the cell cycle-regulated accumulation of STIL.


Figures

Figure 1.
Figure 1.
Plk4 kinase activity is required to maintain STIL at the centriole. (A) Schematic of the strategy used to knock-in the AS mutation into both alleles of Plk4 in human DLD-1 cells. The repair oligonucleotide introduced the AS mutation (L89G), a silent AflIII restriction site, and a mutation in the protospacer adjacent motif (PAM) to prevent recutting by SpCas9 after homology-directed repair. (B) Plk4WT/WT or Plk4AS/AS cells were treated with 3MB-PP1 for 20 h and nocodazole was added for the final 4 h of the treatment. The graph shows the fraction of mitotic cells with the indicated number of centrioles. Bars represent the mean of three independent experiments, with >20 cells counted per experiment. (C) Selected images of mitotic Plk4AS/AS cells from B stained with Centrin and CEP192. Bars: (large images) 5 µm; (inset images) 0.5 µm. (D) Quantification of the relative levels of Plk4 at the centrosome of interphase cells 20 h after addition of 3MB-PP1. Bars represent the mean of at least three independent experiments, with >40 cells counted per experiment. (E) Graph showing the increase in cell number at various times after addition of 3MB-PP1. Points show the mean of at least three independent experiments. (F) Quantification of relative protein abundance at the centrosome of S/G2 phase cells 1 h after the addition of 3MB-PP1. Bars represent the mean of three independent experiments, with >40 cells counted per experiment. (G) Immunoblot showing no change in the level of endogenous STIL and SAS6 at 1 or 2 d after Plk4 inhibition with 3MB-PP1. All error bars represent the SEM.
Figure 2.
Figure 2.
STIL binding stimulates Plk4 activity. (A) Cells were cotransfected with the indicated constructs and protein levels were analyzed by immunoblotting. mCherry-Mad2 serves as a transfection control. (B) Quantification of the protein levels shown in A. Bars represent the mean of three independent experiments. (C) STIL was depleted by siRNA and 24 h later doxycycline was added to induce expression of Plk4-EYFP. The immunoblot shows the relative levels of STIL and Plk4-EYFP in control or STIL siRNA–depleted cells. The graph shows quantification of the relative level of Plk4-EYFP at the centrosome of S/G2 phase cells. Bars represent the mean of at least three independent experiments, with >40 cells counted per experiment. (D) Endogenous STIL was depleted by siRNA and replaced with either Myc-GFP-STIL WT or ΔCC using the scheme outlined in Fig. 4 A. The graph shows quantification of the relative levels of Plk4 at the centrosome of S/G2 phase cells. Bars represent the mean of at least three independent experiments, with >40 cells counted per experiment. (E and F) Cells were cotransfected with the indicated constructs, and protein levels were analyzed by immunoblotting. Where indicated, lambda protein phosphatase (λ PP) was incubated with the cell lysate for 60 min before immunoblotting. (G and H) Cells were cotransfected with the indicated constructs and subjected to coimmunoprecipitation analysis with the indicated antibodies. (I) Cells were cotransfected with the indicated constructs and protein levels were analyzed by immunoblotting. All error bars represent the SEM.
Figure 3.
Figure 3.
Plk4 phosphorylates the STIL SAN domain in vivo. (A) Schematic of STIL showing the CPAP binding domain, coiled-coil domain (CC), and the conserved STAN domain. Alignment shows the position of five amino acids in the STAN domain that are phosphorylated in vivo. (B) GST-STIL C-term (aa 898–1287) was phosphorylated in vitro with kinase-active or inactive His-Plk4 and analyzed by immunoblotting with the indicated antibodies. The Coomassie (CBB)-stained gel shows the purified protein. (C) Myc-GFP-STIL WT or S1116A were immunopurified from cells and analyzed by immunoblotting with the indicated antibodies. (D) Plk4WT/WT or Plk4AS/AS cells were treated with 3MB-PP1 for 1 h. Myc-GFP-STIL was then immunopurified from cells and analyzed by immunoblotting with the indicated antibodies. (E) Myc-GFP-STIL WT or ΔCC were immunopurified from cells and analyzed by immunoblotting with the indicated antibodies. (F, left) Endogenous STIL was replaced with either Myc-GFP-STIL WT or S1108A. The graph shows quantification of the relative levels of pS1108/STIL at the centrosome of S/G2 phase cells. Bars represent the mean of at least three independent experiments, with >40 cells counted per experiment. (F, right) Selected images of cells showing Myc-GFP-STIL and pS1108 staining. Bars: (left) 5 µm; (right) 0.5 µm. (G, left) Plk4AS/AS cells were treated with or without 3MB-PP1 for 1 h. The graph shows quantification of the relative levels of pS1108/STIL at the centrosome of S/G2 phase cells. Bars represent the mean of at least three independent experiments, with >40 cells counted per experiment. (G, right) Selected images of cells showing Myc-GFP-STIL and pS1108 staining. Bars: (left) 5 µm; (right) 0.5 µm. (H, left) Quantification showing the relative levels of Myc-GFP-STIL and pS1108 at the centrosome of G1 (CENP-F negative) and S/G2 (CENP-F positive) phase cells. Bars represent the mean of at least three independent experiments, with >40 cells counted per experiment. (H, right) Selected images of cells showing Myc-GFP-STIL and pS1108 staining. Bars: (left) 5 µm; (right) 0.5 µm. (I) Quantification showing the relative levels of pS1108/STIL at the centrosome of G1 or S/G2 phase cells. Ratio is calculated from the data shown in H. All error bars represent the SEM.
Figure 4.
Figure 4.
Phosphorylation of the STIL STAN domain is required for centriole duplication. (A) Outline of the experimental timeline for the STIL siRNA and add-back experiments. (B) Immunoblot showing the relative STIL expression level after replacement of endogenous STIL with a Myc-GFP-STIL WT transgene. (C) Quantification showing the number of CEP192 foci in cells in which endogenous STIL had been depleted and replaced with the indicated Myc-GFP-STIL transgene. Bars represent the mean of at least three independent experiments, with >100 cells counted per experiment. (D and E) Quantification from C showing the relative level of Myc-GFP-STIL at the centrosome of S/G2 phase cells (D) and the fraction of S/G2 phase cells with detectable Myc-GFP-STIL at the centrosome (E). Bars represent the mean of at least three independent experiments, with >40 cells counted per experiment. (F) Quantification showing the number of CEP192 foci in cells in which endogenous STIL had been depleted and replaced with the indicated Myc-GFP-STIL transgene. 08A/16A refers to a Myc-GFP-STIL S1108A/S1116A double mutant. Bars represent the mean of at least three independent experiments, with >100 cells counted per experiment. The Myc-GFP-STIL 5A mutant from C is shown alongside as a comparison. (G and H) Quantification from F showing the relative level of Myc-GFP-STIL at the centrosome of S/G2 phase cells (G) and the fraction of S/G2 phase cells with detectable cells Myc-GFP-STIL at the centrosome (H). Bars represent the mean of at least three independent experiments, with >40 cells counted per experiment. The Myc-GFP-STIL 5A mutant from D and E is shown alongside as a comparison. (I) Endogenous STIL was replaced with Myc-GFP-STIL WT, ΔSTAN, or S1116A. The graph shows the fluorescence recovery of centrosomal Myc-GFP-STIL after photobleaching. Points represent the mean of >10 cells from two independent experiments. All error bars represent the SEM.
Figure 5.
Figure 5.
STIL STAN domain phosphorylation is required for direct binding to SAS6. (A and B) GST-STIL or GST-STIL C-term (aa 898–1287) were phosphorylated in vitro with kinase-active or inactive His-Plk4 and incubated with SAS6. GST pull-downs were analyzed by immunoblotting with the indicated antibodies. The graph shows the quantification from B of the relative amount of SAS6 bound to GST-STIL C-term. Bars represent the mean of three independent experiments. (C, top) Cells were cotransfected and subject to coimmunoprecipitation analysis with the indicated antibodies. (C, bottom) Quantification of the relative amount of SAS6 bound to Myc-GFP-STIL. Bars represent the mean of three independent experiments. (D and E) Quantification showing the relative level of Plk4 or SAS6 at the centrosome of cells in which endogenous STIL had been depleted and replaced with the indicated Myc-GFP-STIL transgene. Bars represent the mean of at least three independent experiments, with >50 cells counted per experiment. (F) Selected images of cells showing Myc-GFP-STIL and SAS6 staining. Bars: (left) 5 µm; (right) 0.5 µm. All error bars represent the SEM.
Figure 6.
Figure 6.
A model for how Plk4 and STIL cooperate to promote centriole assembly. (I) We propose that cytoplasmic STIL exists in an autoinhibited conformation that prevents recruitment to the centriole. (II) Plk4 directly binds to STIL, and this binding leads to activation of kinase activity. Plk4 activation is driven by self-phosphorylation of the activation loop (Bettencourt-Dias, personal communication). Plk4 then directly phosphorylates two sites in the STAN domain of STIL. (III) Phosphorylation of these sites releases STIL autoinhibition to promote efficient centriole targeting. (IV) In a second step, STIL STAN domain phosphorylation promotes the binding of centriolar STIL to the C-term region of SAS6. We propose that binding of STIL to SAS6 triggers cartwheel assembly and the stable binding of STIL to the centriole.

References

    1. Arquint C., and Nigg E.A.. 2014. STIL microcephaly mutations interfere with APC/C-mediated degradation and cause centriole amplification. Curr. Biol. 24:351–360. 10.1016/j.cub.2013.12.016 - DOI - PubMed
    1. Arquint C., Sonnen K.F., Stierhof Y.D., and Nigg E.A.. 2012. Cell-cycle-regulated expression of STIL controls centriole number in human cells. J. Cell Sci. 125:1342–1352. 10.1242/jcs.099887 - DOI - PubMed
    1. Basto R., Brunk K., Vinadogrova T., Peel N., Franz A., Khodjakov A., and Raff J.W.. 2008. Centrosome amplification can initiate tumorigenesis in flies. Cell. 133:1032–1042. 10.1016/j.cell.2008.05.039 - DOI - PMC - PubMed
    1. Bazzi H., and Anderson K.V.. 2014. Acentriolar mitosis activates a p53-dependent apoptosis pathway in the mouse embryo. Proc. Natl. Acad. Sci. USA. 111:E1491–E1500. 10.1073/pnas.1400568111 - DOI - PMC - PubMed
    1. Castellanos E., Dominguez P., and Gonzalez C.. 2008. Centrosome dysfunction in Drosophila neural stem cells causes tumors that are not due to genome instability. Curr. Biol. 18:1209–1214. 10.1016/j.cub.2008.07.029 - DOI - PubMed

Publication types

MeSH terms

Substances