. 2015 Oct 30;43(19):e126.
doi: 10.1093/nar/gkv614. Epub 2015 Jun 22.

ECHO-liveFISH: in vivo RNA labeling reveals dynamic regulation of nuclear RNA foci in living tissues

Affiliations

ECHO-liveFISH: in vivo RNA labeling reveals dynamic regulation of nuclear RNA foci in living tissues

Ikumi Oomoto et al. Nucleic Acids Res. .

Abstract

Elucidating the dynamic organization of nuclear RNA foci is important for understanding and manipulating these functional sites of gene expression in both physiological and pathological states. However, such studies have been difficult to establish in vivo as a result of the absence of suitable RNA imaging methods. Here, we describe a high-resolution fluorescence RNA imaging method, ECHO-liveFISH, to label endogenous nuclear RNA in living mice and chicks. Upon in vivo electroporation, exciton-controlled sequence-specific oligonucleotide probes revealed focally concentrated endogenous 28S rRNA and U3 snoRNA at nucleoli and poly(A) RNA at nuclear speckles. Time-lapse imaging reveals steady-state stability of these RNA foci and dynamic dissipation of 28S rRNA concentrations upon polymerase I inhibition in native brain tissue. Confirming the validity of this technique in a physiological context, the in vivo RNA labeling did not interfere with the function of target RNA nor cause noticeable cytotoxicity or perturbation of cellular behavior.


Figures

Figure 1.
Figure 1.
Design, activation kinetics and transcript-specific labeling of ECHO probes. (A) Graphic illustration of hybridization-sensitive reversible fluorescence emission of ECHO probes (19). (B) Transcript-specific ECHO probes (black lines) generated against U3 snoRNA, 28S rRNA and poly(A) RNA (gray lines). Known functional motifs are labeled along the transcripts (masked areas). (C) Kinetics of hybridization-dependent fluorescence activation measured with stopped-flow technique. Left: fluorescence intensity of 50 nM probes (y) versus the lapsed time (s) after mixing with 1400 nM target oligonucleotides (x). Gray lines: 10 trials of measurements; green line: fitted curve (y = ceKx + A). Fluorescence activation occurs within tens of milliseconds in the presence of target oligonucleotides. Right,K-value plotted against the concentrations of target oligonucleotides. K = Kon[target oligo] + Koff, KD = Koff/Kon. (D) Left, Confocal images (LSM780) represent maximum intensity z-projections of HeLa cells overexpressing nuclear foci protein markers (red), probed by transcript-specific ECHO probes (green), and stained with DAPI (blue). Right, intensity plots for pixels along the straight lines drawn across individual HeLa cells. Peaks at the same line-scan position represent colocalization of protein markers and target transcripts at nuclear foci (shaded areas). A.U.: arbitrary units; Scale bars: 20 μm. DAPI: 405 nm excitation, 410–500nm detection; D514: 514 nm excitation, 517–552 nm detection; DsRed2: 561 nm excitation, 566–703 nm detection..0.132 μm x 0.132 μm pixel size; 5–50 μs pixel dwell times; 1.5 μm optical slices at 0.75 μm interval up to 3 μm depth.
Figure 2.
Figure 2.
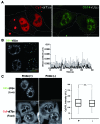
ECHO-liveFISH imaging of poly(A) RNA foci in living HeLa cells reveals immobility. (A) Fluorescence images of HeLa cells transfected with Cy5-d(T)30 or D514-(U)22. Speckled nuclear fluorescence was readily distinguished in the nuclei of D514-(U)22 transfected cells but not in the Cy5-d(T)30 transfected cells. (B) Time-lapse confocal poly(A) RNA images (LSM780) of HeLa cells transfected with D514-(U)22 (also see Supplementary Video 1). The track-line presentations monitor the center position of individual speckles over time (progressing from blue to red). Diffusion coefficient of each poly(A) speckle was plotted over time. (C) Poly(A) RNA staining in HeLa cells after ECHO-liveFISH imaging. Top, D514-(U)22 fluorescence in transfected and mock-transfected cells. Bottom, after imaging with D514-(U)22, cells were fixed, permeabilized and hybridized with Cy5-d(T)30 probes followed by Cy5 fluorescence imaging. Quantification of mean Cy5 fluorescence intensity at individual speckles (MFI) indicated comparable endogenous poly(A) concentrations at nuclear foci in D514-(U)22-transfected and mock-transfected cells. Scale bars: 20 μm. D514: 514 nm excitation, 517–597 nm detection; Cy5: 633 nm excitation, 638–759 nm detection. 0.264 × 0.264 μm pixel size; 50 μs pixel dwell time.
Figure 3.
Figure 3.
ECHO-liveFISH imaging did not alter the expression level or the function of the target RNA. (A) Total RNA was isolated from transfected HeLa cells and specific target RNAs were quantified with RT-qPCR. The graphs show the expression levels of U3 snoRNA, 28S rRNA, 18S rRNA and GAPDH (normalized to ‘D514-random’-transfected cells). Note that no significant difference was induced by transfection of target-specific ECHO probes (one-way ANOVA). (B) Estimation of global translational activities in the probe-transfected HeLa cells with puromycin pulse-labeling and immunoblotting (27). Immunodensitometry in each individual lane was analyzed and normalized to that of the ‘D514-random’ lane. CHX, cycloheximide, a translational inhibitor. (C) Left, Confocal images (FV1000) of ECHO probe-transfected HeLa cells immunostained with a puromycin-specific antibody (magenta) and DAPI (cyan). Cellular distribution of newly synthesized proteins was unaffected among cell groups. Right, Quantification of mean fluorescence staining intensity (MFI) of puromycin showed undetectable changes in the gross translational activity among cell groups. A.U.: arbitrary units. Scale bar: 20 μm. DAPI: 405 nm excitation, 425–475 nm detection; Alexa 633: 635 nm excitation, 650–750 nm detection; 0.165 × 0.165 μm pixel size; 20 μs pixel dwell times.
Figure 4.
Figure 4.
In vivo labeling of target RNAs in mouse brains. (A) Illustration of the in vivo electroporation procedure for delivering ECHO probes into the cerebellum of an anesthetized mouse. Green dots: probe injection sites (500 μm in depth from the surface). (B) Dorsal fluorescence view of P7 mice brains electroporated with D514-d(T)12 (left), injected with D514-d(T)12 with no current delivery (middle), electroporated with a single-mismatched probe that contains cytidine in place of the central thymidine (right). White arrowheads are pointed to the injection sites. (C) Bright-field (C1) and fluorescence (C2) views in sagittally partitioned brain halves. cer, cerebellum; md, midbrain. (D) Confocal images (LSM780) of permeabilized cerebellar slices stained with DAPI (blue) after in vivo electroporation of ECHO probe (green). One out of every three cells in the affected regions contained D514 fluorescence, indicating that delivery efficiency is roughly 30%. DAPI: 405 nm excitation, 410–500 nm detection; D514: 514 nm excitation, 517–597 nm detection; 0.132 × 0.132 μm pixel size; 0.64 μs pixel dwell times. Image stacks of 1.36 μm optical slices at 0.68 μm interval up to 8.9 μm depth. (E) Acute cerebellar slices were prepared after in vivo electroporation and imaged using a standard confocal laser scanning setup (FV1000). Electroporation of oligonucleotide probes labeled with a conventional dye Cy5-d(T)30 showed high fluorescence background at both intracellular and extracellular locations (E1). No distinguishable intranuclear structures were resolved by Cy5-d(T)30 labeling (E2). In contrast, D514-(U)22 reveals robust fluorescence in nuclei with relatively low background (E3); At higher magnification, D514-(U)22 reveals readily distinguishable poly(A) nuclear speckles in individual cerebellar cells (E4). Scale bars: 5 mm (B), 1 mm (C), 20 μm (D, E1, 2), 5 μm (E3, 4). D514: 515 nm excitation, 530–575 nm detection; Cy5: 635 nm excitation, 655–755 nm detection;. 0.207× 0.207 μm pixel size; 8 μs pixel dwell times.
Figure 5.
Figure 5.
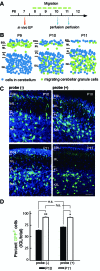
In vivo labeling with ECHO probes in cerebellar granule cells did not perturb their migration behavior. (A) Experimental scheme to test the potential effect of in vivo probe labeling on cerebellar cell migration. CAG-GFP plasmids were electroporated with or without D514-U3 into P7 mouse cerebellum (in vivo EP). The animals were then perfused at P10 and P11 with paraformaldehyde and cerebellar cell migration was assessed thereafter. (B) Graphic illustration of normal migration process of cerebellar granules cells monitored with in vivo GFP electroporation.
Figure 6.
Figure 6.
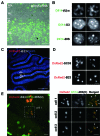
ECHO-liveFISH imaging of target RNA intranuclear foci in acute mouse brain tissues. (A) A representative confocal image from acute cerebellar slices prepared soon after in vivo electroporation. (B) Confocal images (FV1000) of poly(A), U3 snoRNA and 28S rRNA in individual cerebellar granule cells after electroporation. Intranuclear foci containing target RNA concentrations are readily distinguished. The number and shape are consistent with foci of nuclear speckles and nucleoli. (C) A confocal image of a DsRed2-B23 electroporated mouse cerebellum stained with a DsRed2-specific antibody (red) and DAPI (blue). (D) High magnification confocal images of DsRed2-SC35 and DsRed2-B23 in individual nuclei. Note the irregular shapes of DsRed2-SC35 speckles and round-shaped DsRed2-B23 foci. (E) Colocalization between DsRed2-B23 and D514-28S at the nucleoli of electroporated granule neurons. P10 mice expressing DsRed2-B23 DNA plasmids were perfused and cerebellar slices were processed for DsRed2 and DAPI staining simultaneously with D514-28S hybridization. Overlapping DsRed2 and D514 fluorescence at nuclear foci indicates colocalization between B23 proteins and 28S rRNA (white arrowheads). EGL: external granule layer, ML: molecular layer, PL: Purkinje layer, IGL: inner granule layer. Scale bars: 20 μm (A), 2.5 μm (B, C2, D) and 1 mm (C1). DAPI: 405 nm excitation, 425–475 nm detection; D514: 515 nm excitation, 530–575 nm detection; DsRed2: 561 nm excitation, 566–703 nm detection. 0.207 × 0.207 μm pixel size; 8 μs pixel dwell times.
Figure 7.
Figure 7.
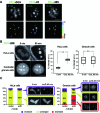
ECHO-liveFISH reveals differential dynamic regulation of RNA foci in ‘in vivo’ and ‘in vitro’ cells. (A) Time-lapse confocal imaging (FV1000) of poly(A), U3 snoRNA and 28S rRNA foci in cerebellar granule cells. Top, a snapshot of nuclear foci imaged in acute cerebellar slices after in vivo electroporation. Bottom, Track-line presentations of individual fluorescent foci over time (progressing from blue to red). (B) HeLa cells and cerebellar granules cells were treated with Oxaliplatin (Oxa, 100 μM) for 1 h and 28S rRNA nuclear foci were imaged with D514-28S. Left, Confocal images of D514-28S foci in HeLa cells and in cerebellar granule cells before and after Oxa treatment. Condensed 28S rRNA foci fluorescence upon Oxa treatment was observed in HeLa cells but not in cerebellar granule cells. Right, Quantification of mean D514 fluorescence intensity at individual foci (MFI) in HeLa cells and granule cells. Fluorescence intensity increased by two folds in HeLa cells after 1 h Oxa treatment, whereas that in granule cells it was unaffected. **P < 0.001. n.s.: not significant. (C) Population distributions of HeLa cells and cerebellar cells with increased (purple), unchanged (chartreuse) or decreased (red) numbers of 28S rRNA foci in response to 1 h actinomycin D treatment (actD, 100 nM; transcriptional inhibitor). Representative confocal images of each cell population before and after treatment are shown in pairs. Cerebellar granule cells showed higher response heterogeneity than HeLa cells. A significantly increased portion of cerebellar cells showed decreased number of 28S rRNA foci to less than half, indicating dissipation. Scale bars: 2.5 μm. D514: 515 nm excitation, 500–600 nm detection; 0.207 × 0.207 μm pixel size; 8 μs pixel dwell times.
Figure 8.
Figure 8.
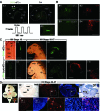
In vivo imaging of poly(A) RNA in living chick embryos. (A) Micrographs of the head region of a developing chick embryo after in ovo electroporation of D514-d(T)12. A1: fluorescence observed in the diencephalon region between the electrodes following electroporation; A2: low fluorescence background was observed when D514-d(T)12 was injected into the neural tube but no current pulses were applied; A3: dorsal view of the fluorescent region after the chick brain was dissected into phosphate saline buffer (PBS). (B) CAG-RFP was co-electroporated either with D514-random or with D514-d(T)12 into the diencephalon region. After 4 h to allow fluorescent protein expression, red fluorescence expressing cells also contained D514-d(T)12 activity, while almost no D514-random fluorescence was observed regardless of RFP expression. (C) Top row, bright field (C1, 3) and fluorescent views (C2, 4) of a developing chick embryo electroporated with D514-d(T)12 at HH stage 10, observed at HH stages 10 (C1, 2) and 16–17 (24 h later than HH stage 10; C3, 4). Bottom row, bright field (C7) and fluorescent views (C5, 6, 8–11) of a developing chick embryo electroporated with D514(cyt)-d(T)12 and CAG-RFP DNA plasmids at HH stage 10. C6, C8: D514 fluorescence; C6, C9, C11: RFP fluorescence. (D) Bright-field and fluorescent views of a developing chick embryo at HH stage 36–37, 240 h after electroporation. D1: ventral view of the chick embryo; the line indicates the position of the cryosection slice viewed in D2–10. D2: bright field; D3: RFP fluorescence (red); D4: DAPI (blue); D5: nissl staining (blue); D6–9: magnified images of the boxed areas in D3, D4; D10: an overlaid image of D8 and D9. tel: telenchephalon, di: diencephalon, mes: mesencephalon, is: isthmus, met: metencephalon, rho: rhombencephalon, e: eye, ov: otic vesicle, sm: somite, ht: heart. Scale bars: 500 μm (A1, B4, C1–9), 100 μm (A3, C10, 11, D6).

Similar articles

Cited by

References

    1. Carter K.C., Taneja K.L., Lawrence J.B. Discrete nuclear domains of poly(A) RNA and their relationship to the functional organization of the nucleus. J. Cell Biol. 1991;115:1191–1202. - PMC - PubMed
    1. Lewis J.D., Tollervey D. Like attracts like: getting RNA processing together in the nucleus. Science. 2000;288:1385–1389. - PubMed
    1. Cioce M., Lamond A.I. Cajal bodies: a long history of discovery. Annu. Rev. Cell Dev. Biol. 2005;21:105–131. - PubMed
    1. Gubitz A.K., Feng W., Dreyfuss G. The SMN complex. Exp. Cell Res. 2004;296:51–56. - PubMed
    1. Spector D.L., Lamond A.I. Nuclear speckles. Cold Spring Harb. Perspect. Biol. 2011;3 doi:10.1101/cshperspect.a000646. - PMC - PubMed

Publication types