. 2015 Jun 29;212(7):1095-108.
doi: 10.1084/jem.20142110. Epub 2015 Jun 22.

Identification of phenotypically and functionally heterogeneous mouse mucosal-associated invariant T cells using MR1 tetramers

Affiliations

Identification of phenotypically and functionally heterogeneous mouse mucosal-associated invariant T cells using MR1 tetramers

Azad Rahimpour et al. J Exp Med. .

Abstract

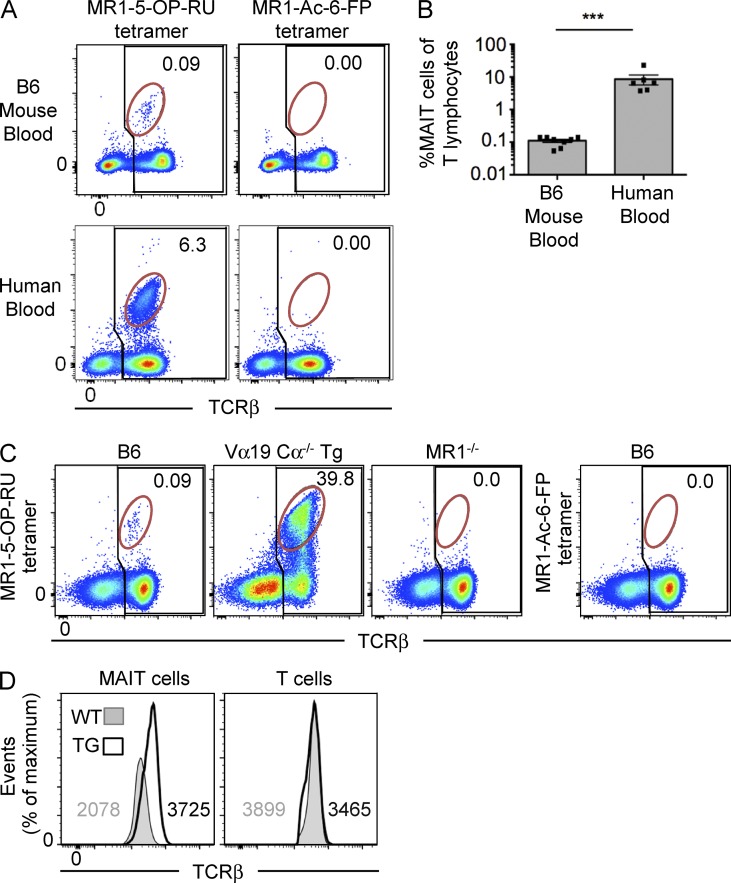
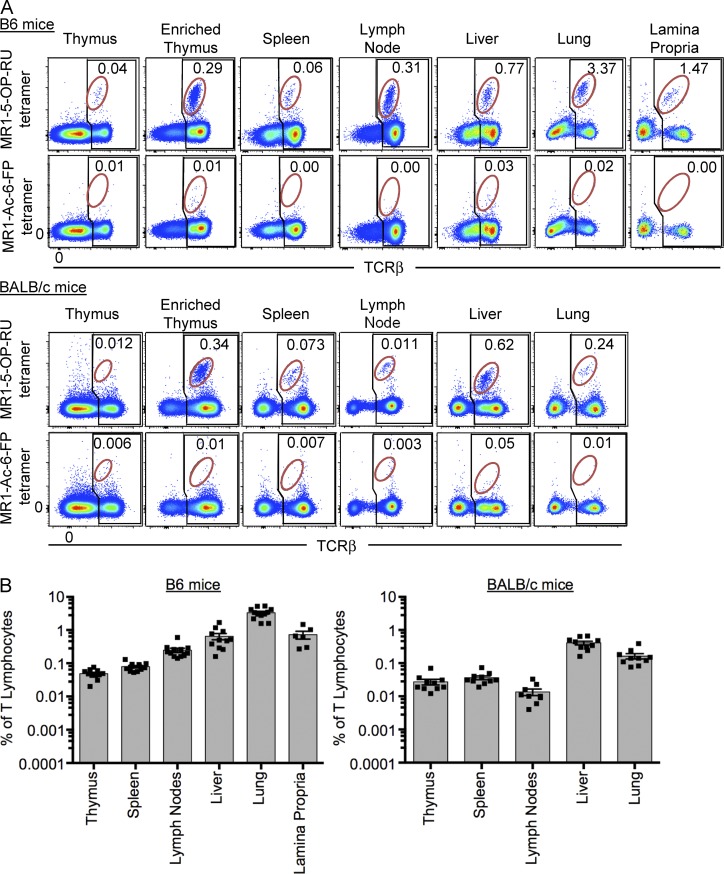
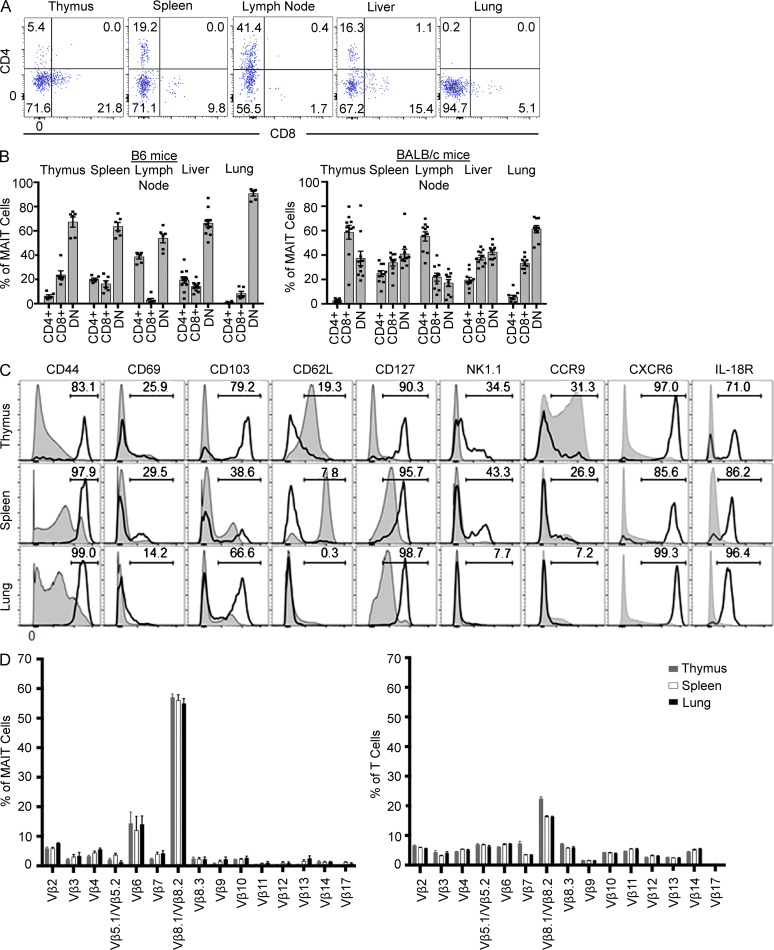
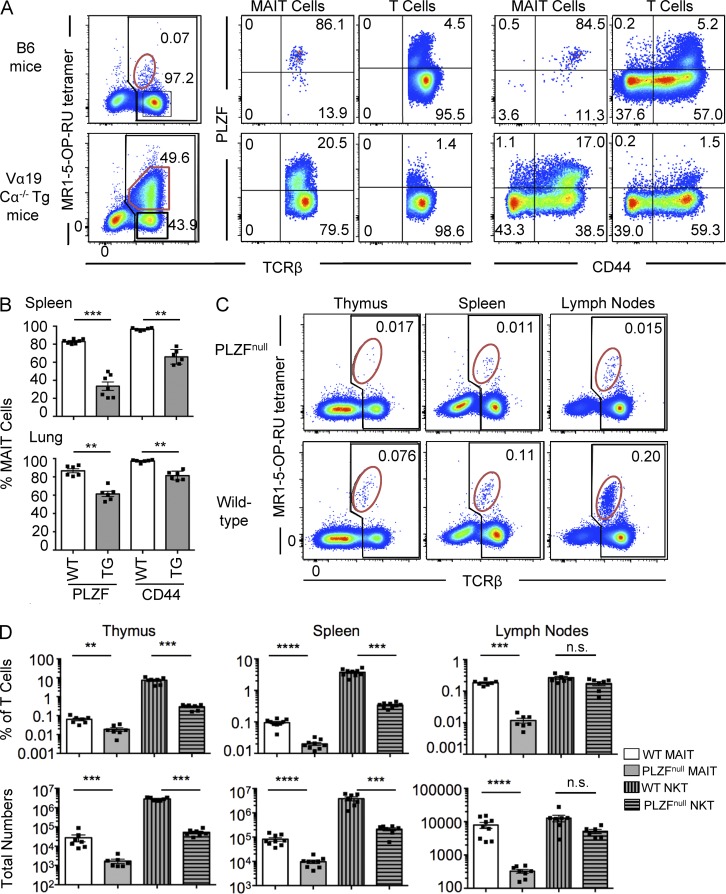
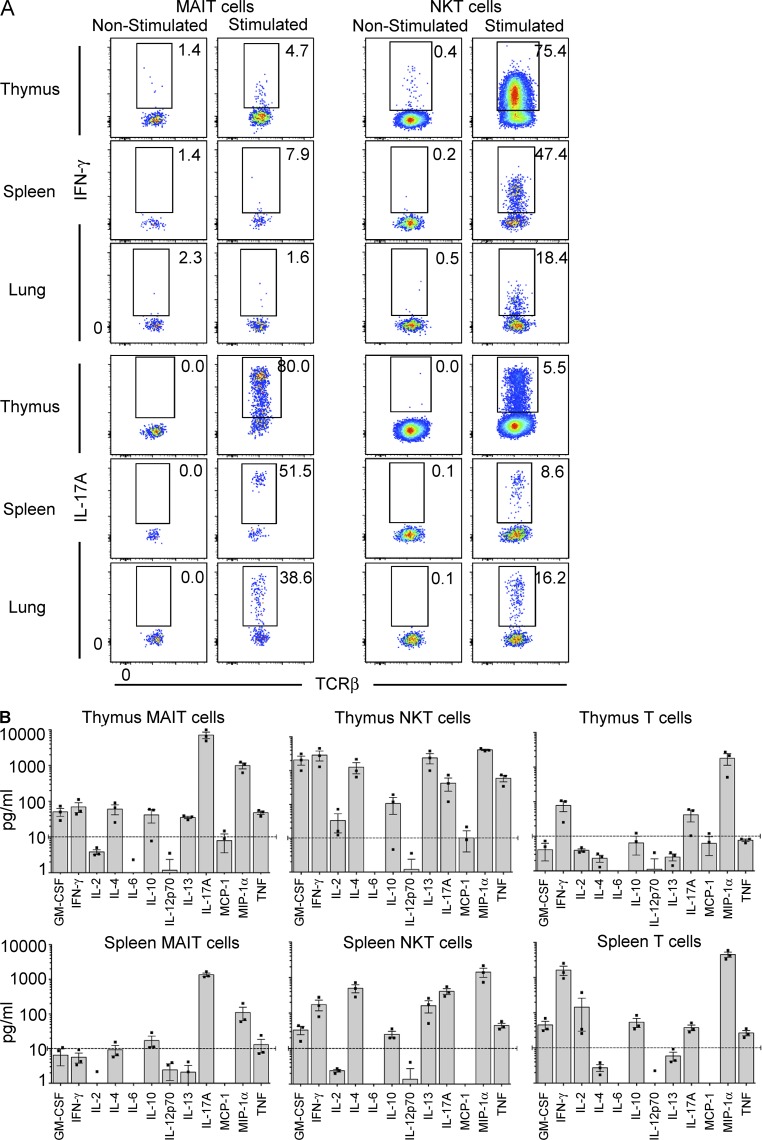
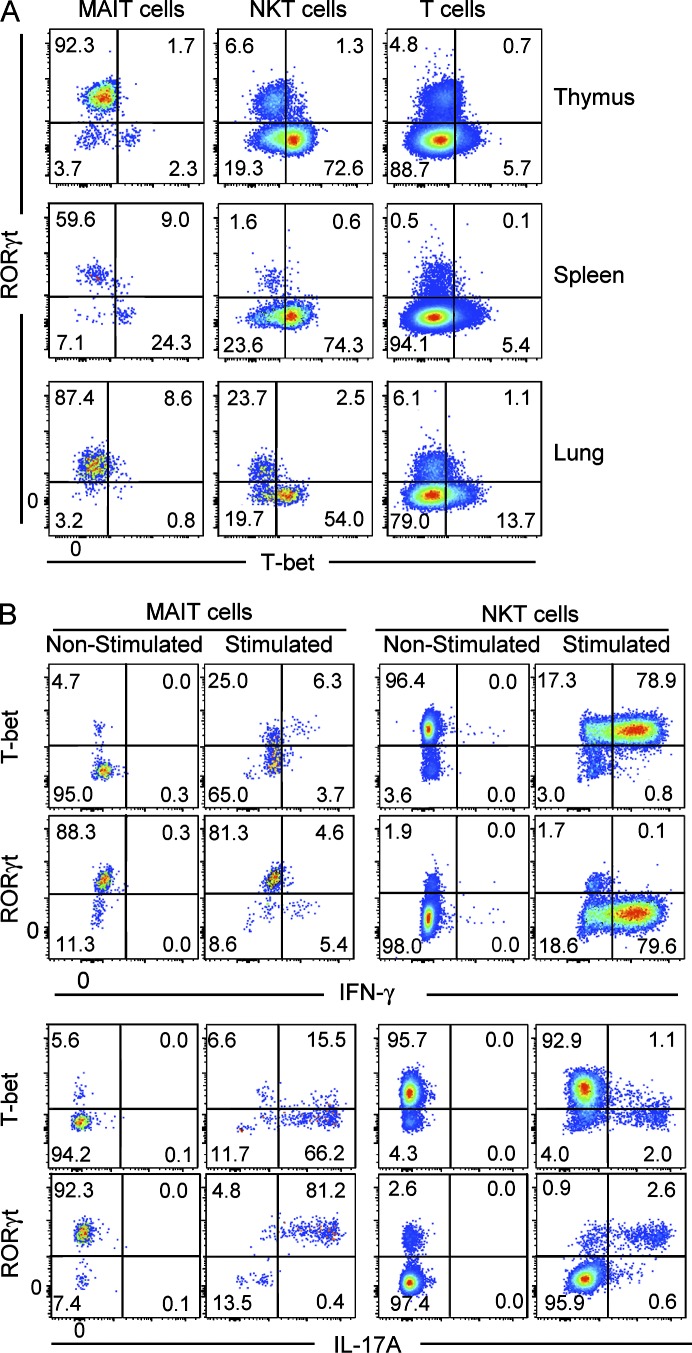
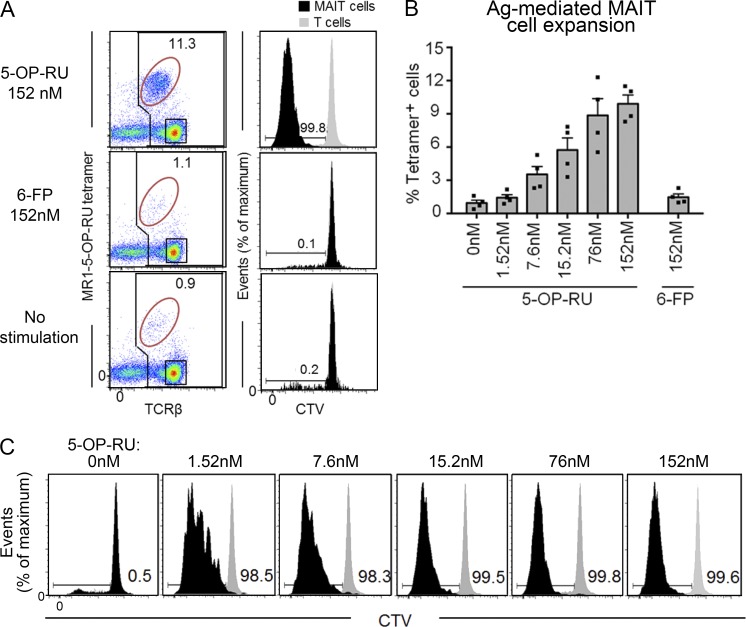
Studies on the biology of mucosal-associated invariant T cells (MAIT cells) in mice have been hampered by a lack of specific reagents. Using MR1-antigen (Ag) tetramers that specifically bind to the MR1-restricted MAIT T cell receptors (TCRs), we demonstrate that MAIT cells are detectable in a broad range of tissues in C57BL/6 and BALB/c mice. These cells include CD4(-)CD8(-), CD4(-)CD8(+), and CD4(+)CD8(-) subsets, and their frequency varies in a tissue- and strain-specific manner. Mouse MAIT cells have a CD44(hi)CD62L(lo) memory phenotype and produce high levels of IL-17A, whereas other cytokines, including IFN-γ, IL-4, IL-10, IL-13, and GM-CSF, are produced at low to moderate levels. Consistent with high IL-17A production, most MAIT cells express high levels of retinoic acid-related orphan receptor γt (RORγt), whereas RORγt(lo) MAIT cells predominantly express T-bet and produce IFN-γ. Most MAIT cells express the promyelocytic leukemia zinc finger (PLZF) transcription factor, and their development is largely PLZF dependent. These observations contrast with previous reports that MAIT cells from Vα19 TCR transgenic mice are PLZF(-) and express a naive CD44(lo) phenotype. Accordingly, MAIT cells from normal mice more closely resemble human MAIT cells than previously appreciated, and this provides the foundation for further investigations of these cells in health and disease.


Figures

Figure 1.
Figure 1.
Identification of MAIT cells using MR1 tetramer in mice. (A) Detection of MAIT cells reactive to MR1–5-OP-RU tetramer in human and mouse blood. Flow cytometry analysis of human and mouse blood showing reactivity to MR1–5-OP-RU tetramer (left) or MR1–Ac-6-FP tetramer (negative control; right). Numbers indicate the percentage of MAIT cells (red gate) of total αβ T cells (black gate). Data are representative of four separate experiments with a combined total of n = 6 human blood samples and 9 mouse blood samples. (B) Scatter plot depicts MAIT cells as a proportion of T lymphocytes in mouse and human blood, gated as shown in A. Bars depict mean ± SEM of n = 6 human blood samples and 9 mouse blood samples derived from four separate experiments. ***, P < 0.001 using a Mann-Whitney rank sum U test. (C) B6, Vα19 Cα−/− transgenic (Tg) MR1+, or B6-MR1−/− spleen cells were stained with MR1–5-OP-RU tetramer (left three plots) or MR1–Ac-6-FP tetramer (far right plot). Numbers indicate the percentage of MAIT cells (red gate) of total αβ T cells (black gate). Data are representative of two independent experiments with a combined total of four mice. (D) Intensity of TCR-β staining on WT and transgenic MAIT cells is depicted as histograms, representative of four independent experiments with a combined total of six mice. Numbers depict mean fluorescence intensity.
Figure 2.
Figure 2.
Tissue distribution of MAIT cells. (A) Flow cytometry analysis of naive mouse thymus, enriched thymus, spleen, lymph nodes (inguinal), liver, lung, and lamina propria, showing reactivity to MR1–5-OP-RU tetramer or MR1–Ac-6-FP tetramer. Plots depict lymphocytes with B220+ B cells excluded by electronic gating. B6 mice are depicted in the top group and BALB/c in the bottom group. Numbers indicate the percentage of MAIT cells (red gate) of total αβ T cells (black gate). (B) Scatter plots depict MAIT cells as a proportion of T lymphocytes in all tissues tested, gated as shown in A. Each symbol represents an individual mouse. Bars depict mean ± SEM, and data are derived from a minimum of three independent experiments for each strain, with a combined total of 6–12 mice per tissue.
Figure 3.
Figure 3.
Phenotypic diversity within mouse MAIT cells. (A) Flow cytometry analysis of CD4 and CD8 coreceptor expression on MAIT cells from thymus, spleen, lymph nodes (inguinal), liver, and lung from B6 mice. (B) CD4/CD8 coreceptor–defined subsets of MAIT cells as a proportion of total MAIT cells in each tissue, gated as shown in A. Each symbol represents an individual mouse. Bar graphs depict mean ± SEM. Data are derived from a minimum of three independent experiments for each strain, with a combined total of 6–10 mice per tissue. (C) Phenotypic analysis of MAIT cells (thick black lines) from thymus, spleen, and lung compared with other (MR1–5-OP-RU tetramer TCR-β+) T cells (shaded gray) depicted as histograms. Histograms for each marker, apart from CD218, show data concatenated from three separate mouse tissue samples from within one experiment and are representative of three similar experiments. Histograms for CD218 are representative of two experiments with four mice per experiment. (D) CD3+ and 5-OP-RU–reactive cells were stained for a panel of Vβ antibodies, and positive cells were plotted as a proportion of total MAIT cells. Bar graphs depict mean ± SEM from three independent experiments, each involving a pool of 10 mice.
Figure 4.
Figure 4.
MAIT cells express PLZF and are PLZF dependent. (A) MAIT cells from WT B6 mice (top row) and Vα19 TCR Tg Cα−/− mice (bottom row). Plots in first column depict lymphocytes with B220+ B cells excluded by electronic gating. Numbers indicate the percentage of MAIT cells (red gate) of total αβ T cells (black gate). MAIT cells and non-MAIT “T cells,” gated as shown in the first column, were examined for PLZF versus TCR-β (second and third columns) and PLZF versus CD44 (fourth and fifth columns) expression. Data are representative of four separate experiments with a combined total of six mice per group. (B) Scatter plots depict the percentage of PLZF+ and CD44+ MAIT cells from spleen and lung of WT and Vα19 TCR transgenic Cα−/− mice. Each symbol represents an individual mouse. Bars depict mean ± SEM from a total of six separate mice. (C) Presence of MAIT cells in thymus, spleen, and lymph nodes of B6 WT and PLZFnull mice. Plots depict lymphocytes with B220+ B cells excluded by electronic gating. Top row shows PLZFnull mice, and bottom row shows WT mice. Numbers indicate the percentage of MAIT cells (red gate) of total αβ T cells (black gate). Data are representative of three independent experiments with a combined total of six to seven mice per group. (D) Percentage (top row) and total numbers (bottom row) of MAIT and NKT cells (CD1d–α-GalCer tetramer+ T cells) of total lymphocytes in thymus, spleen, and lymph nodes. Each symbol represents a different mouse. Bars depict mean ± SEM. For C and D, data are representative of three independent experiments with a combined total of six to seven mice per group. **, P < 0.01; ***, P < 0.001; ****, P < 0.0001 using a Mann–Whitney rank sum U test.
Figure 5.
Figure 5.
Cytokine production by MAIT cells. (A) CD24-depleted mouse thymocytes were stimulated for 4 h in PMA/ionomycin, after which time the cells were labeled with MR1-Ag tetramer and then fixed and permeabilized before staining with anti–IFN-γ or IL-17A. Data are representative of three experiments with a combined total of six mice per group. (B) MAIT cells, NKT cells (CD1d–α-GalCer tetramer+ T cells), and conventional MR1 tetramer TCR-β+ T cells were sorted from WT spleen and thymus and then added at 10,000 cells/well and stimulated by plate-bound CD3 and CD28. Supernatants were harvested at 24 h, and cytokines were analyzed by CBA. Graphs depict the mean concentration of cytokines ± SEM from three independent experiments for thymus and spleen, each using MAIT cells pooled from 10 mice. Dashed lines are the cutoff at 10 pg/ml for clearly detectable cytokine production.
Figure 6.
Figure 6.
Most MAIT cells are RORγthi and produce IL-17A. (A) MAIT cells, NKT cells (CD1d–α-GalCer tetramer+), and conventional TCR-β+ T cells were labeled with antibodies specific for RORγt and T-bet. (B) Samples from thymus, spleen, and lung were stimulated for 4 h in vitro with PMA/ionomycin, and expression of RORγt and T-bet and production of IFN-γ and IL-17A by MAIT and NKT cells were analyzed by flow cytometry. Data are representative of four experiments, with a combined total of eight mice.
Figure 7.
Figure 7.
MAIT cells proliferate upon Ag stimulation in vitro. Splenocytes were labeled with CTV and cultured in the presence of 5-OP-RU, 6-FP, or no Ag. After 72 h, MAIT cell numbers and CTV dilution were measured by flow cytometry. (A) Left column shows representative flow cytometry profiles showing percentage of MAIT cells (MR1–5-OP-RU-tetramer+) of total T cells. Plots depict lymphocytes with B220+ B cells excluded by electronic gating. Right column shows MAIT cell and T cell proliferation based on decreased CTV dye dilution. Black histograms, MAIT cells; gray histograms, MR1 tetramer T cells. Data are representative of a minimum of two separate experiments with a combined total of four mice. (B) Bar graph depicts percentage of expanded MAIT cells, gated as shown in A (mean ± SEM) from two independent experiments and a combined total of four mice. (C) Representative flow cytometry profiles showing CTV dilution of MAIT cells at each Ag dose. Data are representative of a minimum of two separate experiments with a combined total of four mice. Black histograms, MAIT cells; gray histograms, MR1 tetramer T cells.

Similar articles

Cited by

References

    1. Birkinshaw R.W., Kjer-Nielsen L., Eckle S.B., McCluskey J., and Rossjohn J.. 2014. MAITs, MR1 and vitamin B metabolites. Curr. Opin. Immunol. 26:7–13. 10.1016/j.coi.2013.09.007 - DOI - PubMed
    1. Corbett A.J., Eckle S.B., Birkinshaw R.W., Liu L., Patel O., Mahony J., Chen Z., Reantragoon R., Meehan B., Cao H., et al. . 2014. T-cell activation by transitory neo-antigens derived from distinct microbial pathways. Nature. 509:361–365. 10.1038/nature13160 - DOI - PubMed
    1. Croxford J.L., Miyake S., Huang Y.Y., Shimamura M., and Yamamura T.. 2006. Invariant Vα19i T cells regulate autoimmune inflammation. Nat. Immunol. 7:987–994. 10.1038/ni1370 - DOI - PubMed
    1. Dash P., McClaren J.L., Oguin T.H. III, Rothwell W., Todd B., Morris M.Y., Becksfort J., Reynolds C., Brown S.A., Doherty P.C., and Thomas P.G.. 2011. Paired analysis of TCRα and TCRβ chains at the single-cell level in mice. J. Clin. Invest. 121:288–295. 10.1172/JCI44752 - DOI - PMC - PubMed
    1. Dusseaux M., Martin E., Serriari N., Péguillet I., Premel V., Louis D., Milder M., Le Bourhis L., Soudais C., Treiner E., and Lantz O.. 2011. Human MAIT cells are xenobiotic-resistant, tissue-targeted, CD161hi IL-17–secreting T cells. Blood. 117:1250–1259. 10.1182/blood-2010-08-303339 - DOI - PubMed

Publication types

MeSH terms

Substances