. 2015 Aug 1;195(3):1139-51.
doi: 10.4049/jimmunol.1500733. Epub 2015 Jun 22.

Definition of a Novel Pathway Centered on Lysophosphatidic Acid To Recruit Monocytes during the Resolution Phase of Tissue Inflammation

Affiliations

Definition of a Novel Pathway Centered on Lysophosphatidic Acid To Recruit Monocytes during the Resolution Phase of Tissue Inflammation

Simon McArthur et al. J Immunol. .

Abstract

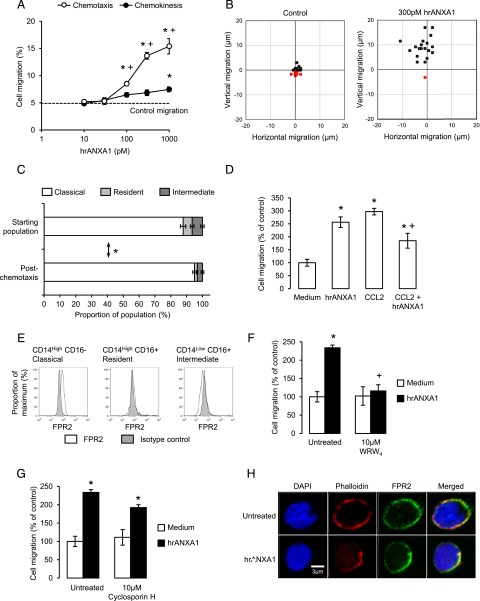
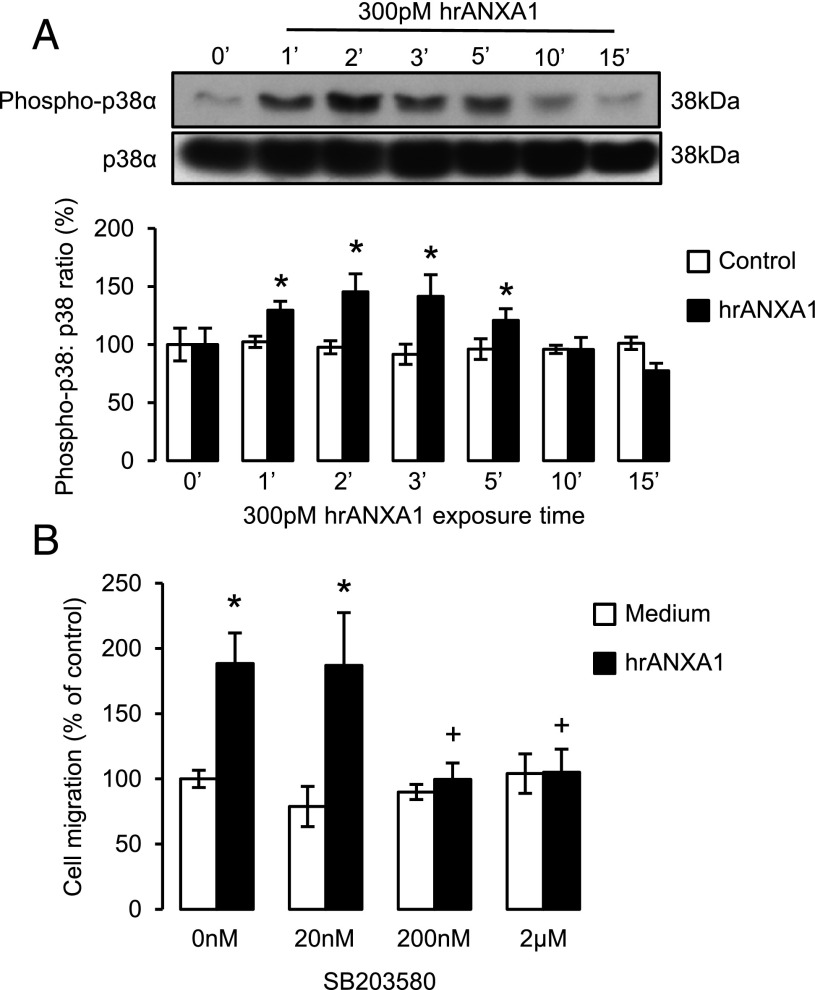
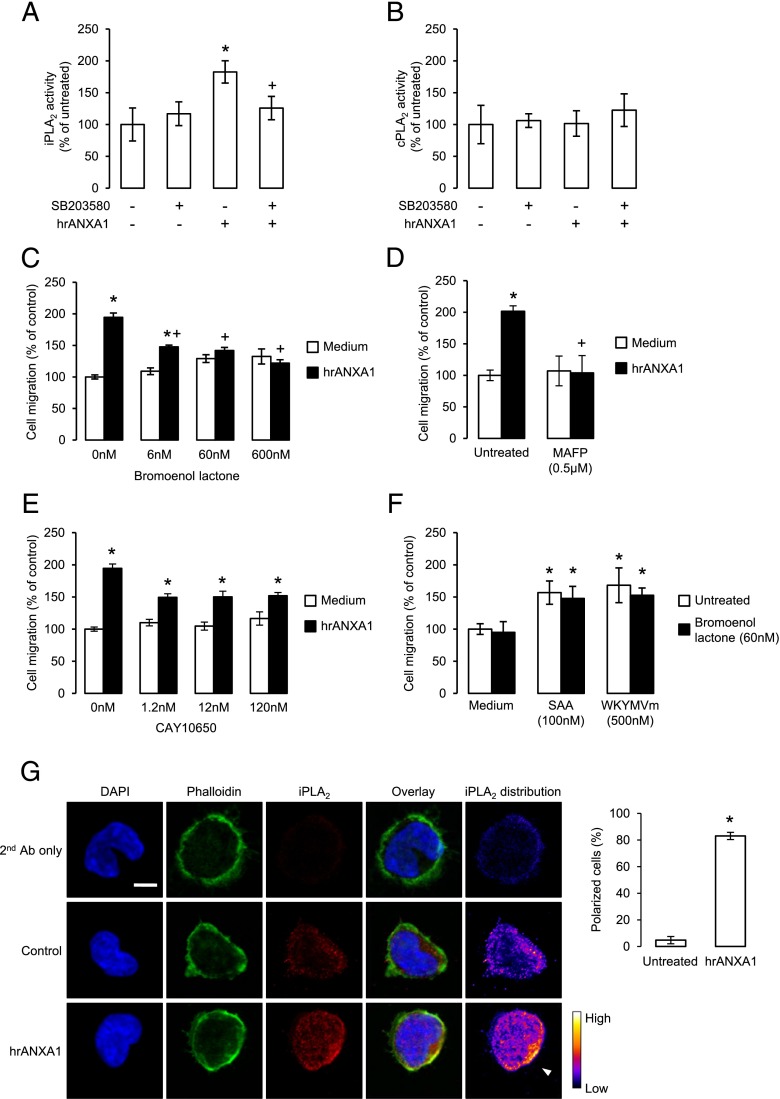
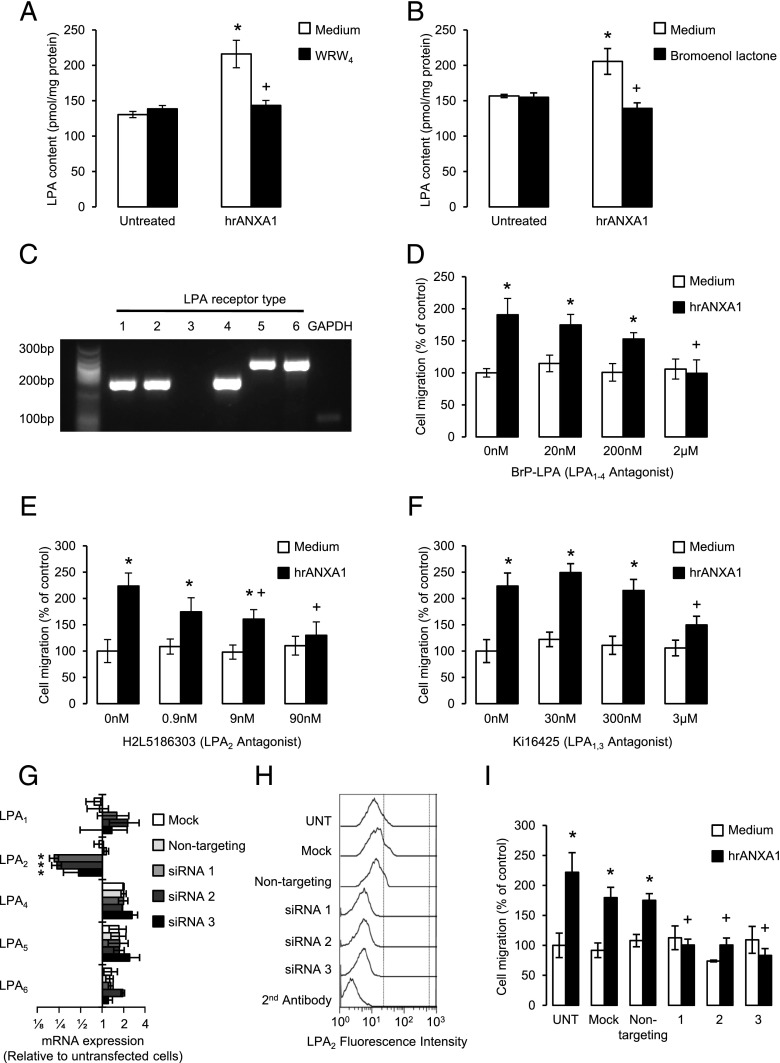
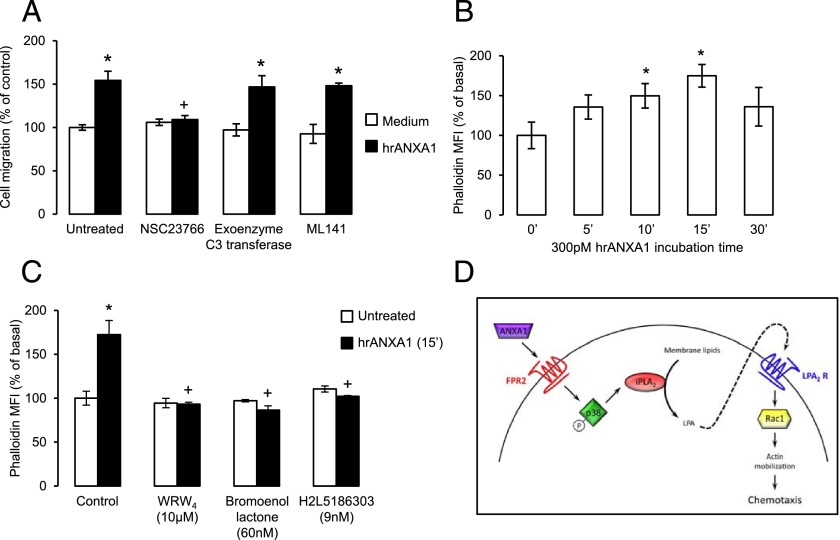
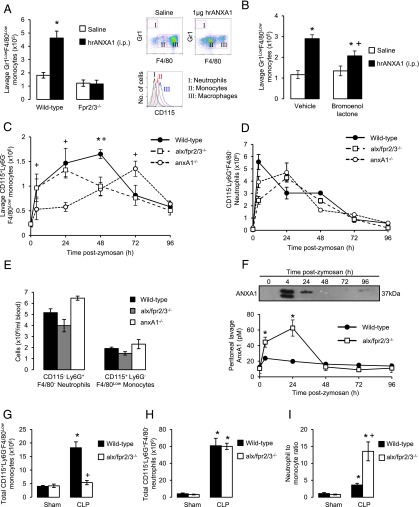
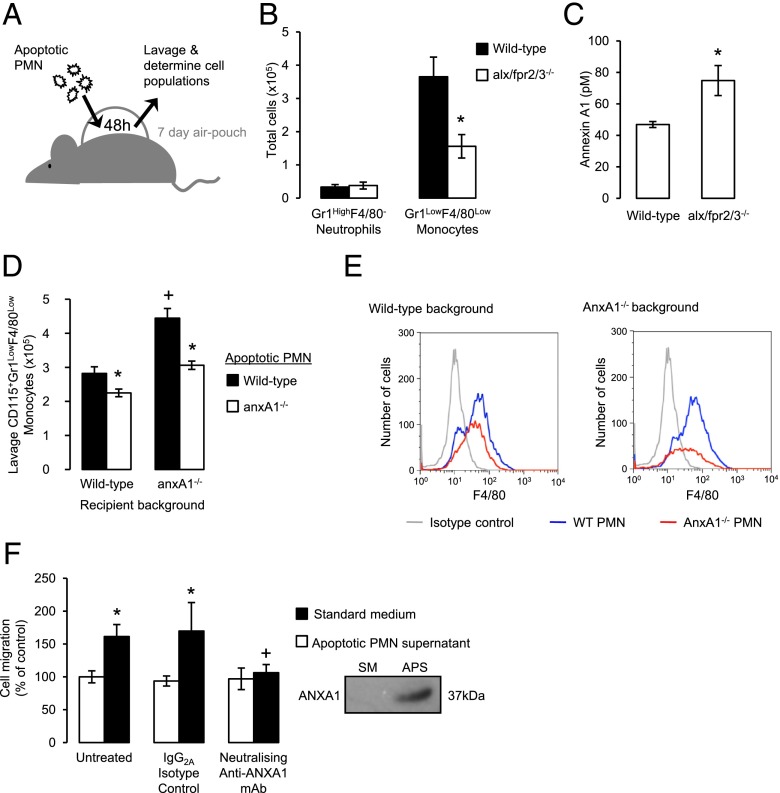
Blood-derived monocytes remove apoptotic cells and terminate inflammation in settings as diverse as atherosclerosis and Alzheimer's disease. They express high levels of the proresolving receptor ALX/FPR2, which is activated by the protein annexin A1 (ANXA1), found in high abundance in inflammatory exudates. Using primary human blood monocytes from healthy donors, we identified ANXA1 as a potent CD14(+)CD16(-) monocyte chemoattractant, acting via ALX/FPR2. Downstream signaling pathway analysis revealed the p38 MAPK-mediated activation of a calcium independent phospholipase A2 with resultant synthesis of lysophosphatidic acid (LPA) driving chemotaxis through LPA receptor 2 and actin cytoskeletal mobilization. In vivo experiments confirmed ANXA1 as an independent phospholipase A2-dependent monocyte recruiter; congruently, monocyte recruitment was significantly impaired during ongoing zymosan-induced inflammation in AnxA1(-/-) or alx/fpr2/3(-/-) mice. Using a dorsal air-pouch model, passive transfer of apoptotic neutrophils between AnxA1(-/-) and wild-type mice identified effete neutrophils as the primary source of soluble ANXA1 in inflammatory resolution. Together, these data elucidate a novel proresolving network centered on ANXA1 and LPA generation and identify previously unappreciated determinants of ANXA1 and ALX/FPR2 signaling in monocytes.


Figures

FIGURE 1.
FIGURE 1.
Annexin A1 is a potent chemoattractant of human classical monocytes in vitro, acting through ALX/FPR2. (A) Cumulative migration of human monocytes to hrANXA1 over a 90-min period, assessed using a 96-well Boyden chamber assay; data are mean ± SEM, and are representative of three independent donors. *p < 0.05 versus control migration, +p < 0.05 versus chemokinesis. (B) End-point migration of human monocytes embedded in 50% Matrigel after 30-min exposure to medium or an increasing gradient of hrANXA1 (maximum 300 pM). Black points represent net positive migration; red points represent net negative migration. Data are representative of three independent donors. (C) Human monocyte population subtypes prior to and after migration toward 300 pM hrANXA1; data are mean ± SEM of three independent donors. *p < 0.05 between classical monocyte fractions. (D) Chemotaxis of human monocytes toward 300 pM hrANXA1, 200 pM hrCCL2, or a mixture of 300 pM hrANXA1 and 200 pM hrCCL2; data are mean ± SEM of three independent donors. *p < 0.05 versus medium control, +p < 0.05 versus migration to hrCCL2 alone. (E) Surface expression of ALX/FPR2 by different human monocyte subtypes, defined by relative expression of CD14 and CD16; shaded histogram is IgG1 isotype control, clear histogram is FPR2, data are representative of three independent donors. (F) Chemotaxis of human monocytes toward 300 pM hrANXA1 with or without 10-min preincubation with the selective ALX/FPR2 antagonist WRW4 at 10 μM; data are mean ± SEM of three independent donors. *p < 0.05 versus medium control, +p < 0.05 versus hrANXA1 treatment alone. (G) Chemotaxis of human monocytes toward 300 pM hrANXA1 with or without 10-min preincubation with the selective FPR1 antagonist cyclosporin H at 10 μM; data are mean ± SEM of three independent donors. *p < 0.05 versus medium control. (H) Confocal microscopic analysis of ALX/FPR2 localization in human blood monocytes after exposure to a hrANXA1 gradient (maximum concentration 300 pM). Images are representative of cells from three independent donors. Scale bar, 3 μm.
FIGURE 2.
FIGURE 2.
Chemotaxis of monocytes toward hrANXA1 requires sequential activation of p38 MAPK and calcium iPLA2. (A) Representative Western blot analysis of phospho-p38α and total p38α following exposure of human monocytes for 0, 1, 2, 3, 5, 10, and 15 min to 300 pM hrANXA1. Densitometric analysis data are mean ± SEM of three independent donors. *p < 0.05 versus respective 0-min control. (B) Chemotaxis of human monocytes toward 300 pM hrANXA1 with or without 10-min preincubation with the p38 MAPK inhibitor SB203580; data are mean ± SEM of three independent donors. *p < 0.05 versus medium control, +p < 0.05 versus hrANXA1 treatment alone.
FIGURE 3.
FIGURE 3.
Chemotaxis of monocytes toward hrANXA1 requires activation of calcium iPLA2, but not cPLA2. (A) Human monocyte iPLA2 activity 30 min poststimulation with 300 pM hrANXA1, with or without 10-min pretreatment with the p38 MAPK inhibitor SB203580; data are mean ± SEM of four independent donors. *p < 0.05 versus untreated control, +p < 0.05 versus hrANXA1 treatment. (B) Human monocyte cPLA2 activity 30 min poststimulation with 300 pM hrANXA1, with or without 10-min pretreatment with the p38 MAPK inhibitor SB203580; data are mean ± SEM of four independent donors. (C) Chemotaxis of human monocytes toward 300 pM hrANXA1 with or without 10-min preincubation with the iPLA2 inhibitor bromoenol lactone; data are mean ± SEM of three independent donors. *p < 0.05 versus medium control, +p < 0.05 versus hrANXA1 treatment alone. (D) Chemotaxis of human monocytes toward 300 pM hrANXA1 with or without 10-min preincubation with the iPLA2 inhibitor methyl arachidonyl fluorophosphonate (MAFP); data are mean ± SEM of three independent donors. *p < 0.05 versus medium control, +p < 0.05 versus hrANXA1 treatment alone. (E) Chemotaxis of human monocytes toward 300 pM hrANXA1 with or without 10-min preincubation with the cPLA2 inhibitor CAY10650; data are mean ± SEM of three independent donors. *p < 0.05 versus medium control. (F) Chemotaxis of human monocytes toward standard culture medium, 100 nM serum amyloid A or 500 nM WKYMVm with or without 10-min preincubation with the iPLA2 inhibitor bromoenol lactone (60 nM); data are mean ± SEM of three independent donors. *p < 0.05 versus medium control. (G) Confocal microscopic analysis of iPLA2 localization in human monocytes exposed to a hrANXA1 gradient (maximum concentration 300 pM), showing DAPI nuclear counterstain (blue), phalloidin-identified filamentous β-actin (green), and iPLA2 (red); false color images represent the distribution of iPLA2 immunostaining throughout the cell. Arrowhead indicates point of polarization; images are representative of three independent donors. Scale bar, 5 μm. Graph represents the proportion of monocytes exhibiting polarized iPLA2 distribution upon exposure to hrANXA1; data are mean ± SEM of three independent donors. *p < 0.05 versus untreated control cells.
FIGURE 4.
FIGURE 4.
Chemotaxis of monocytes toward hrANXA1 is dependent upon production of LPA and consequent activation of the LPA2 receptor. (A) Analysis of human monocyte LPA content 30 min poststimulation with 300 pM hrANXA1 with or without pretreatment for 10 min with the selective ALX/FPR2 antagonist WRW4 at 10 μM; data are mean ± SEM of three independent donors. *p < 0.05 versus untreated controls, +p < 0.05 versus hrANXA1 treatment. (B) Analysis of human monocyte LPA content 30 min poststimulation with 300 pM hrANXA1 with or without pretreatment for 10 min with the iPLA2 inhibitor bromoenol lactone at 60 nM; data are mean ± SEM of three independent donors. *p < 0.05 versus untreated controls, +p < 0.05 versus hrANXA1 treatment. (C) RT-PCR analysis of LPA receptor gene expression in human monocytes alongside GAPDH positive control; image is representative of data from three independent donors. (D) Chemotaxis of human monocytes toward 300 pM hrANXA1 with or without 10-min preincubation with the pan-specific LPA1–4 receptor antagonist 1-bromo-3(S)-hydroxy-4-(palmitoyloxy)butyl phosphonate; data are mean ± SEM of three independent donors. *p < 0.05 versus medium control, +p < 0.05 versus hrANXA1 treatment alone. (E) Chemotaxis of human monocytes toward 300 pM hrANXA1 with or without 10-min preincubation with the specific LPA2 receptor antagonist H2L5186303; data are mean ± SEM of three independent donors. *p < 0.05 versus medium control, +p < 0.05 versus hrANXA1 treatment alone. (F) Chemotaxis of human monocytes toward 300 pM hrANXA1 with or without 10-min preincubation with the LPA1 and LPA3 receptor antagonist Ki16425; data are mean ± SEM of three independent donors. *p < 0.05 versus medium control, +p < 0.05 versus hrANXA1 treatment alone. (G) Expression of LPA1, LPA2, LPA4, LPA5, and LPA6 mRNA in human monocytes 48 h after mock transfection, or transfection with a nontargeting siRNA control sequence or one of three independent siRNA constructs specifically targeting LPA2, measured using the 2−ΔΔCt method and expressed as relative to untransfected cells; data are mean ± SEM of three independent donors. *p < 0.05 versus mock transfected by Kruskal–Wallis analysis. (H) Typical flow cytometry profiles of surface LPA2 receptor expression on untransfected human monocytes or 48 h after mock transfection, or transfection with a nontargeting siRNA control sequence or one of three independent siRNA constructs specifically targeting LPA2. (I) Chemotaxis toward 300 pM hrANXA1 of untransfected human monocytes or cells 48 h after mock transfection, or transfection with one of three siRNA constructs specifically targeting LPA2 or a nontargeting negative control siRNA; data are mean ± SEM of three independent donors. *p < 0.05 versus medium control, +p < 0.05 versus migration to hrANXA1 of nontargeting siRNA-transfected cells.
FIGURE 5.
FIGURE 5.
LPA signaling induces actin remodelling via activation of the small G protein Rac1. (A) Chemotaxis of human monocytes toward 300 pM hrANXA1 with or without 10-min preincubation with the specific Rac1 inhibitor NSC 23766 (100 μM) or the specific Rho inhibitor exoenzyme C3 transferase (1 μg/ml); data are mean ± SEM of three independent donors. *p < 0.05 versus medium control, +p < 0.05 versus hrANXA1 treatment alone. (B) Mean fluorescence intensity of phalloidin-AF488–stained human monocytes treated with 300 pM hrANXA1 for 0–30 min; data are mean ± SEM of three independent donors. *p < 0.05 versus untreated control cells. (C) Mean fluorescence intensity of phalloidin-AF488–stained human monocytes treated with 300 pM hrANXA1 for 15 min with or without preincubation for 10 min with the ALX/FPR2 antagonist WRW4 (10 μM), the iPLA2 inhibitor bromoenol lactone (60 nM), or the LPA2 antagonist H2L5186303 (9 nM); data are mean ± SEM of three independent donors. *p < 0.05 versus untreated control cells, +p < 0.05 versus cells treated with hrANXA1 alone. (D) Schematic representation of proposed mechanism by which ANXA1 induces monocyte chemotaxis.
FIGURE 6.
FIGURE 6.
ANXA1 recruits monocytes during inflammation in vivo through the mediation of iPLA2. (A) Peritoneal lavage monocytes 24 h after i.p. administration of 1 μg hrANXA1 or 100 μl saline to wild-type or alx/fpr2/3−/− mice. Inset, Typical flow cytometry profiles of 10,000 events from peritoneal lavages of wild-type mice treated with saline or hrANXA1; gated populations are I, neutrophils; II, monocytes; and III, macrophages. Data are mean ± SEM, n = 6. *p < 0.05 versus saline control. (B) Peritoneal lavage monocytes 24 h after i.p. administration of 1 μg hrANXA1 or 100 μl saline to wild-type mice with or without pretreatment with 6 mg/kg bromoenol lactone (2 injections, 24 h apart) or vehicle; data are mean ± SEM, n = 6. *p < 0.05 versus saline control, +p < 0.05 versus vehicle. (C) Peritoneal lavage monocytes 0, 4, 24, 48, 72, and 96 h after i.p. administration of 0.5 mg zymosan to wild-type (●), alx/fpr2/3−/− (☐), or AnxA1−/− (○) mice; data are mean ± SEM, n = 4. *p < 0.05 for wild-type versus alx/fpr2/3−/−, +p < 0.05 for wild-type versus AnxA1−/−. (D) Peritoneal lavage neutrophils 0, 4, 24, 48, 72, and 96 h after i.p. administration of 0.5 mg zymosan to wild-type (●), alx/fpr2/3−/− (☐), or AnxA1−/− (○) mice; data are mean ± SEM, n = 4. (E) Blood neutrophils and monocytes 48 h after i.p. administration of 0.5 mg zymosan to wild-type alx/fpr2/3−/− or AnxA1−/− mice; data are mean ± SEM, n = 4. (F) Peritoneal lavage AnxA1 content 0, 4, 24, 48, 72, and 96 h after i.p. administration of 0.5 mg zymosan to wild-type (●) and alx/fpr2/3−/− (☐) mice. Inset, Typical Western blot of lavage AnxA1 content 0, 4, 24, 48, 72, and 96 h after i.p. administration of 0.5 mg zymosan to wild-type mice. Data are mean ± SEM, n = 4. *p < 0.05 versus wild type. (G) Peritoneal lavage monocytes 24 h after cecal ligation and puncture of wild-type and alx/fpr2/3−/− mice; data are mean ± SEM, n = 7–8. *p < 0.05 versus sham control, +p < 0.05 versus wild type. (H) Peritoneal lavage neutrophils 24 h after cecal ligation and puncture of wild-type and alx/fpr2/3−/− mice; data are mean ± SEM, n = 7–8. *p < 0.05 versus sham control. (I) Peritoneal lavage neutrophil to monocyte ratio 24 h after cecal ligation and puncture of wild-type and alx/fpr2/3−/− mice; data are mean ± SEM, n = 7–8. *p < 0.05 versus sham control, +p < 0.05 versus wild type.
FIGURE 7.
FIGURE 7.
Apoptotic neutrophils are the principal source of AnxA1-inducing monocyte recruitment in vivo. (A) Schematic representation of design of air-pouch experiments. (B) Air-pouch lavage neutrophils and monocytes 48 h after the administration of 106 murine polymorphonuclear cells previously rendered apoptotic through overnight incubation with 1 μg/ml actinomycin D to wild-type or alx/fpr2/3−/− mice; data are mean ± SEM, n = 6. *p < 0.05 versus wild type. (C) Air-pouch lavage AnxA1 24 h after the administration of 106 apoptotic murine polymorphonuclear cells to wild-type or alx/fpr2/3−/− mice; data are mean ± SEM, n = 6. *p < 0.05 versus wild type. (D) Total lavage monocytes 24 h after administration of 106 apoptotic murine polymorphonuclear cells from wild-type or AnxA1−/− mice to air pouches borne by wild-type or AnxA1−/− mice; data are mean ± SEM, n = 6. *p < 0.05 versus animals of the same genotype administered wild-type polymorphonuclear cells, +p < 0.05 versus wild-type animals receiving wild-type polymorphonuclear cells. (E) Representative flow cytometry histograms showing recruitment of F4/80+ murine monocytes. (F) Chemotaxis of human monocytes toward cell-free supernatant from apoptotic polymorphonuclear cells, treated with either a neutralizing anti-ANXA1 mAb, or its IgG2A isotype control (50 ng/ml in both cases). Inset, Typical Western blot of ANXA1 content in standard medium (SM) or apoptotic polymorphonuclear cell supernatant (APS). Data are mean ± SEM of three independent donors. *p < 0.05 versus medium control, +p < 0.05 versus isotype control alone.

Similar articles

Cited by

References

    1. Couzin-Frankel J. 2010. Inflammation bares a dark side. Science 330: 1621. - PubMed
    1. Serhan C. N., Savill J. 2005. Resolution of inflammation: the beginning programs the end. Nat. Immunol. 6: 1191–1197. - PubMed
    1. Tabas I., Glass C. K. 2013. Anti-inflammatory therapy in chronic disease: challenges and opportunities. Science 339: 166–172. - PMC - PubMed
    1. Rossi A. G., Sawatzky D. A., Walker A., Ward C., Sheldrake T. A., Riley N. A., Caldicott A., Martinez-Losa M., Walker T. R., Duffin R., et al. 2006. Cyclin-dependent kinase inhibitors enhance the resolution of inflammation by promoting inflammatory cell apoptosis. Nat. Med. 12: 1056–1064. - PubMed
    1. Maslin C. L. V., Kedzierska K., Webster N. L., Muller W. A., Crowe S. M. 2005. Transendothelial migration of monocytes: the underlying molecular mechanisms and consequences of HIV-1 infection. Curr. HIV Res. 3: 303–317. - PubMed

Publication types

MeSH terms