. 2015:2015:865265.
doi: 10.1155/2015/865265. Epub 2015 May 25.

Inclusion of Neuropsychological Scores in Atrophy Models Improves Diagnostic Classification of Alzheimer's Disease and Mild Cognitive Impairment

Affiliations

Inclusion of Neuropsychological Scores in Atrophy Models Improves Diagnostic Classification of Alzheimer's Disease and Mild Cognitive Impairment

Mohammed Goryawala et al. Comput Intell Neurosci. 2015.

Abstract

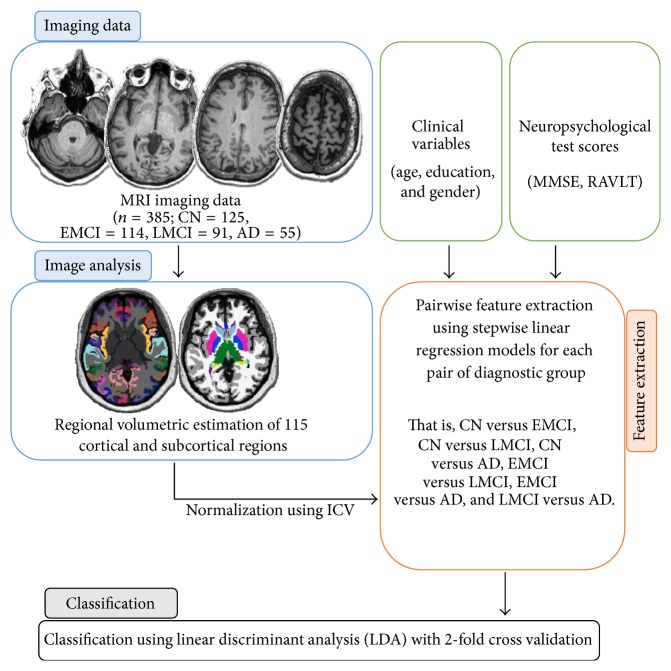
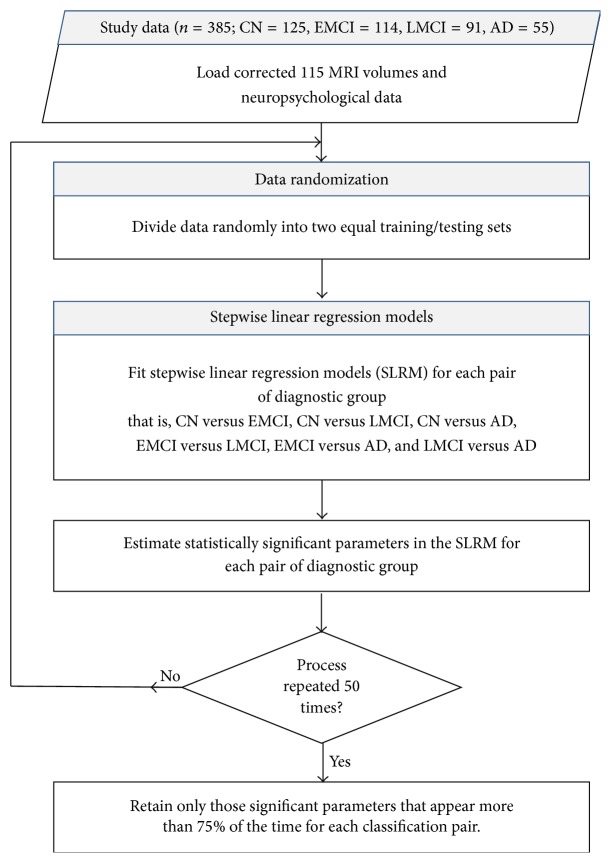
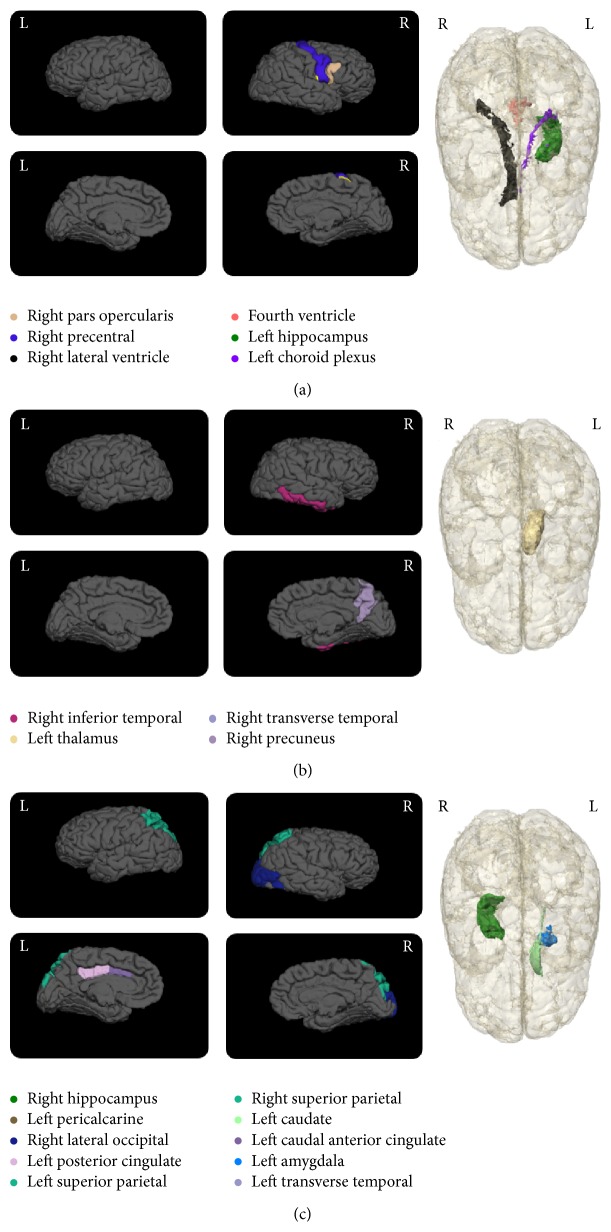
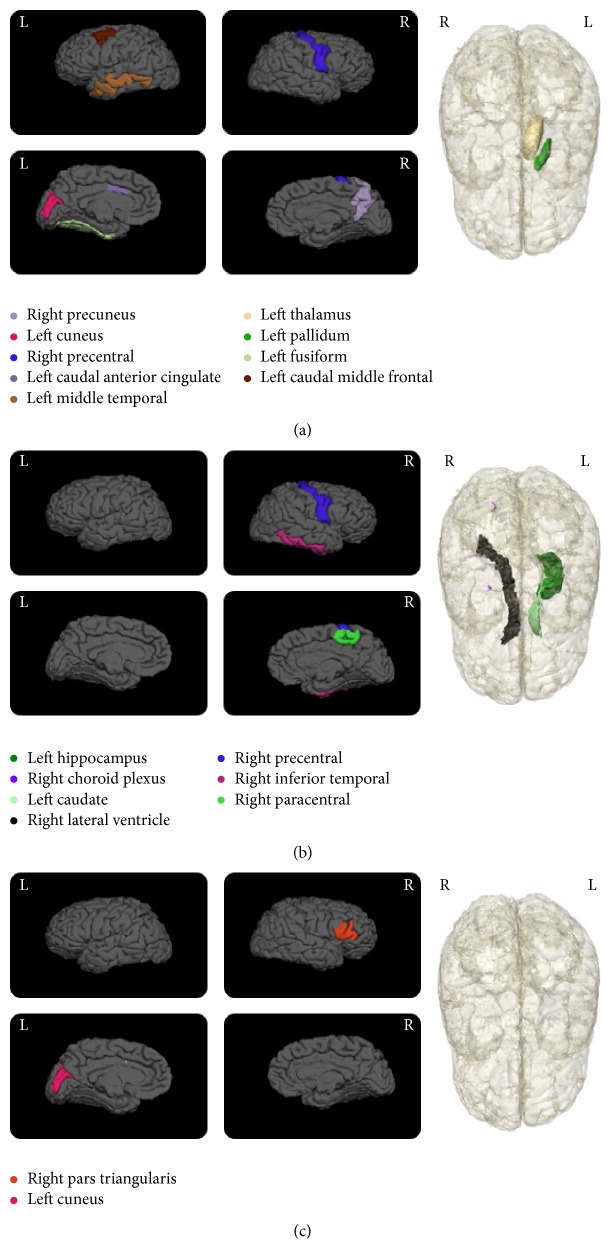
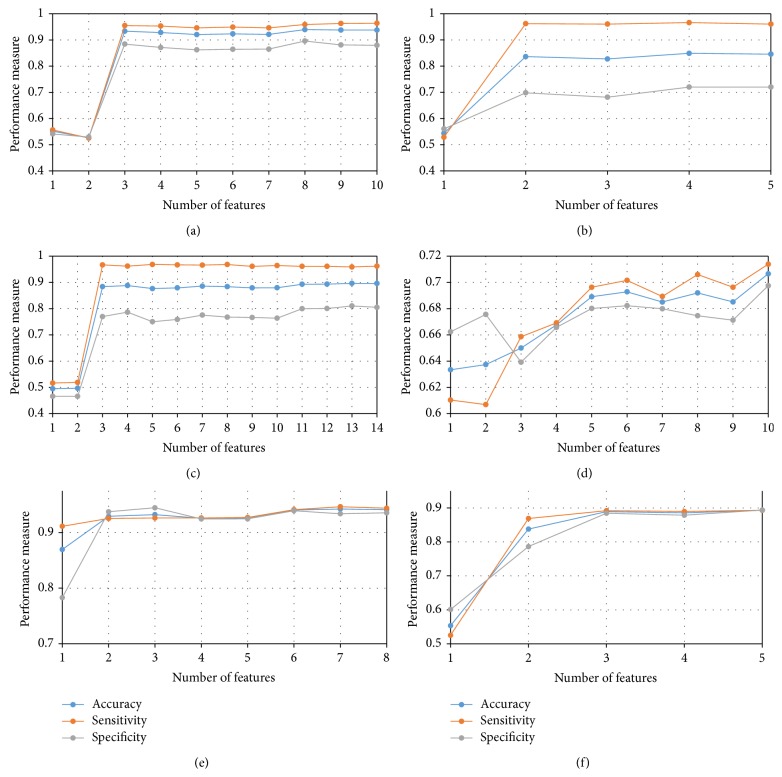
Brain atrophy in mild cognitive impairment (MCI) and Alzheimer's disease (AD) are difficult to demarcate to assess the progression of AD. This study presents a statistical framework on the basis of MRI volumes and neuropsychological scores. A feature selection technique using backward stepwise linear regression together with linear discriminant analysis is designed to classify cognitive normal (CN) subjects, early MCI (EMCI), late MCI (LMCI), and AD subjects in an exhaustive two-group classification process. Results show a dominance of the neuropsychological parameters like MMSE and RAVLT. Cortical volumetric measures of the temporal, parietal, and cingulate regions are found to be significant classification factors. Moreover, an asymmetrical distribution of the volumetric measures across hemispheres is seen for CN versus EMCI and EMCI versus AD, showing dominance of the right hemisphere; whereas CN versus LMCI and EMCI versus LMCI show dominance of the left hemisphere. A 2-fold cross-validation showed an average accuracy of 93.9%, 90.8%, and 94.5%, for the CN versus AD, CN versus LMCI, and EMCI versus AD, respectively. The accuracy for groups that are difficult to differentiate like EMCI versus LMCI was 73.6%. With the inclusion of the neuropsychological scores, a significant improvement (24.59%) was obtained over using MRI measures alone.


Figures

Figure 1
Figure 1
General construct of the classification study showing the main blocks, namely, image analysis, feature extraction, and classification.
Figure 2
Figure 2
Procedural steps of the feature extraction technique using SLRM.
Figure 3
Figure 3
Cortical and subcortical maps showing the significant volumetric regions for each classification pair. (a) CN versus AD, (b) CN versus EMCI, and (c) CN versus LMCI. The regions are listed in Table 2. For each classification pair the letter “L” or “R” signifies the left and right hemisphere, respectively. Additionally, for the cortical representations, the top images in each set show the lateral view and the bottom images show the medial views.
Figure 4
Figure 4
Cortical and subcortical maps showing the significant volumetric regions for each classification pair. (a) EMCI versus LMCI, (b) EMCI versus AD, and (c) LMCI versus AD. The regions are listed in Table 2. For each classification pair the letter “L” or “R” signifies the left and right hemisphere, respectively. Additionally, for the cortical representations, the top images in each set show the lateral view and the bottom images show the medial views.
Figure 5
Figure 5
Results of incremental analysis displaying accuracy, sensitivity, and specificity as a function of the number of features used for the classifications. (a) CN versus AD, (b) CN versus EMCI, (c) CN versus LMCI, (d) EMCI versus LMCI, (e) EMCI versus AD, and (f) LMCI versus AD.

Similar articles

Cited by

References

    1. Braak H., Braak E. Evolution of the neuropathology of Alzheimer's disease. Acta Neurologica Scandinavica Supplement . 1996;93(165):3–12. doi: 10.1111/j.1600-0404.1996.tb00530.x. - DOI - PubMed
    1. Duchesne S., Caroli A., Geroldi C., Barillot C., Frisoni G. B., Collins D. L. MRI-based automated computer classification of probable AD versus normal controls. IEEE Transactions on Medical Imaging . 2008;27(4):509–520. doi: 10.1109/tmi.2007.908685. - DOI - PubMed
    1. Fox N. C., Schott J. M. Imaging cerebral atrophy: normal ageing to Alzheimer's disease. The Lancet . 2004;363(9406):392–394. doi: 10.1016/s0140-6736(04)15441-x. - DOI - PubMed
    1. Walhovd K. B., Fjell A. M., Brewer J., et al. Combining MR imaging, positron-emission tomography, and CSF biomarkers in the diagnosis and prognosis of Alzheimer disease. American Journal of Neuroradiology . 2010;31(2):347–354. doi: 10.3174/ajnr.a1809. - DOI - PMC - PubMed
    1. Fan Y., Resnick S. M., Wu X., Davatzikos C. Structural and functional biomarkers of prodromal Alzheimer's disease: a high-dimensional pattern classification study. NeuroImage . 2008;41(2):277–285. doi: 10.1016/j.neuroimage.2008.02.043. - DOI - PMC - PubMed

Publication types