. 2015 Sep 10:303:1-15.
doi: 10.1016/j.neuroscience.2015.05.081. Epub 2015 Jun 20.

Activation of the antigen presentation function of mononuclear phagocyte populations associated with the basilar membrane of the cochlea after acoustic overstimulation

Affiliations

Activation of the antigen presentation function of mononuclear phagocyte populations associated with the basilar membrane of the cochlea after acoustic overstimulation

W Yang et al. Neuroscience. .

Abstract

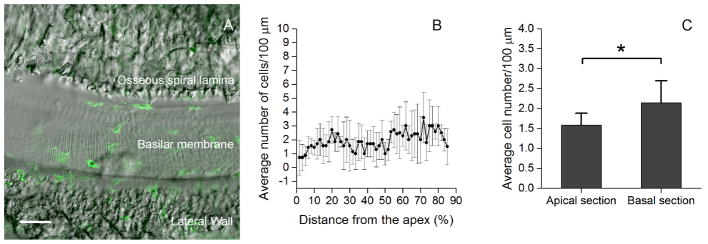
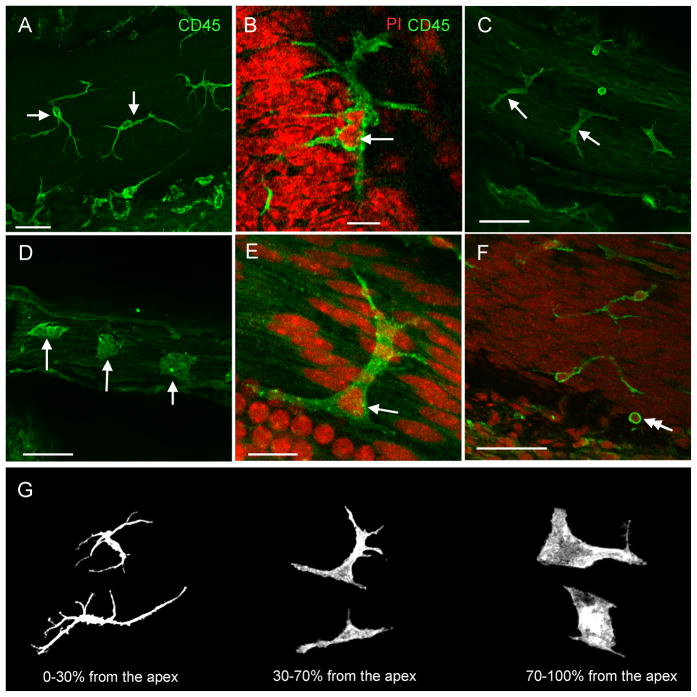
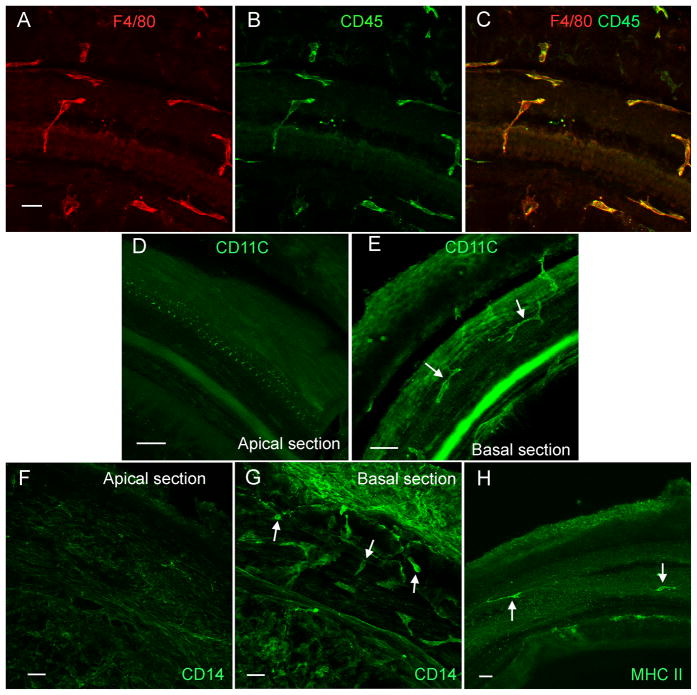
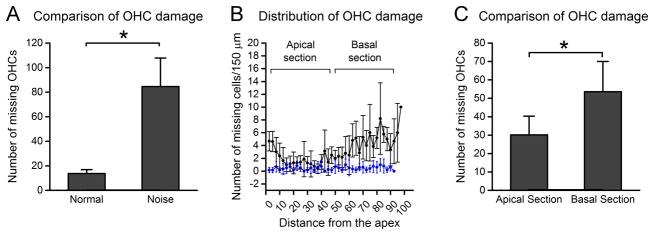
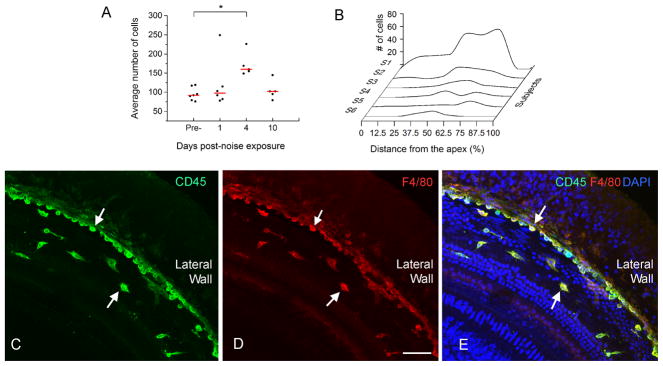
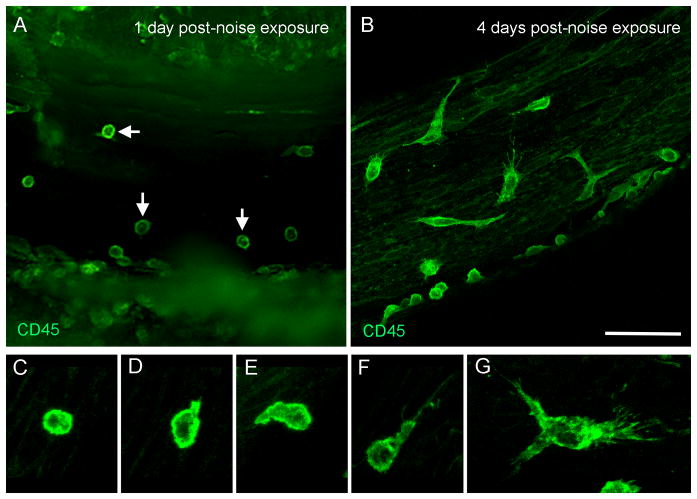
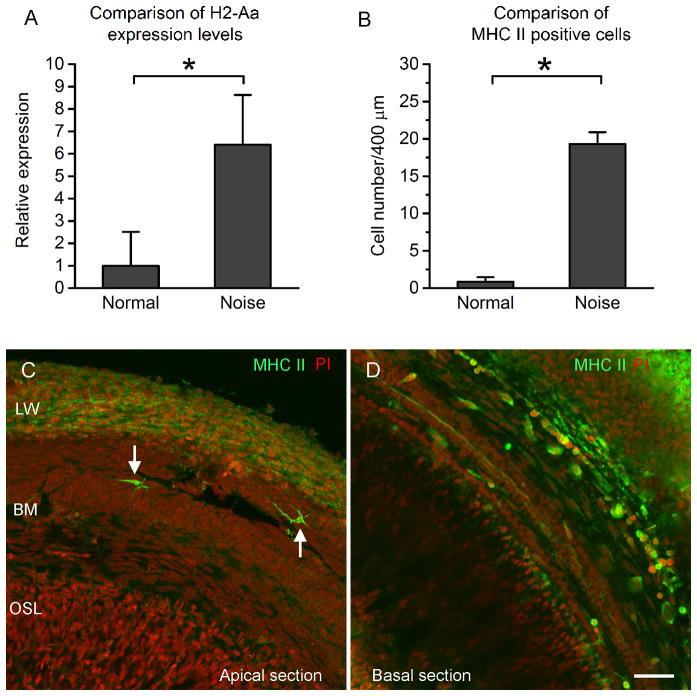
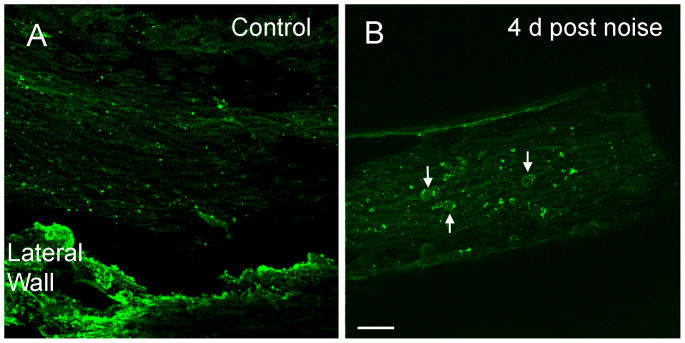
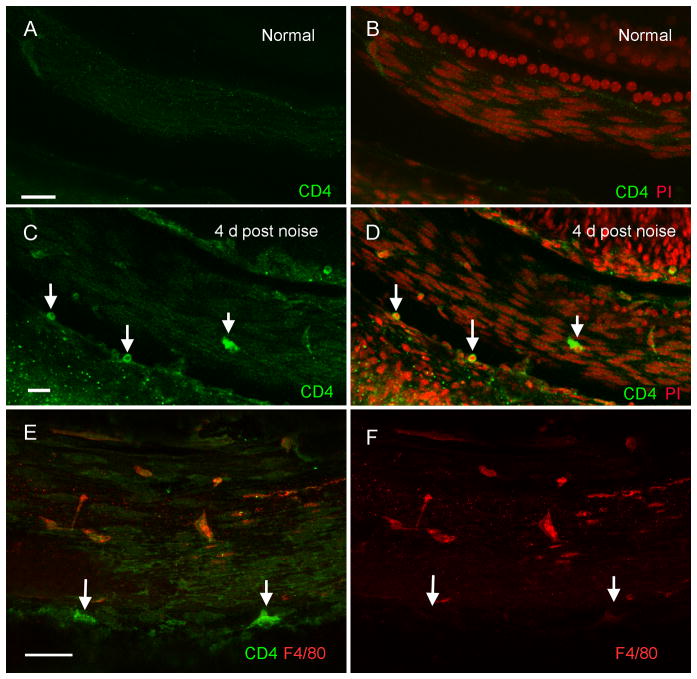
The immune response is an important component of the cochlear response to stress. As an important player in the cochlear immune system, the basilar membrane immune cells reside on the surface of the scala tympani side of the basilar membrane. At present, the immune cell properties in this region and their responses to stress are not well understood. Here, we investigated the functional role of these immune cells in the immune response to acoustic overstimulation. This study reveals that tissue macrophages are present in the entire length of the basilar membrane under steady-state conditions. Notably, these cells in the apical and the basal sections of the basilar membrane display distinct morphologies and immune protein expression patterns. Following acoustic trauma, monocytes infiltrate into the region of the basilar membrane, and the infiltrated cells transform into macrophages. While monocyte infiltration and transformation occur in both the apical and the basal sections of the basilar membrane, only the basal monocytes and macrophages display a marked increase in the expression of major histocompatibility complex (MHC) II and class II transactivator (CIITA), a MHC II production cofactor, suggesting the site-dependent activation of antigen-presenting function. Consistent with the increased expression of the antigen-presenting proteins, CD4(+) T cells, the antigen-presenting partner, infiltrate into the region of the basilar membrane where antigen-presenting proteins are upregulated. Further pathological analyses revealed that the basal section of the cochlea displays a greater level of sensory cell damage, which is spatially correlated with the region of antigen-presenting activity. Together, these results suggest that the antigen-presenting function of the mononuclear phagocyte population is activated in response to acoustic trauma, which could bridge the innate immune response to adaptive immunity.

Keywords: MHC II; antigen; cochlea; immunity; macrophage; noise.


Figures

Figure 1
Figure 1. Distribution of leukocytes on the surface of the scala tympani side of the basilar membrane
A: The surface view of the basilar membrane of the middle cochlear turn. The CD45 positive cells (green fluorescence) are located between the osseous spiral lamina and the lateral wall. B: Distribution of CD45 positive cells along the longitudinal axis of the basilar membrane from the apex to the base of the cochlea. The data presented are the average number of the CD45 positive cells per 100-μm length of the basilar membrane (mean ± 1 SD). Notice that the CD45 positive cells are scatted over the entire length of the basilar membrane. C: Comparison of the average numbers of the CD45 positive cells/100 μm between the apical (0 to 42.5% from the apex) and the basal section (42.5 to 85% from the apex) of the basilar membrane. The number of the CD45 positive cells in the basal section is slightly, but statistically significantly, greater than that in the apical section (Student’s t test, t = −2.4, df = 12, P = 0.035). Bar in Fig. 1A = 50 μm.
Figure 2
Figure 2. Distinct morphological characteristics of tissue macrophages in different sections of the basilar membrane
The tissues were stained for CD45. A: Morphology of the CD45 positive cells beneath the apical section of the basilar membrane. The CD45 positive cells display a dendritic shape with long and thin projections (arrows). B: The typical nuclear morphology of the CD45 positive cells in the apical section of the basilar membrane. The tissue was doubly stained with CD45 (green fluorescence) and propidium iodide (red fluorescence). The nucleus of the cell exhibits an irregular shape with multiple lobes (the arrow). C: Morphology of the CD45 positive cells beneath the middle section of the basilar membrane. The long projections of the cells become shortened and the volume of the cytoplasm increases (arrows). D: Morphology of the CD45 positive cells beneath the basal section of the basilar membrane. The long projections of the cells have disappeared. The cells have abundant cytoplasm (arrows). E: Typical nuclear morphology of the CD45 positive cells beneath the middle and basal sections of the basilar membrane. The arrow indicates a nucleus displaying the irregular shape with a single lobe. F: Typical morphology of the CD45 positive cells having the monocyte phenotype: a small and round cell body with a round nucleus (the double arrow). G: Summary of the morphological features of tissue macrophages along the basilar membrane from the apex to the base of the cochlea. Bars in A, C, D, and F = 50 μm, Bars in B and E = 15 μm. The images of A to F are oriented with the top being the osseous spiral lamina and the bottom being the lateral wall.
Figure 3
Figure 3. Expression of immune cell marker proteins
A, B, and C: Double-labeling of immune cells with F4/80 (A, red fluorescence) and CD45 (B, green fluorescence) in the middle section of a normal cochlea. All of the cells that have the irregular shape display both F4/80 and CD45 immunoreactivities (C). D and E: CD11c immunoreactivity in the macrophages beneath the basilar membrane of a normal cochlea. CD11c immunoreactivity is not detectable in the macrophages beneath the apical section of the basilar membrane (D). By contrast, the macrophages beneath the basal section display strong CD11c immunoreactivity (arrows, E). Mesothelial cells display weaker CD11c immunoreactivity. F and G: CD14 immunoreactivity in the macrophages of the basilar membrane of a normal cochlea. The CD14 immunoreactivity is not detectable in the macrophages beneath the apical section of the basilar membrane (F). Mesothelial cells display weak florescence. In contrast, the macrophages beneath the basal section of the basilar membrane display strong CD14 immunoreactivity (arrows, G). H: MHC II immunoreactivity in the macrophages of the basilar membrane. The positively stained cells (arrows) are scatted along the basilar membrane. Bars = 25 μm. All images are oriented with the top being the lateral wall and the bottom being the osseous spiral lamina.
Figure 4
Figure 4. Distribution of outer hair cell damage after exposure to the intense noise
The cochleae were collected at 10 days after noise exposure and the missing outer hair cells were quantified. A: Comparison of the numbers of missing outer hair cells between the noise-damaged cochleae (n = 6) and the control cochleae (n = 6). The average number of missing cells in the noise-injured ears is significantly higher than in the control ears (Student’s t test, t = −7.375, df = 11, P = 0.001), indicating that the noise level used in this study induces sensory cell damage. B: The distribution of missing outer hair cells as the function of the distance from the apex to the base of the cochlea. Notice that the missing cells appear more prominently in the basal section of the cochlea. C: Comparison of the numbers of missing cells between the apical section (0 to 42.5% from the apex) and the basal section (42.5 to 85% from the apex) of the cochlea. The average number of missing cells in the basal section is significantly higher than that observed in the apical section (Student’s t test, t = −3.375, df = 13, P = 0.005). OHC: outer hair cells.
Figure 5
Figure 5. Infiltration of monocytes after acoustic overstimulation
A: Comparison of the numbers of CD45 positive cells between the control and three post-noise groups. The red lines represent the average numbers of the CD45 positive cells per basilar membrane of the cochlea and the dots represent the numbers of CD45 positive cells in individual samples. The mean value in the 4-day group is significantly greater than in the control group (One way ANOVA on Rank, H=9.4, df = 3, P = 0.024, Dunn’s method for post hoc all pairwise multiple comparison, 4-d vs. normal, q = 2.93, P < 0.05). B: Distribution of CD45 positive cells that had the monocyte morphology along the basilar membrane of the six cochleae examined at 1 day post-noise exposure. Small clusters of the positive cells are present in the middle section of the basilar membrane (approximately 30 to 70% from the apex). Large clusters of CD45 positive cells spread toward both the apical and basal direction with more cells in the basal section. Y axis: the number of CD45 positive cells/600 μm. S1 to S6 indicate the data of individual cochleae. The data points are connected using the Akima Spline interpolation algorithm. C, D and E: A typical distribution pattern of the infiltrated monocytes in the middle section of a noise-damaged cochlea that was examined at 4 days post-noise exposure and was stained with CD45 (green fluorescence in Fig. 5C), F4/80 (red fluorescence in Fig. 5D) and DAPI (blue fluorescence in Fig. 5E). Notice that a large number of cells showing the monocyte morphology are accumulated in the juncture between the basilar membrane and the lateral wall (arrows). Bar in D = 50 μm.
Figure 6
Figure 6. Transformation of monocytes to macrophages after acoustic injury
The images show the tissues that were collected from the basal half of the cochleae and were stained with CD45. A: The typical morphology of the CD45 positive cells at 1 day post-noise exposure. Notice that a large number of the cells display the monocyte morphology (arrows). The cells with irregular shapes are barely seen. B: The typical morphology of the CD45 positive cells at 4 days post-noise exposure. The cells display diverse morphologies, suggesting the active transformation from monocytes into macrophages. C to G: Transforming continuum between monocytes and macrophages. Bar in B = 50 μm. The images of A and B are oriented with the top being the osseous spiral lamina and the bottom being the lateral wall.
Figure 7
Figure 7. Expression of MHC II in monocytes and macrophages after acoustic trauma
A: Comparison of the mRNA expression levels of H2-Aa, a MHC II gene, in the basilar membrane/lateral wall tissues between the control (n = 3) and the noise samples (n = 4). The noise samples were examined at 4 day after noise exposure. The expression level of H2-Aa in the noise samples is significantly increased after the acoustic trauma (Student’s t test, t = 3.63, df = 5, P = 0.015), indicating the transcriptional increase in gene expression after noise exposure. B: Comparison of the MHC II positive cells between the control cochleae (n = 4) and the noise-damaged cochleae examined at 4 days after noise exposure (n = 4). The average number of positive cells is significantly increased after noise exposure (a Mann-Whitney Rank Sum test, Student’s t test, t = 26.0, P=0.029). C and D: Immunoreactivity of MHC II in a cochlea examined at 4 days post-noise exposure. The cochlea was stained with MHC II (green fluorescence) and propidium iodide (PI, red fluorescence). In the apical section (C), only a few MHC II positive cells are present (arrows). These positive cells display the typical dendritic shape. This distribution pattern of the positive cells beneath the apical section of the basilar membrane is similar to that observed in the control cochleae (see Fig 3H). In contrast, a large number of MHC II positive cells are present beneath the basal section of the basilar membrane (D), suggesting a location-specific increase in MHC II expression in the macrophages beneath the basilar membrane. Bar = 50 μm. LW = the lateral wall. BM = the basilar membrane. OSL = osseous spiral lamina.
Figure 8
Figure 8. Expression of CIITA after acoustic trauma
A: A typical image shows the immunoreactivity of CIITA in the basilar membrane of the basal section of a control cochlea. Macrophages lack the immunostaining. Mesothelial cells on the basilar membrane display weak immunoreactivity. The tissue in the bottom of the image is the residual lateral wall tissue, which is not the focus of the current study. B: Immunoreactivity of CIITA in the basilar membrane of the basal section of a noise-damaged cochlea examined at 4 days after noise exposure. Arrows indicate the macrophages with increased CIITA immunoreactivity.
Figure 9
Figure 9. Immunoreactivity of CD4 in normal and noise-damaged cochleae
The images show the basilar membrane of the basal section of cochleae. A and B: CD4 immunolabeling of the basilar membrane of a control cochlea. To illustrate the tissue structure, the sample was doubly stained with CD4 (green fluorescence) and propidium iodide (PI, red fluorescence). No CD4 positive cells are present in the normal cochlea. C and D: CD4 immunolabeling in a noise-damaged cochlea at 4 days after noise exposure. Arrows indicate the CD4 positive cells. Many of these cells are small and in round shape, the typical T cell morphology. E and F: Double labeling of CD4 (green fluorescence) and F4/80 (red fluorescence) in a basilar membrane examined at 4 days after noise exposure. Arrows indicate CD4 positive cells. These cells lack F4/80 immunoreactivity. Bar = 25 μm. All images are oriented with the top being the osseous spiral lamina and the bottom being the lateral wall.

Similar articles

Cited by

References

    1. Bohne BA, Harding GW, Lee SC. Death pathways in noise-damaged outer hair cells. Hear Res. 2007;223:61–70. - PubMed
    1. Cai Q, Wang B, Patel M, Yang SM, Hu BH. RNAlater facilitates microdissection of sensory cell-enriched samples from the mouse cochlea for transcriptional analyses. J Neurosci Methods. 2013;219:240–251. - PMC - PubMed
    1. Cai Q, Vethanayagam RR, Yang S, Bard J, Jamison J, Cartwright D, Dong Y, Hu BH. Molecular profile of cochlear immunity in the resident cells of the organ of Corti. Journal of Neuroinflammation. 2014;11:173. - PMC - PubMed
    1. Cao Q, Wang Y, Wang XM, Lu J, Lee VW, Ye Q, Nguyen H, Zheng G, Zhao Y, Alexander SI, Harris DC. Renal F4/80+CD11c+ Mononuclear Phagocytes Display Phenotypic and Functional Characteristics of Macrophages in Health and in Adriamycin Nephropathy. J Am Soc Nephrol 2014 - PMC - PubMed
    1. Chang C-H, Fontes JD, Peterlin M, Flavell RA. Class II transactivator (CIITA) is sufficient for the inducible expression of major histocompatibility complex class II genes. The Journal of experimental medicine. 1994;180:1367–1374. - PMC - PubMed

Publication types