

The dynamics of Rho GTPase signaling and implications for targeting cancer and the tumor microenvironment
- PMID: 26103062
- PMCID: PMC4601362
- DOI: 10.4161/21541248.2014.973749
The dynamics of Rho GTPase signaling and implications for targeting cancer and the tumor microenvironment
Abstract
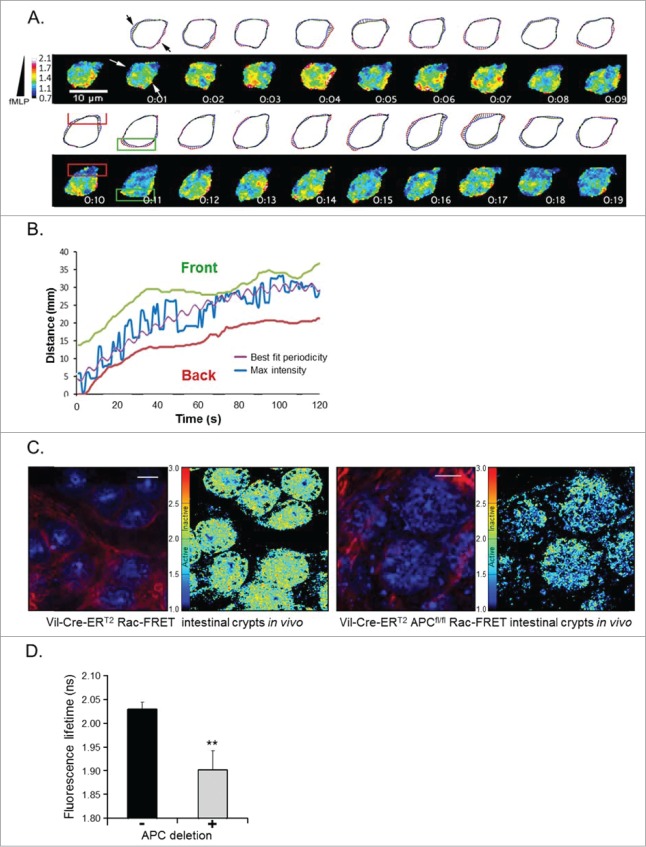
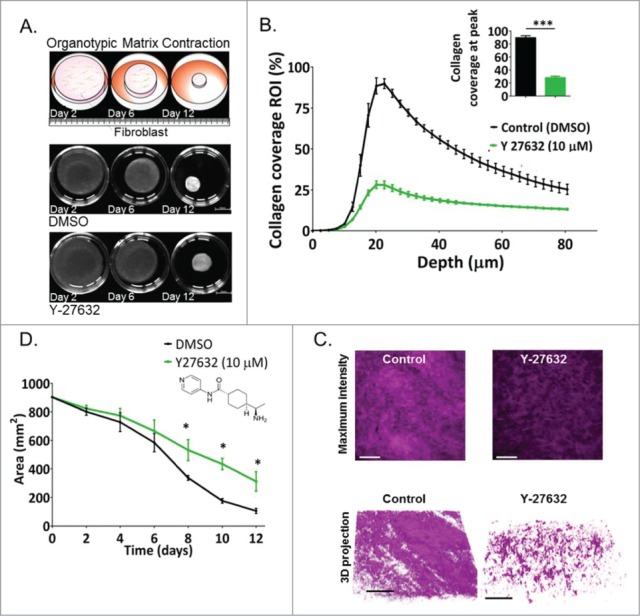
Numerous large scale genomics studies have demonstrated that cancer is a molecularly heterogeneous disease, characterized by acquired changes in the structure and DNA sequence of tumor genomes. More recently, the role of the equally complex tumor microenvironment in driving the aggressiveness of this disease is increasingly being realized. Tumor cells are surrounded by activated stroma, creating a dynamic environment that promotes cancer development, metastasis and chemoresistance. The Rho family of small GTPases plays an essential role in the regulation of cell shape, cytokinesis, cell adhesion, and cell motility. Importantly, these processes need to be considered in the context of a complex 3-dimensional (3D) environment, with reciprocal feedback and cross-talk taking place between the tumor cells and host environment. Here we discuss the role of molecular networks involving Rho GTPases in cancer, and the therapeutic implications of inhibiting Rho signaling in both cancer cells and the emerging concept of targeting the surrounding stroma.
Keywords: ECM; FLIM; FRET; Rho GTPase; Rho inhibitors; cancer stroma; chemoresistance; collagen; intravital imaging.
Figures
References
-
- Biankin AV, Waddell N, Kassahn KS, Gingras MC, Muthuswamy LB, Johns AL, Miller DK, Wilson PJ, Patch AM, Wu J, et al. . Pancreatic cancer genomes reveal aberrations in axon guidance pathway genes. Nature 2012; 491:399-405; PMID:23103869; http://dx.doi.org/10.1038/nature11547 - DOI - PMC - PubMed
-
- Brennan CW, Verhaak RG, McKenna A, Campos B, Noushmehr H, Salama SR, Zheng S, Chakravarty D, Sanborn JZ, Berman SH, et al. . The somatic genomic landscape of glioblastoma. Cell 2013; 155:462-77; PMID:24120142; http://dx.doi.org/10.1016/j.cell.2013.09.034 - DOI - PMC - PubMed
-
- Kandoth C, McLellan MD, Vandin F, Ye K, Niu B, Lu C, Xie M, Zhang Q, McMichael JF, Wyczalkowski MA, et al. . Mutational landscape and significance across 12 major cancer types. Nature 2013; 502:333-9; PMID:24132290; http://dx.doi.org/10.1038/nature12634 - DOI - PMC - PubMed
-
- Straussman R, Morikawa T, Shee K, Barzily-Rokni M, Qian ZR, Du J, Davis A, Mongare MM, Gould J, Frederick DT, et al. . Tumour micro-environment elicits innate resistance to RAF inhibitors through HGF secretion. Nature 2012; 487:500-4; PMID:22763439; http://dx.doi.org/10.1038/nature11183 - DOI - PMC - PubMed
-
- Fang H, Declerck YA. Targeting the tumor microenvironment: from understanding pathways to effective clinical trials. Cancer Res 2013; 73:4965-77; PMID:23913938; http://dx.doi.org/10.1158/0008-5472.CAN-13-0661 - DOI - PMC - PubMed
Publication types
MeSH terms
Substances
Grants and funding
LinkOut - more resources
Full Text Sources
Other Literature Sources