

Evaluation of an electron Monte Carlo dose calculation algorithm for treatment planning
- PMID: 26103470
- PMCID: PMC5690146
- DOI: 10.1120/jacmp.v16i3.4636
Evaluation of an electron Monte Carlo dose calculation algorithm for treatment planning
Abstract
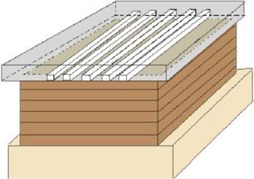
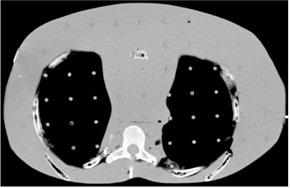
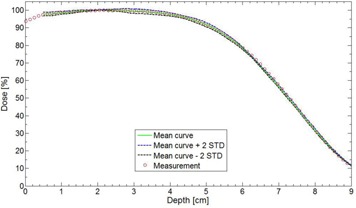
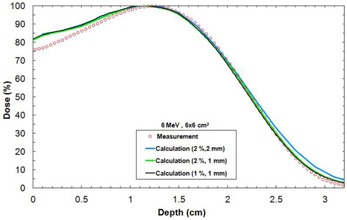
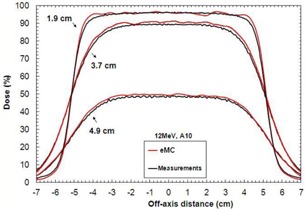
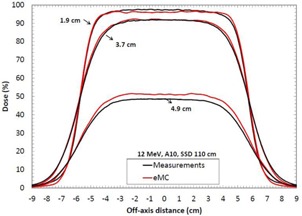
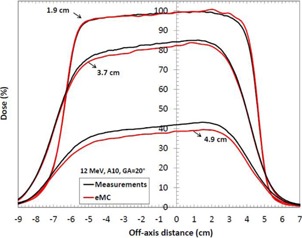
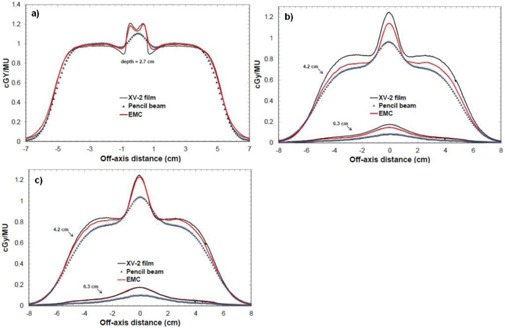
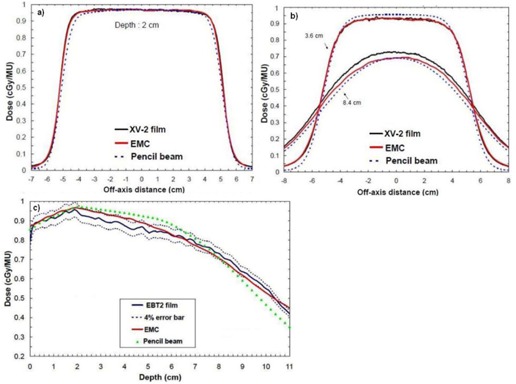
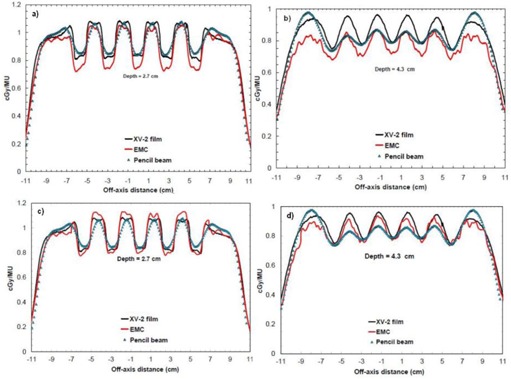
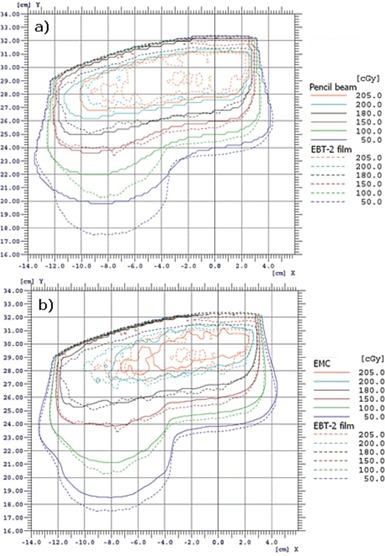
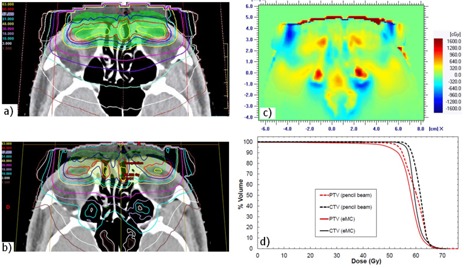
The purpose of this study is to evaluate the accuracy of the electron Monte Carlo (eMC) dose calculation algorithm included in a commercial treatment planning system and compare its performance against an electron pencil beam algorithm. Several tests were performed to explore the system's behavior in simple geometries and in configurations encountered in clinical practice. The first series of tests were executed in a homogeneous water phantom, where experimental measurements and eMC-calculated dose distributions were compared for various combinations of energy and applicator. More specifically, we compared beam profiles and depth-dose curves at different source-to-surface distances (SSDs) and gantry angles, by using dose difference and distance to agreement. Also, we compared output factors, we studied the effects of algorithm input parameters, which are the random number generator seed, as well as the calculation grid size, and we performed a calculation time evaluation. Three different inhomogeneous solid phantoms were built, using high- and low-density materials inserts, to clinically simulate relevant heterogeneity conditions: a small air cylinder within a homogeneous phantom, a lung phantom, and a chest wall phantom. We also used an anthropomorphic phantom to perform comparison of eMC calculations to measurements. Finally, we proceeded with an evaluation of the eMC algorithm on a clinical case of nose cancer. In all mentioned cases, measurements, carried out by means of XV-2 films, radiographic films or EBT2 Gafchromic films. were used to compare eMC calculations with dose distributions obtained from an electron pencil beam algorithm. eMC calculations in the water phantom were accurate. Discrepancies for depth-dose curves and beam profiles were under 2.5% and 2 mm. Dose calculations with eMC for the small air cylinder and the lung phantom agreed within 2% and 4%, respectively. eMC calculations for the chest wall phantom and the anthropomorphic phantom also showed a positive agreement with the measurements. The retrospective dosimetric comparison of a clinical case, which presented scatter perturbations by air cavities, showed a difference in dose of up to 20% between pencil beam and eMC algorithms. When comparing to the pencil beam algorithm, eMC calculations are definitely more accurate at predicting large dose perturbations due to inhomogeneities.
Figures
Similar articles
-
Comprehensive evaluation and clinical implementation of commercially available Monte Carlo dose calculation algorithm.J Appl Clin Med Phys. 2013 Mar 4;14(2):4062. doi: 10.1120/jacmp.v14i2.4062. J Appl Clin Med Phys. 2013. PMID: 23470937 Free PMC article.
-
Evaluation of the Eclipse eMC algorithm for bolus electron conformal therapy using a standard verification dataset.J Appl Clin Med Phys. 2016 May 8;17(3):52-60. doi: 10.1120/jacmp.v17i3.5885. J Appl Clin Med Phys. 2016. PMID: 27167259 Free PMC article.
-
A comparison of electron beam dose calculation accuracy between treatment planning systems using either a pencil beam or a Monte Carlo algorithm.Int J Radiat Oncol Biol Phys. 2005 Oct 1;63(2):622-33. doi: 10.1016/j.ijrobp.2005.06.016. Int J Radiat Oncol Biol Phys. 2005. PMID: 16168854
-
High-density dental implants and radiotherapy planning: evaluation of effects on dose distribution using pencil beam convolution algorithm and Monte Carlo method.J Appl Clin Med Phys. 2015 Sep 8;16(5):46–52. doi: 10.1120/jacmp.v16i5.5612. J Appl Clin Med Phys. 2015. PMID: 26699323 Free PMC article. Review.
-
Advanced Proton Beam Dosimetry Part I: review and performance evaluation of dose calculation algorithms.Transl Lung Cancer Res. 2018 Apr;7(2):171-179. doi: 10.21037/tlcr.2018.04.05. Transl Lung Cancer Res. 2018. PMID: 29876316 Free PMC article. Review.
Cited by
-
Quantitative evaluation of dosimetric uncertainties in electron therapy by measurement and calculation using the electron Monte Carlo dose algorithm in the Eclipse treatment planning system.J Appl Clin Med Phys. 2022 Jan;23(1):e13478. doi: 10.1002/acm2.13478. Epub 2021 Nov 25. J Appl Clin Med Phys. 2022. PMID: 34822731 Free PMC article.
-
Validation of the RayStation Monte Carlo dose calculation algorithm using a realistic lung phantom.J Appl Clin Med Phys. 2019 Dec;20(12):127-137. doi: 10.1002/acm2.12777. Epub 2019 Nov 25. J Appl Clin Med Phys. 2019. PMID: 31763759 Free PMC article.
-
Optimal values of the Electron Monte Carlo dose engine parameters.Rep Pract Oncol Radiother. 2023 Jul 25;28(3):416-428. doi: 10.5603/RPOR.a2023.0044. eCollection 2023. Rep Pract Oncol Radiother. 2023. PMID: 37795396 Free PMC article.
-
Feasibility study for dose calculation with a radiation treatment planning system using a fixed-size electron cone applicator for small electron fields.PLoS One. 2025 Aug 14;20(8):e0324722. doi: 10.1371/journal.pone.0324722. eCollection 2025. PLoS One. 2025. PMID: 40811639 Free PMC article.
-
Evaluation of electron Monte Carlo algorithm accuracy for dose calculations in extended source-to-surface distances electron beam therapy.J Appl Clin Med Phys. 2025 Sep;26(9):e70237. doi: 10.1002/acm2.70237. J Appl Clin Med Phys. 2025. PMID: 40883099 Free PMC article.
References
-
- Ma CM, Jiang SB. Monte Carlo modelling of electron beams from medical accelerators. Phys Med Biol. 1999;44(12):R157–R189. - PubMed
-
- Verhaegen F and Seuntjens J. Monte Carlo modelling of external radiotherapy photon beams. Phys Med Biol. 2003;48(21):R107–R164. - PubMed
-
- Rogers DW. Fifty years of Monte Carlo simulations for medical physics. Phys Med Biol. 2006;51(13):R287–R301. - PubMed
-
- Curran BH, Balter JM, Chety IJ. Integrating new technologies into the clinic: Monte Carlo and image‐guided radiation therapy. Madison, WI: Medical Physics Publishing; 2006.
-
- Neunschwander H, Mackie TR, Reckwerdt PJ. MCC — a high performance Monte Carlo code for electron beam treatment planning. Phys Med Biol. 1995;40(4):543–74. - PubMed
Publication types
MeSH terms
LinkOut - more resources
Full Text Sources
Other Literature Sources
