

Comparison between two different algorithms used for pretreatment QA via aSi portal images
- PMID: 26103481
- PMCID: PMC5690134
- DOI: 10.1120/jacmp.v16i3.5202
Comparison between two different algorithms used for pretreatment QA via aSi portal images
Abstract
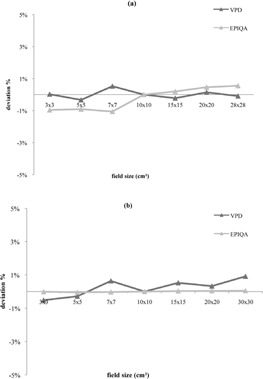
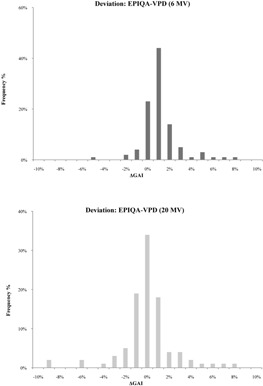
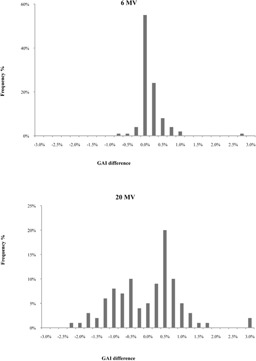
Several algorithms exist to perform quality assurance for volumetric-modulated arc therapy (VMAT) treatments based on electronic portal imaging devices (EPID). These algorithms are used to compare doses (convert into water, GLAaS) and fluences (in amorphous silicon (aSi), Varian portal dosimetry). The aim of this study is to compare the two methods using clinical data. In this study, Varian portal dosimetry (VPD) and Epiqa solutions were compared. We used a same set of patient images data treated with 6 MV and 20 MV photon energies and different locations. The response of the portal imaging device was also investigated with different field sizes, monitor units, dose rates, sag effect, and linac daily output. All images were acquired on an electronic portal imaging device (EPID) positioned at source detector distance (SDD) of 100 cm. A virtual water phantom was used for Epiqa to calculate the dose matrices at the maximum depth doses dmax. The 2D gamma evaluation index (GAI) was performed to quantitatively compare the results given by the two solutions. The response of the EPID gave a good agreement with Epiqa (deviation less than 1%) for MU greater than 20 for both 6 MV and 20 MV photon energies. For VPD, the upward sloping trend showed a good agreement for MU higher than 50. Dose rate evaluations for both methods gave a deviation of, respectively, 0.4 and 0.5 % for 6 MV and 20 MV. The gamma criteria of 3 mm for distance to agreement and 3 % for dose difference was, as mean ± 1SD, 99.81% ± 1.48% and 99.42% ± 0.97% for VPD and Epiqa, respectively, for 6 MV photon energy. The mean values of the gamma criteria for the collected data using 20 MV photon energy were, respectively, 98.33% ± 2.41% and 98.12% ± 1.99% for VPD and Epiqa. The output constancy deviation correction (a 10 × 10cm² reference field plan to obtain absorbed dose despite the linac monitor daily variations) showed a mean deviation of, respectively, 0.07% ± 0.57% and 0.16% ± 1.38% for 6 MV and 20 MV photon energies. For sag effect, a slight improvement was noticed for realignment of the integrated image and was 0.25%± 0.69% for 6 MV and 0.40% ± 0.57% for 20 MV. The clinical data were used for pretreatment QA with the two systems, both VPD and Epiqa software, showed acceptable and similar results for low and high energies. Furthermore, Epiqa shows better linearity response for low MU.
Figures


References
-
- Otto K. Volumetric modulated arc therapy: IMRT in a single gantry arc. Med Phys. 2008;35(1):310–17. - PubMed
-
- Bush K, Townson R, Zavgorodni S. Monte Carlo simulation of RapidArc radiotherapy delivery. Phys Med Biol. 2008;53(19):N359–N370. - PubMed
-
- Buonamici FB, Compagnucci A, Marrazzo L, Russo S, Bucciolini M. An intercomparison between film dosimetry and diode matrix for IMRT quality assurance. Med Phys. 2007;34(4):1372–79. - PubMed
-
- Schreibmann E, Dhabaan A, Elder E, Fox T. Patient‐specific quality assurance method for VMAT treatment delivery. Med Phys. 2009;36(10):4530–35. - PubMed
-
- Bailey DW, Kumaraswamy L, Bakhtiari M, Malhotra HK, Podgorsak MB. EPID dosimetry for pretreatment quality assurance with two commercial systems. J Appl Clin Med Phys [Electronic version]. 2012;13(4):3736 Available from: http://www.ncbi.nlm.nih.gov/pubmed/22766944 - PMC - PubMed
Publication types
MeSH terms
LinkOut - more resources
Full Text Sources
Other Literature Sources
Research Materials
